A treatment center we audited last month had a homepage that loaded the hero image in 5.8 seconds on mobile. The marketing director told us the site felt fast on her MacBook in the office. She was looking at desktop performance on a fiber connection.
The family member at 11 PM was looking at the same page on a five-year-old Android with one bar of signal in a hotel room. The two experiences were not the same site.
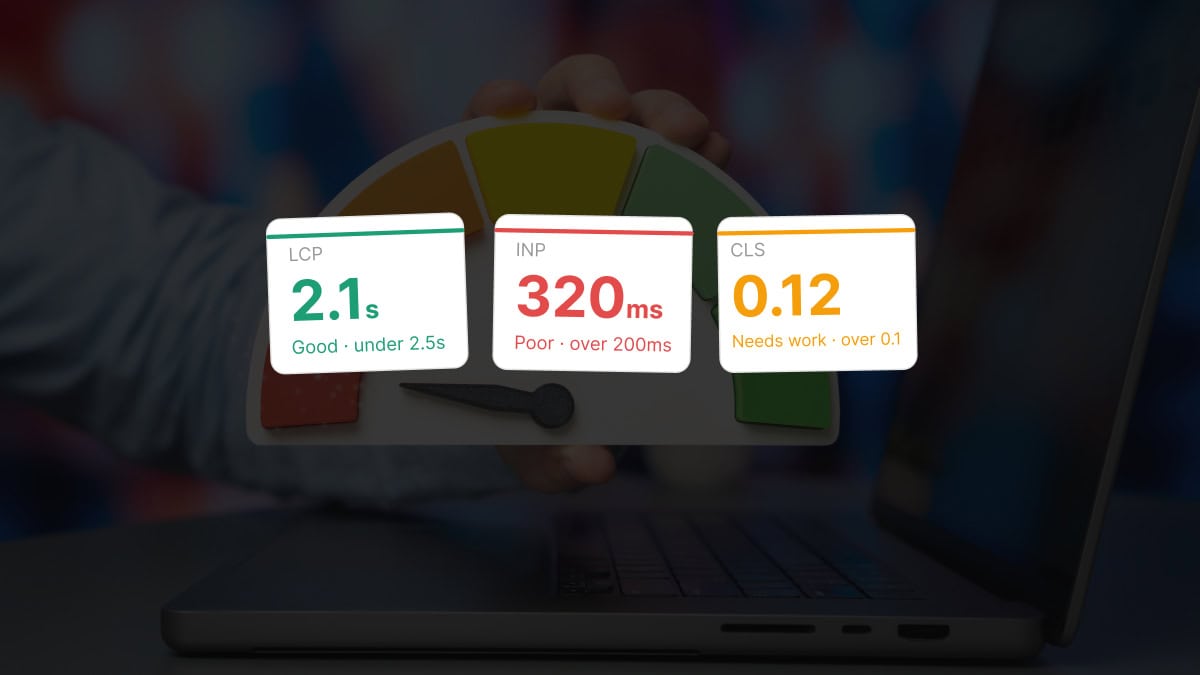
The facility’s mobile Core Web Vitals scores were failing on all three primary metrics. Largest Contentful Paint at 5.8 seconds against a 2.5-second “good” threshold. Interaction to Next Paint at 340 milliseconds against a 200-millisecond threshold. Cumulative Layout Shift at 0.22 against a 0.1 threshold.
The site was passing none of the three signals Google evaluates as the page experience layer of its ranking system. Roughly 47 percent of mobile sessions were bouncing inside the first 3 seconds.
The fix took 60 days of engineering work. The result was a Largest Contentful Paint of 1.9 seconds, Interaction to Next Paint of 140 milliseconds, and Cumulative Layout Shift of 0.04. All three metrics moved into the “good” band.
Mobile bounce rate dropped 22 percent. Organic traffic to the cluster pages rose 31 percent over the following 90 days, and admit-attributed conversion from the site rose with it.
This piece is the operator-facing read on what Core Web Vitals are, what thresholds Google actually evaluates against, and where healthcare sites typically sit in the broader benchmark distribution.
It covers the BH-specific failure modes that produce most of the gap we see in SEO audits of treatment center websites. The page-performance layer sits underneath everything else in the SEO program.
Key Takeaways
- Core Web Vitals are three measurable signals Google uses to evaluate page experience as part of its broader ranking system. Largest Contentful Paint measures load speed. Interaction to Next Paint measures responsiveness. Cumulative Layout Shift measures visual stability. The “good” thresholds in 2026 are LCP under 2.5 seconds, INP under 200 milliseconds, and CLS under 0.1 on mobile, measured at the 75th percentile of page loads.
- Healthcare websites sit below most industry benchmarks on Core Web Vitals. The combination of heavy page builders, hero video, third-party scripts, and accumulated technical debt produces mobile CWV scores that frequently fail on all three metrics. Treatment center sites specifically tend to lag healthcare overall.
- The BH audience makes CWV more load-bearing than in other categories. The family member at 11 PM on a phone with spotty signal does not wait for a slow page. Mobile is roughly 65 to 75 percent of treatment center traffic, and the slow-mobile penalty compounds with the trust threshold that healthcare YMYL pages face.
- Most BH facilities can close the CWV gap in 60 to 90 days of focused engineering work, producing 15 to 30 percent organic traffic lift and meaningful conversion lift downstream. The work clusters in image optimization, third-party script audit, page builder rationalization, and font and render path tuning.
- Core Web Vitals compound with E-E-A-T, schema, and AI search infrastructure. A page that loads fast, has named clinical authorship, deploys strong schema, and is structured for AI extraction outperforms a page with any single layer in isolation by a multiple. CWV is the foundation that makes the other layers actually work.
What Core Web Vitals Are (And Why They Matter in 2026)
Core Web Vitals are three real-world performance metrics Google publishes as the page-experience layer of its ranking system. Google’s web.dev reference for Core Web Vitals defines the three metrics, sets thresholds, and provides the canonical optimization guidance Google itself points to.
The three metrics measure different aspects of the user experience.
Largest Contentful Paint (LCP). How quickly the largest visible content element on the page renders. The “largest content element” is typically the hero image, hero video poster, or a large block of text in the above-the-fold viewport.
LCP is the closest proxy to “how fast did the page actually load from the user’s perspective.”
Interaction to Next Paint (INP). How responsive the page feels to user interaction. INP measures the longest delay between user interaction (tap, click, keypress) and the next visible response from the page.
INP replaced First Input Delay (FID) as the primary responsiveness metric in March 2024 and is the harder metric for most sites to optimize.
Cumulative Layout Shift (CLS). How visually stable the page is during load. CLS measures unexpected layout shifts (images loading and pushing content down, ads inserting between paragraphs, fonts swapping mid-render) and aggregates them into a single score.
A high CLS score means the page jumps around as it loads, which produces a poor user experience and frequently a mis-tapped CTA.
The metrics are measured in the field, not in the lab. Google uses the Chrome User Experience Report (CrUX) to aggregate real-user data from Chrome users who have opted into measurement.
The CrUX dataset is what feeds into Google Search Console’s Core Web Vitals report and is the data Google uses for ranking decisions.
The page-experience signal is part of Google’s broader ranking algorithm. Google’s page experience documentation is explicit that great page content is the primary ranking signal, and page experience tunes that ranking at the margin.
The implication is that CWV does not single-handedly determine ranking. It determines whether a page with otherwise-strong content is materially handicapped against a competitor with the same content quality and better performance.
For treatment center sites in 2026, CWV is load-bearing for three reasons. First, the audience is mobile-heavy and time-pressured. Second, Healthcare YMYL pages face a stricter quality threshold that includes page experience signals. Third, AI search citation eligibility increasingly weights page-experience signals as proxies for site quality.
Google’s Thresholds: Good / Needs Improvement / Poor
≤2.5s
LCP threshold for Good. Anything above 4.0s is Poor. Measured at the 75th percentile of mobile page loads.
≤200ms
INP threshold for Good. Above 500ms is Poor. Interaction latency includes taps, clicks, and keystrokes.
≤0.1
CLS threshold for Good. Above 0.25 is Poor. Any layout shift after first paint counts against the score.
75%
Percentile Google uses. A page hits Good only when 75 percent of mobile loads pass the threshold, not the average.
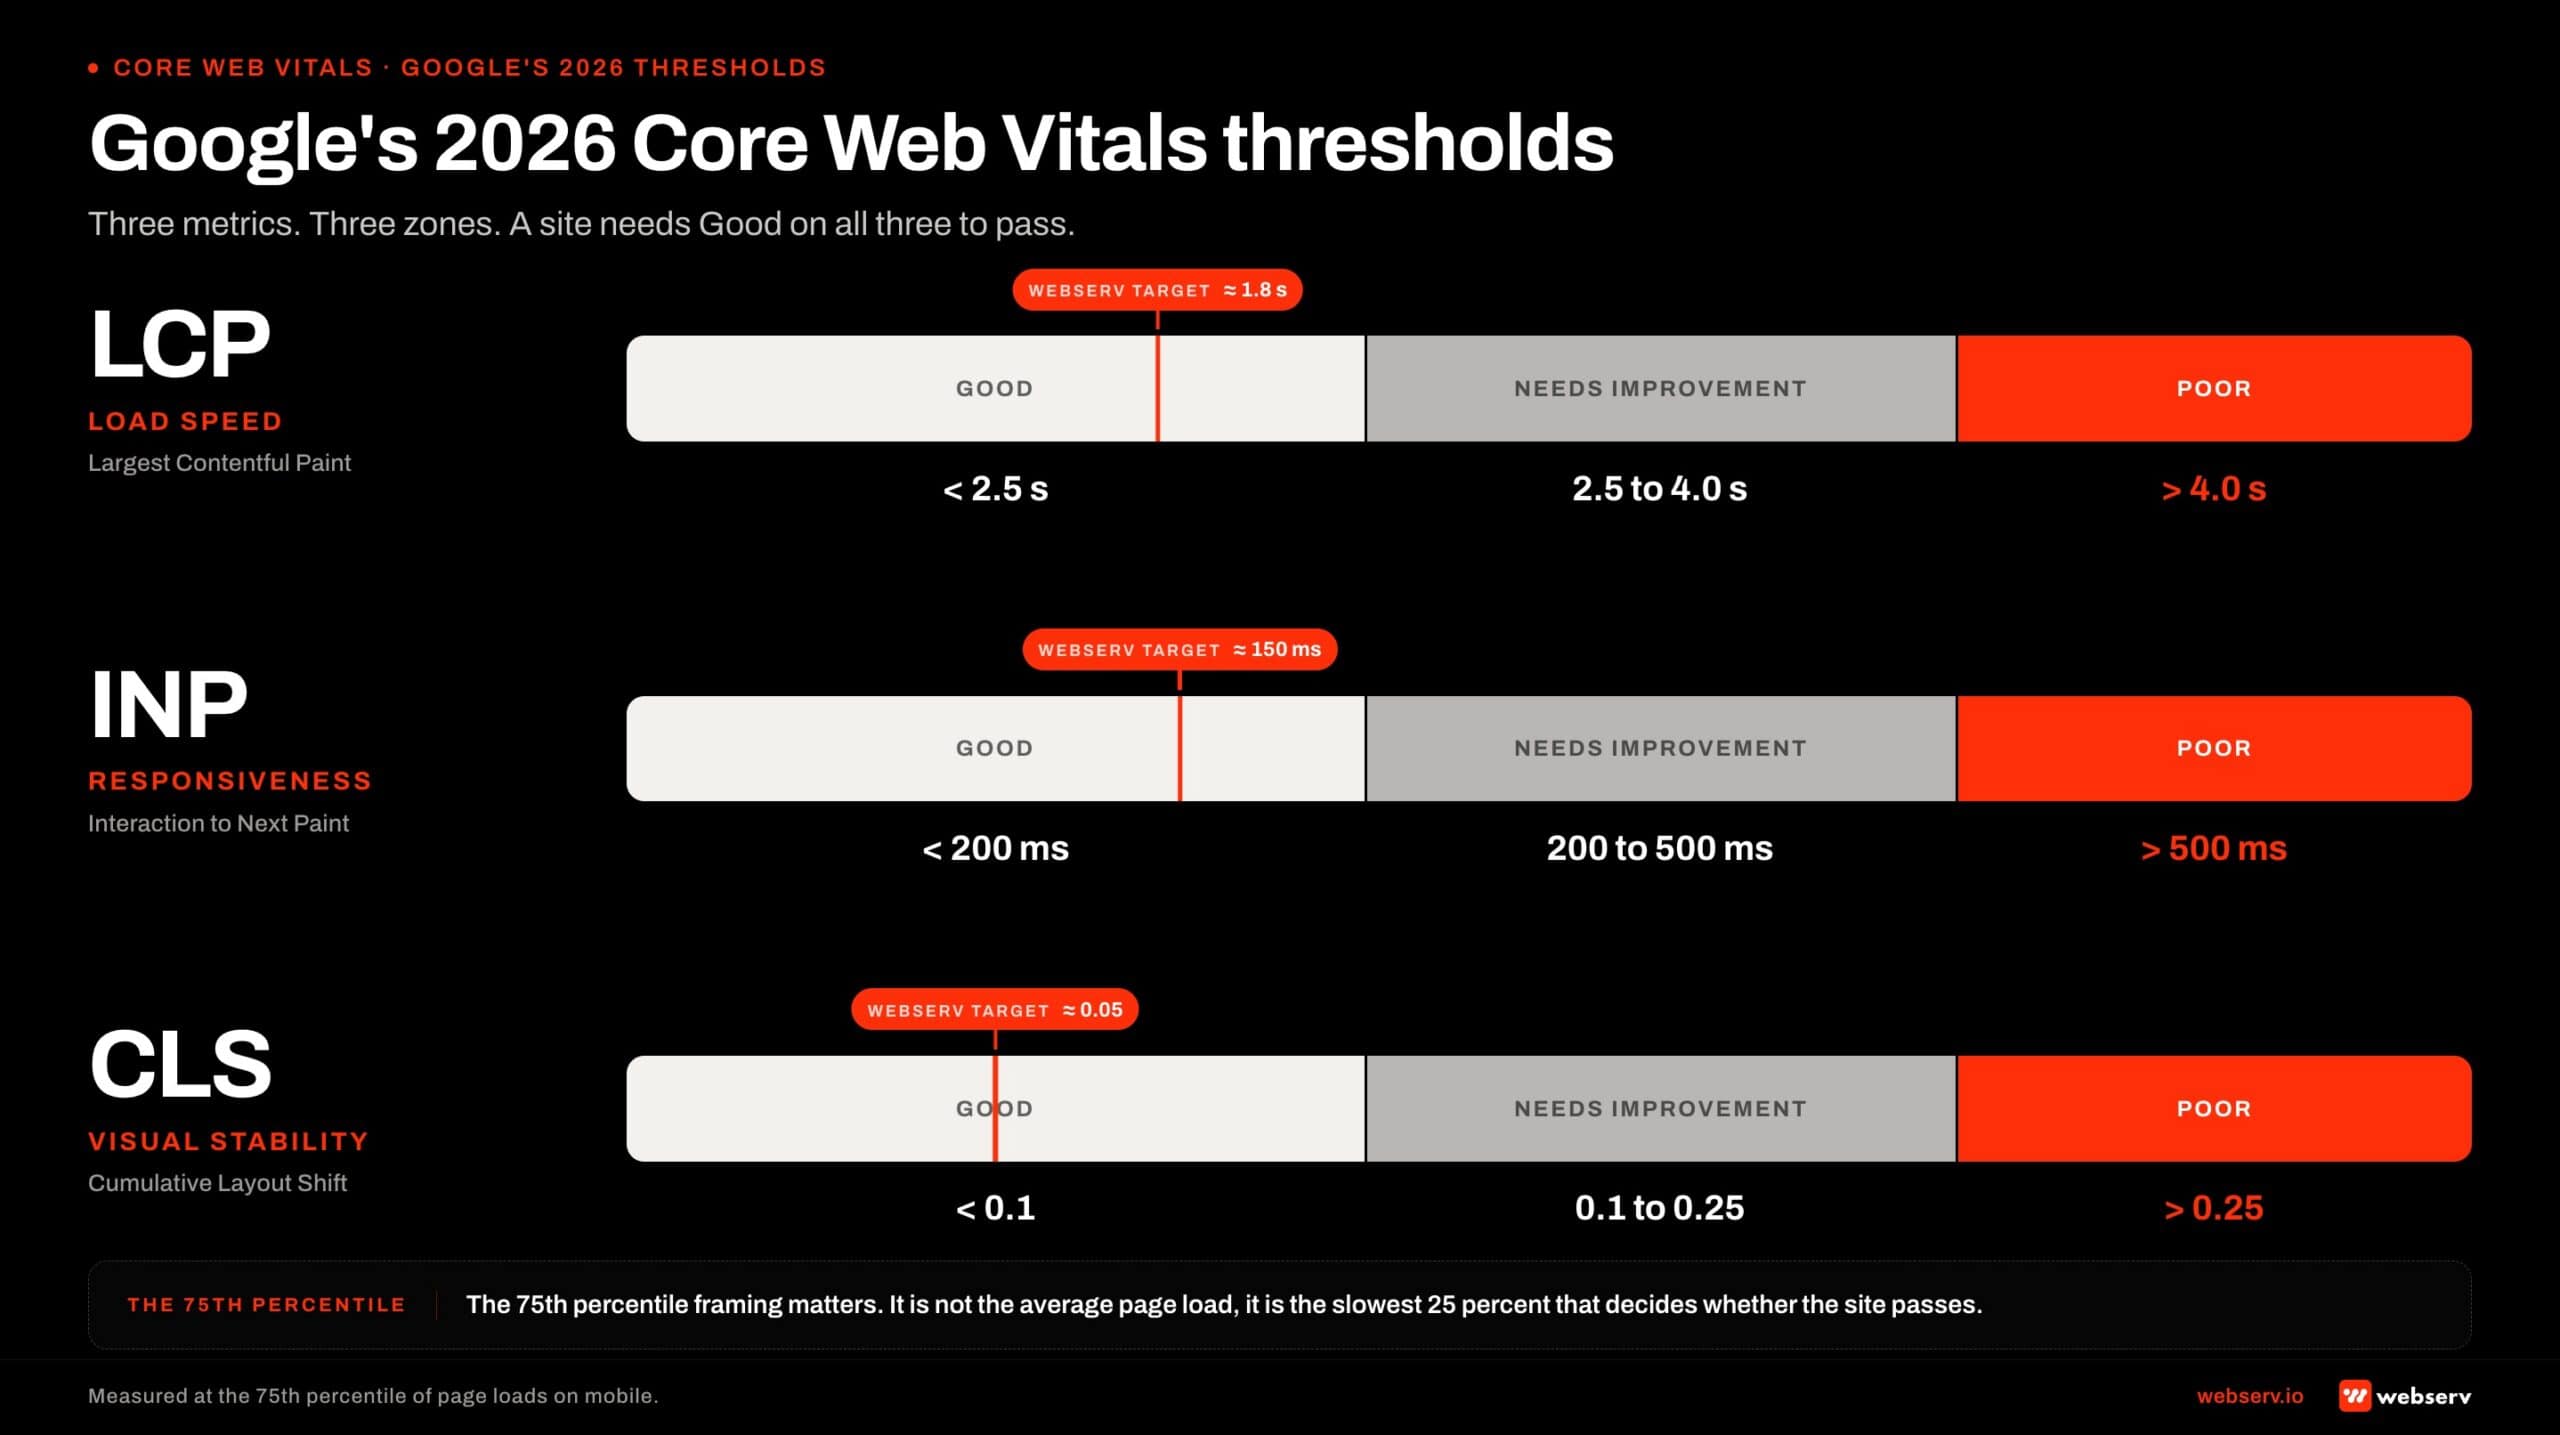
Google publishes three thresholds for each Core Web Vitals metric, evaluated at the 75th percentile of page loads. The 75th percentile framing matters: it is not the average page load but the slowest 25 percent that determine whether the site passes.
The 2026 thresholds, per the official web.dev Core Web Vitals reference.
Largest Contentful Paint (LCP). Good: under 2.5 seconds. Needs Improvement: 2.5 to 4.0 seconds. Poor: above 4.0 seconds.
Interaction to Next Paint (INP). Good: under 200 milliseconds. Needs Improvement: 200 to 500 milliseconds. Poor: above 500 milliseconds.
Cumulative Layout Shift (CLS). Good: under 0.1. Needs Improvement: 0.1 to 0.25. Poor: above 0.25.
A site needs to hit “good” on all three metrics at the 75th percentile on mobile to be classified as passing Core Web Vitals overall.
Failing any one of the three drops the page into “needs improvement” or “poor” classification, which can apply ranking drag against an otherwise-equivalent competitor with passing metrics.
Desktop performance matters less for treatment center sites because the audience is mobile-heavy, but Google evaluates both. The desktop thresholds are the same as mobile in 2026. The desktop performance typically clears the thresholds more easily because the network and device constraints are lighter.
The 75th percentile evaluation is the part most operators miss. A site can have an average LCP of 2.1 seconds and still fail the threshold if 25 percent of page loads exceed 2.5 seconds.
The slowest quartile of the user base is what determines the score, and the slowest quartile is typically the audience least tolerant of slow pages (older devices, weaker connections, the family-member-at-11-PM profile that treatment center sites need to serve well).
Healthcare vs Other Industries: Where Treatment Centers Sit
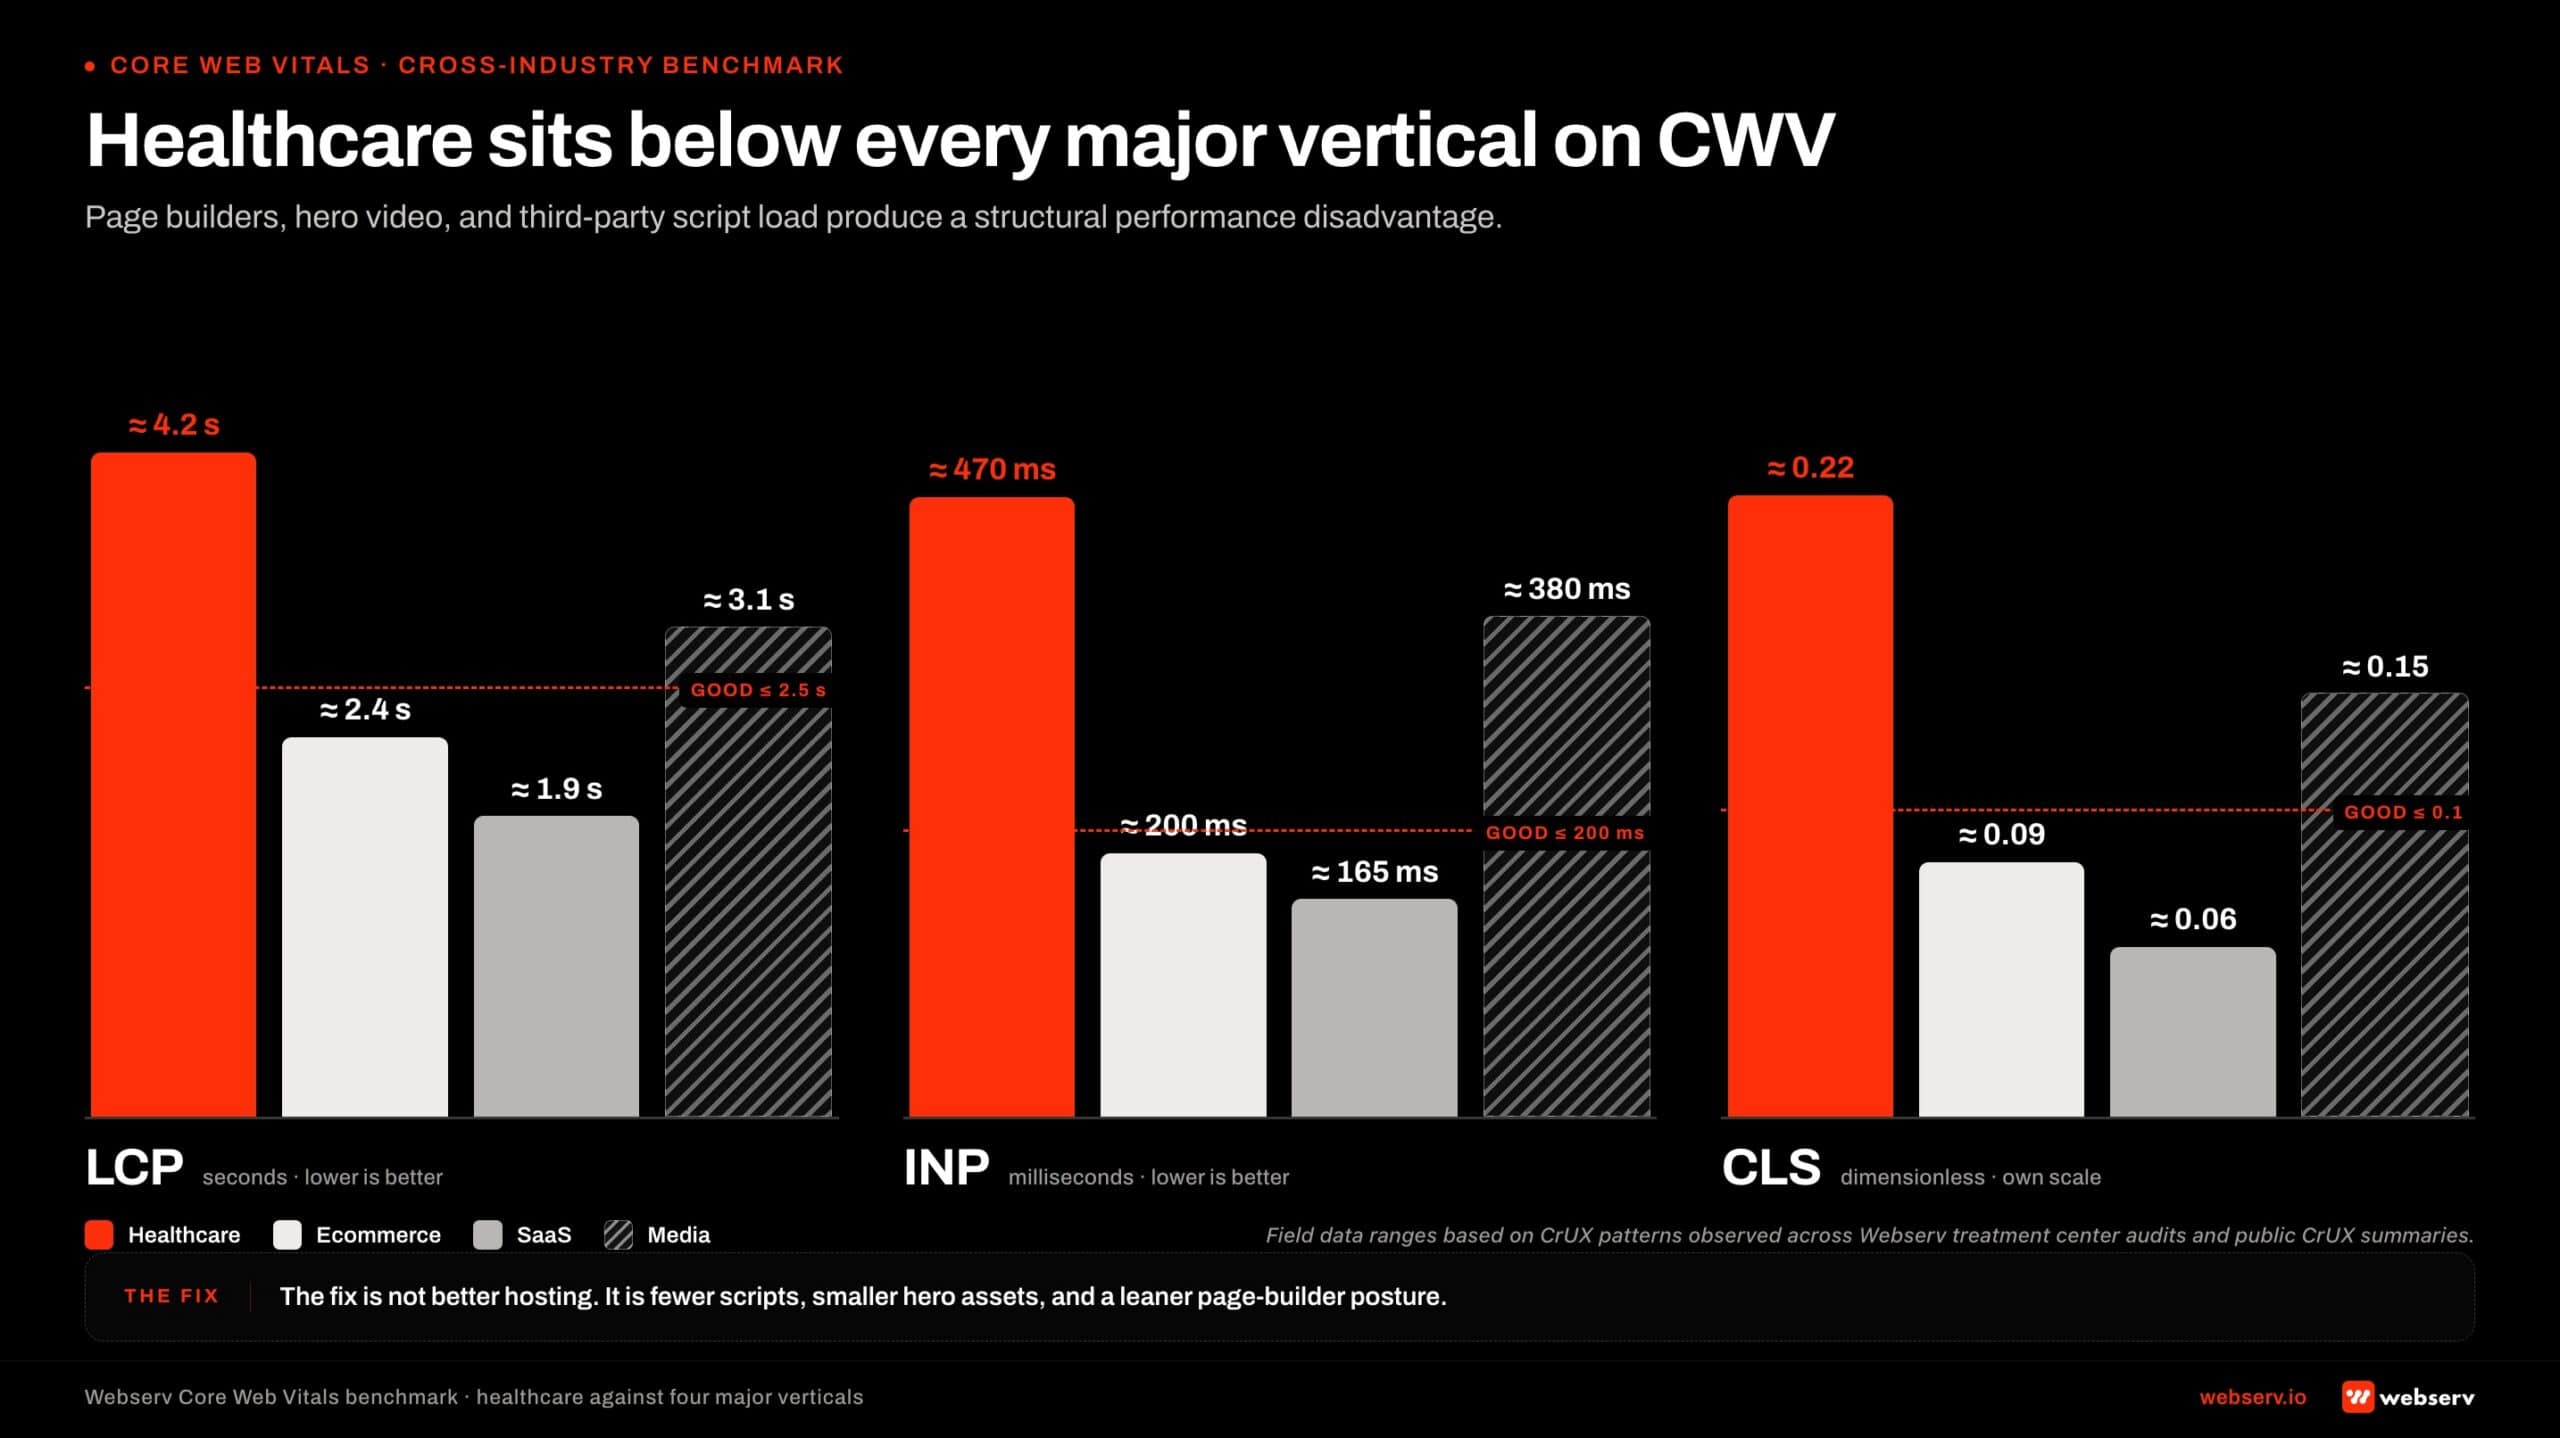
The benchmark reality for healthcare websites is that the industry consistently underperforms most other verticals on Core Web Vitals. The reasons cluster in three categories.
Heavy page builders dominant in healthcare. WordPress with Elementor, Divi, and similar visual editors produces sites that load 3 to 5 times the HTML, CSS, and JS weight of clean, hand-coded equivalents. Healthcare’s reliance on visual editors for marketing-team content management produces a structural performance disadvantage.
Hero video and rich media common in healthcare. Treatment centers in particular favor cinematic hero videos, animated background loops, and rich imagery that signals premium brand. Each of these adds 2 to 5 seconds to LCP if not heavily optimized.
Third-party scripts accumulate over time. Chat widgets, tag managers, A/B test tools, heat-mapping software, analytics scripts, and tracking pixels each add 100 to 500 milliseconds to load time. Healthcare sites accumulate more of these because the marketing teams have lower technical-debt awareness than tech-native verticals.
Healthcare site CWV pass rates run materially below the overall web average. The CrUX aggregate data we monitor shows healthcare sites passing all three CWV metrics at roughly 35 to 45 percent of measured properties, against 50 to 60 percent for the web overall.
The gap is consistent across multiple measurement windows.
Treatment center sites specifically tend to lag healthcare overall. The combination of heavy page builders, hero video, premium imagery, and limited in-house technical capacity puts most BH sites in the bottom quartile of healthcare CWV performance.
Sites built before 2022 are particularly likely to fail, because the construction patterns common in that era (Elementor v2, jQuery dependencies, unoptimized hero video) produce performance characteristics that the post-2024 CWV thresholds (with INP replacing FID) struggle against.
What the benchmark gap means for treatment center operators is that closing the CWV gap typically produces materially more ranking and conversion lift than closing it in other industries. The competitive bar is lower because most competitors are also failing. The lift compounds across both organic ranking and on-page conversion.
Page speed is a marketing infrastructure decision, not a developer problem buried two layers below the marketing org. Treat it that way and the rest of the SEO program compounds on top of it. Treat it as IT’s problem and the program leaks at the foundation.
Preston Powell, CEO of Webserv
Why the BH Audience Makes CWV More Load-Bearing
The audience profile for treatment center websites is specifically tough on page performance. Three properties of the BH audience make CWV more load-bearing than in other categories.
Mobile-heavy traffic mix. Roughly 65 to 75 percent of treatment center website traffic comes from mobile in 2026. The mobile experience is constrained by smaller viewports, slower CPUs, weaker network connections, and one-handed interaction patterns. A slow desktop site is annoying. A slow mobile site is unusable.
Time-pressured visitor state. The family member searching at 11 PM about a loved one’s overdose does not give the page 6 seconds to load. The patient in active crisis does not patiently wait for the hero video to render.
The 5-second decision frame we discussed in the landing page optimization for treatment centers piece is even more compressed when the page is loading slowly. Slow pages convert family-member traffic at materially lower rates than fast pages, even when the content is identical.
Older device and lower-bandwidth share of audience. The BH audience skews toward demographics with older devices and less reliable connectivity. Lower-income households, rural geographies, and audiences in active crisis frequently use phones with multi-year-old hardware on cellular connections with intermittent signal.
The 75th percentile that Google evaluates against happens to include exactly these visitors, which makes the slowest quartile harder to optimize for BH sites than for most other categories.
The compounding effect is that a treatment center site with 4-second LCP and 280-millisecond INP loses materially more conversion than an e-commerce site with the same metrics, because the BH audience is less forgiving of the performance gap.
LCP for Treatment Center Sites: Causes and Targets
Largest Contentful Paint is the metric most BH sites fail first. The target is under 2.5 seconds at the 75th percentile on mobile. Four common causes account for almost every BH site LCP failure we audit.
Hero video or animated background. A 14-second cinematic hero video that auto-plays is the most common single cause of LCP failure on treatment center homepages.
The video file frequently weighs 5 to 15 megabytes, blocks the LCP element from rendering, and adds 3 to 5 seconds to perceived load time. The fix is typically to remove the auto-play video, replace with a poster image and click-to-play interaction, or move the video below the fold.
Unoptimized hero images. Hero images loaded at 2x to 4x the display size, served in non-modern formats (PNG instead of WebP or AVIF), and delivered without lazy loading. The fix is image format conversion, responsive srcset attributes, and CDN delivery with proper caching headers.
Render-blocking JavaScript and CSS. Page builders (Elementor, Divi) and third-party scripts (chat widgets, A/B test tools) frequently load synchronously and block the main rendering thread. The fix is async or defer attributes on non-critical scripts, removal of unused CSS, and rationalization of the third-party stack.
Slow server response time (TTFB). Time to First Byte from the server contributes to LCP. Generic shared hosting and underpowered WordPress configurations produce TTFB of 1 to 2 seconds before the browser can even start rendering.
HIPAA-eligible WordPress hosts at appropriate tiers typically produce TTFB under 400 milliseconds. The hosting upgrade frequently solves part of the LCP gap on its own.
Google’s LCP optimization guide covers the full optimization framework. The treatment-center-specific implication is that the hero treatment (image vs video, format, lazy loading, render path) is where most of the LCP lift comes from in practice.
The realistic LCP target for treatment center sites is 1.8 to 2.2 seconds at the 75th percentile on mobile. Hitting the 2.5-second threshold is the minimum. Hitting 1.8 seconds produces materially better user experience and ranking signal.
INP for Treatment Center Sites
Interaction to Next Paint is the metric most BH sites fail second, and it is the metric most operators do not understand. INP measures how long it takes for the page to respond visually after the user taps, clicks, or types.
The target is under 200 milliseconds at the 75th percentile. The 200-millisecond threshold reflects the human perception of “instant” response. Above 200 milliseconds, users perceive lag.
Three causes account for most INP failures on treatment center sites.
Heavy JavaScript execution. When the user taps a button and the JavaScript handler takes 300 milliseconds to execute, INP fails. The cause is typically over-instrumented analytics, complex page builders, or A/B test tools that execute synchronously on every interaction.
Long-running tasks blocking the main thread. Image processing, complex animations, third-party tag firing on interaction, and similar long-running tasks block the main thread from processing the user’s tap. The user sees lag. The browser reports high INP.
Lazy-loaded content with poor optimization. Lazy-loaded images that load too aggressively, hydration patterns on JavaScript-heavy frameworks, and other modern web patterns sometimes produce poor INP even on well-built sites. The fix requires profiling and optimization rather than wholesale rebuilds.
Google’s INP optimization guide covers the diagnostic patterns. INP is harder to fix than LCP because the failure modes are more distributed across the page interactions. LCP optimization typically targets the hero, while INP optimization targets every interactive element on the page.
The realistic INP target for treatment center sites is 100 to 160 milliseconds at the 75th percentile. Hitting 200 milliseconds is the minimum threshold. Hitting 140 milliseconds gives the site headroom against the inevitable third-party script accumulation over time.
CLS for Treatment Center Sites
Cumulative Layout Shift is the easiest metric to fix and the metric most BH sites get wrong by accident rather than by structural problem. The target is under 0.1 at the 75th percentile. Three common causes produce most CLS failures.
Images without explicit dimensions. When images load without width and height attributes, the browser does not know how much space to reserve before the image arrives.
The image loads, pushes content down, and the layout shifts. The fix is explicit width and height attributes on every image, ideally backed by responsive srcset configurations.
Web fonts swapping mid-render. When custom fonts load via @font-face and the browser falls back to a system font during loading, the swap to the custom font shifts text positions and contributes to CLS.
The fix is font-display: optional or font-display: swap with carefully matched fallback metrics.
Dynamically injected content. Cookie banners, chat widgets, ads, and embedded social widgets that load after the initial render and push existing content around.
The fix is to reserve space for these elements in the layout (via fixed-height containers) or to render them in positions that do not displace primary content.
Google’s CLS optimization guide covers the diagnostic patterns. CLS is usually fixable in 5 to 15 hours of engineering work on most treatment center sites. The changes are mostly mechanical (adding dimensions, reserving space, configuring fonts).
The realistic CLS target for treatment center sites is 0.02 to 0.06 at the 75th percentile. Hitting the 0.1 threshold is the minimum. Hitting 0.04 gives the site headroom against the inevitable content updates that drift CLS upward over time.
How to Measure Core Web Vitals
Three tools form the practical measurement stack for treatment center sites.
PageSpeed Insights (PSI). Google’s free tool that combines lab data (Lighthouse) and field data (CrUX) for any URL. PSI is the right starting point for any single-page audit.
The lab score is synthetic and aspirational. The field data is what Google uses for ranking. Operators should look at both but weight the field data more heavily.
Google Search Console Core Web Vitals report. Search Console aggregates field data across the site and flags URL groups that fail any of the three metrics.
The report is the right tool for sitewide audits because it shows which page types or URL patterns are failing rather than only the specific URLs the operator thinks to test.
Chrome User Experience Report (CrUX) dataset. The CrUX BigQuery dataset is what Google itself uses as the field data source. For advanced analysis, the CrUX dataset can be queried directly to track CWV trends over time, compare against competitors, and identify URL-pattern issues that PSI and Search Console summarize.
The measurement cadence we recommend for treatment center sites is monthly Search Console reviews for the broad sitewide pattern, quarterly PSI deep-dives on the top 10 traffic landing pages, and ad-hoc PSI testing whenever the site ships material content or design changes.
The annual CWV state should be documented and tracked across years. The trend over time is more informative than any single snapshot.
What does not work as a measurement strategy is treating CWV as a one-time audit. The metrics drift over time as new content is added, new third-party scripts are installed, and image optimization regresses.
The right read is to treat CWV as a quarterly review surface that runs alongside the other SEO health checks.
The family member at 11 PM on a five-year-old phone with one bar of signal does not wait for the hero video to render. That visitor is the slowest quartile Google measures against, and they are the visitor you most need to convert.
Preston Powell, CEO of Webserv
Common BH Failure Modes
The pattern across treatment center CWV audits we run is consistent. Eight failure modes account for most of the gap we identify.
Elementor or Divi page builder bloat. WordPress page builders produce HTML, CSS, and JS payloads 3 to 5 times the size of clean equivalents. The visual editing convenience is real.
The performance tax is also real. Most BH sites we audit have Elementor or Divi as a primary cause of CWV failure.
Auto-playing hero video. Cinematic mountain landscape videos, drone footage, animated background loops. Each one delays LCP by 3 to 5 seconds and is the single most common LCP-killer on treatment center homepages.
Unoptimized images. Hero images at 2400-pixel width displayed at 800 pixels. PNG format where WebP would cut size 50 percent. No lazy loading on below-the-fold images. Generic uploads from the marketing team without compression pass.
Bloated third-party stack. Chat widget, tag manager, three different analytics scripts, A/B test tool, heat-mapping software, two tracking pixels, social embed scripts, all loading on every page. Each adds 100 to 500 milliseconds.
Render-blocking fonts. Custom Google Fonts loading synchronously without font-display: swap. Font Awesome icons loading the full 200KB library when only 12 icons are used.
Generic shared hosting. Bluehost, GoDaddy basic, HostGator producing TTFB of 1 to 2 seconds before rendering can start. HIPAA-eligible managed WordPress hosts at appropriate tiers produce TTFB under 400 milliseconds.
Missing image dimensions. Images without width and height attributes causing layout shifts every time a page loads. Mostly mechanical to fix and frequently neglected.
Auto-injected cookie banners. GDPR and CCPA cookie banners that load after the initial render and shift content. Common on EU-facing or California-compliance-aware sites.
Most facilities have 4 to 6 of these failure modes on their current site. Closing them in sequence over 60 to 90 days produces compounding CWV lift.
The 60-Day Optimization Sequence
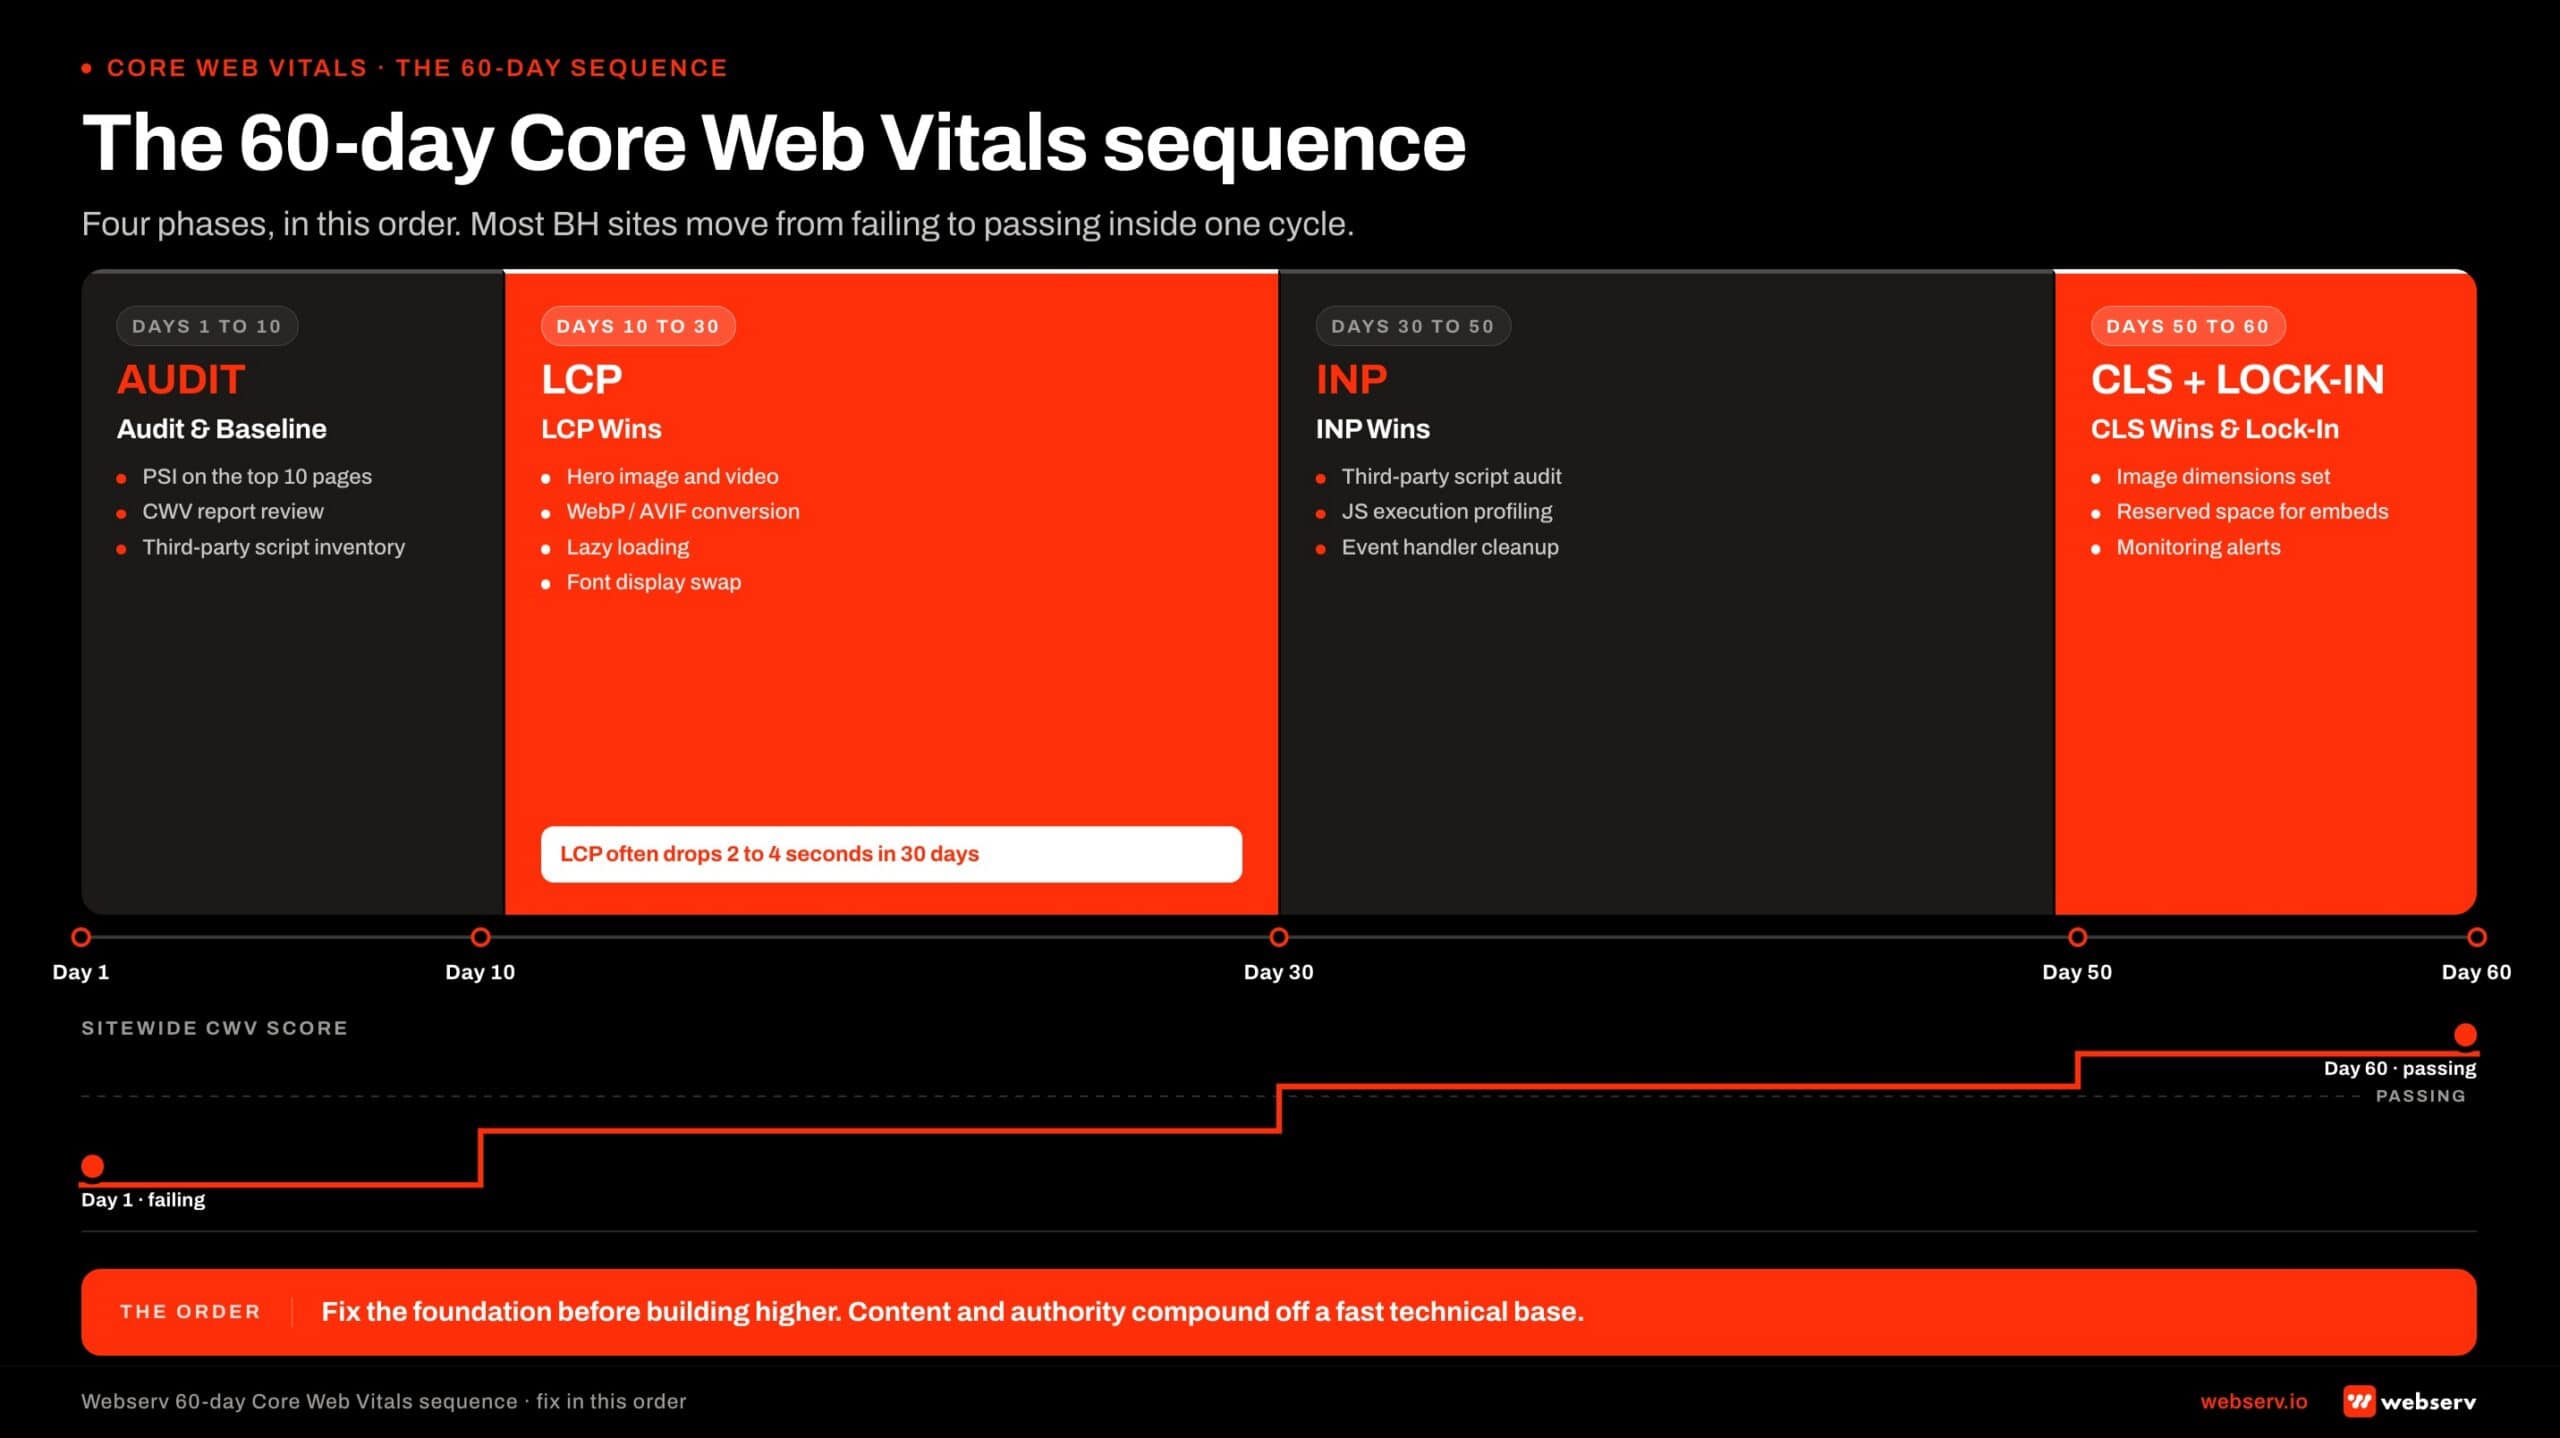
The sequence we run on treatment center CWV optimization projects has four phases.
Days 1-10: Audit and baseline. PSI on top 10 traffic landing pages, Search Console CWV report review, full third-party script inventory, and image optimization audit. The output is a prioritized fix list with effort estimates.
Days 10-30: LCP wins. Hero image and hero video optimization, image format conversion to WebP or AVIF, lazy loading deployment on below-the-fold images, font display configuration. This phase typically produces the largest single CWV improvement, with LCP often moving 2 to 4 seconds in 30 days.
Days 30-50: INP wins. Third-party script audit and rationalization, JavaScript execution profiling, deferred loading of non-critical scripts. INP work is harder than LCP work and produces smaller per-week gains, but the cumulative effect across 20 days is meaningful.
Days 50-60: CLS wins and measurement infrastructure. Image dimension audits, font configuration tuning, layout reserving for dynamic content. Plus the measurement infrastructure that supports ongoing CWV health (monthly Search Console reviews, quarterly PSI deep-dives, alerting on regression).
The full 60-day sequence typically moves treatment center sites from failing all three CWV metrics to passing at the 75th percentile on mobile.
The organic ranking and conversion lift compounds across the following 90 days as Google reflects the page experience changes in its ranking and the audience experiences the improved performance.
The deeper SEO context lives inside our SEO capability for treatment centers work. CWV is one of the technical foundations that the rest of the SEO program depends on, alongside E-E-A-T infrastructure, topical authority, and the AI search surface. New builds should pass CWV before launch as part of the foundational pages and architecture a new center builds first.
How CWV Compounds With E-E-A-T, Schema, and AI Search
Core Web Vitals do not produce ranking lift in isolation. The compound effect with the rest of the SEO and AI search stack is what produces durable performance gains.
CWV plus E-E-A-T. A fast page with named clinical authorship, reviewer credit, and peer-reviewed citations outperforms a fast page without those signals. The CWV improvement creates the technical foundation.
The E-E-A-T layer produces the YMYL ranking signal. The deeper read on the E-E-A-T side lives in how to build clinical content Google trusts.
CWV plus schema. Strong schema (Organization with stable @id, MedicalOrganization, FAQPage, BreadcrumbList) gives Google’s entity graph the structured data it needs to rank the page.
CWV makes the page fast enough that Google can crawl and render it efficiently. The schema makes the rendered content legible to the ranking system. The deeper read lives in entity SEO for treatment centers in AI search.
CWV plus AI search infrastructure. AI Overviews, ChatGPT, and Perplexity citations weight page-experience signals as a proxy for site quality. A page that loads fast, has clear structured content, and serves the assistant-tier extraction patterns gets cited at higher rates.
The Open Knowledge Format bundle and the AI Overviews citation playbook both depend on the underlying page experience being strong.
CWV plus topical authority. A treatment center cluster with strong CWV across the condition pillar, modality cluster, level-of-care, and geographic pages compounds across the cluster. Each page reinforces the others’ ranking signal.
CWV consistency across the cluster produces site-wide ranking lift. The topical authority framework for treatment centers covers the cluster-level reading.
The implication for operators is that CWV is the foundation under the rest of the program, not a standalone optimization. A site with great CWV and weak E-E-A-T underperforms a site with average CWV and strong E-E-A-T, and vice versa.
The compounding effect across the full stack is what produces the durable ranking and conversion lift. The full sequence sits inside the ultimate guide to behavioral health marketing.
Frequently Asked Questions
What’s a realistic Core Web Vitals target for a treatment center site in 2026?
Google’s “good” thresholds are LCP under 2.5 seconds, INP under 200 milliseconds, and CLS under 0.1 on mobile at the 75th percentile. The realistic operator target sits tighter: LCP under 2.0 seconds, INP under 160 milliseconds, and CLS under 0.05. That tighter target gives headroom against drift.
The 2.5-second LCP threshold is the floor for passing CWV at all, but most treatment center competitors who pass at 2.4 seconds today regress to 2.7 seconds within 12 months as new content and scripts accumulate. The tighter target absorbs that drift without dropping the site back into the failing band.
For new builds or major refreshes, we target 1.8-second LCP and 140-millisecond INP at launch. That ceiling typically holds for 18 to 24 months before the next round of maintenance work is needed.
How long does it take to fix Core Web Vitals on a treatment center site?
Most treatment center sites move from failing all three CWV metrics to passing at the 75th percentile in 60 to 90 days of focused engineering work. The bulk of the LCP and CLS lift lands in the first 30 days. INP is harder and typically takes the back half of the window.
The sequence we run starts with a 10-day audit and baseline. Days 10 through 30 target LCP wins (hero optimization, image formats, lazy loading). Days 30 through 50 target INP (third-party script audit, JavaScript execution profiling). Days 50 through 60 tighten CLS and stand up the measurement infrastructure for ongoing monitoring.
The compounding ranking and conversion lift typically shows up across the 90 days after the work is complete, as Google reflects the page experience changes in its ranking signal and the audience starts to experience the improved performance directly.
Will fixing Core Web Vitals improve our search rankings?
Yes, but the lift compounds with E-E-A-T, schema, and content quality rather than working alone. Google’s page experience documentation is explicit that great content is the primary ranking signal and CWV tunes ranking at the margin. The CWV lift is the multiplier on the rest of the program.
The typical pattern we see on treatment center sites is 15 to 30 percent organic traffic lift over the 90 days following the CWV improvement, plus meaningful conversion lift on the same pages because the audience experience improves alongside the ranking signal. The conversion lift frequently exceeds the ranking lift.
The fastest gains come on pages that already rank in positions 4 through 10 and have strong content but failing CWV. Those pages typically move 2 to 4 positions on the improvement, which is where most of the traffic lift originates.
How do we measure Core Web Vitals across our whole site, not just one page?
Google Search Console’s Core Web Vitals report aggregates field data across every URL Google has measured on the site and groups failing URLs into clusters. That is the right starting point for any sitewide audit. PageSpeed Insights is for deep-dives on specific pages, not sitewide measurement.
The Search Console report shows which URL patterns are failing (typically location pages, blog archive pages, or programmatic pages with shared templates) and lets the team target template fixes rather than per-page work. Template-level fixes scale across the site; per-page fixes do not.
For more advanced analysis, the Chrome User Experience Report (CrUX) BigQuery dataset is queryable directly and gives you the same field data Google uses for ranking. We use CrUX for competitive benchmarking and trend analysis across measurement windows.
Does our hosting affect Core Web Vitals?
Yes, materially. Time to First Byte (TTFB) from the server contributes directly to LCP. Generic shared hosting produces TTFB of 1 to 2 seconds; HIPAA-eligible managed WordPress hosts at appropriate tiers produce TTFB under 400 milliseconds. The hosting upgrade alone frequently solves 30 to 50 percent of an LCP gap.
Beyond TTFB, managed hosts apply caching, CDN delivery, image optimization, and HTTP/2 or HTTP/3 by default. The cumulative effect across all of these is materially more performance than tuning at the application layer on shared hosting can produce.
For treatment center sites specifically, the hosting decision interacts with HIPAA posture. The same managed hosts that produce strong CWV characteristics also tend to sign BAAs and run hardened infrastructure, so the upgrade frequently satisfies multiple needs simultaneously.
What’s the relationship between Core Web Vitals and AI search citations?
AI Overviews, ChatGPT, and Perplexity weight page-experience signals as a proxy for site quality when deciding which sources to cite. Pages with strong CWV get cited at higher rates than pages with weak CWV, controlling for content quality. The relationship is correlated rather than causal, but the pattern is consistent in our citation share monitoring.
The mechanism is that AI systems use signals from Google’s broader ranking infrastructure as part of source selection. Pages that Google ranks well on technical quality (which includes CWV) are surfaced to the AI systems’ retrieval layer at higher rates. The CWV improvement compounds across organic and AI search visibility.
The Open Knowledge Format bundle and the AI Overviews citation playbook both depend on the underlying page being fast enough to render cleanly when an AI system fetches it. Slow pages get partial extractions; fast pages get cited in full.
Fix the Foundation Before Building Higher
Core Web Vitals are the page-performance layer that sits under the rest of the SEO program. The treatment centers that pass at the 75th percentile compete from a stronger position.
The treatment centers that fail competing on content alone leak ranking and conversion at the foundation. The 60-day fix is a known sequence with a known cost and a known payoff. How long SEO takes to work shortens materially when the technical foundation is in place.
If your facility is unsure where the site sits on Core Web Vitals or wants help running the 60-day optimization sequence, book an intro meeting with the Webserv team.
We will audit your current CWV state, identify the failure modes specific to your build, and lay out the sequence that closes the gap.
Trevor Gage is the Director of Marketing at Webserv. Webserv works with behavioral health and addiction treatment centers on SEO, paid media, and full-funnel admissions strategy.