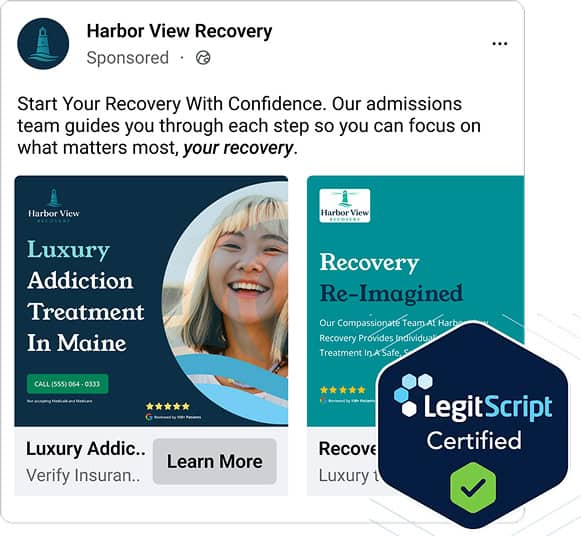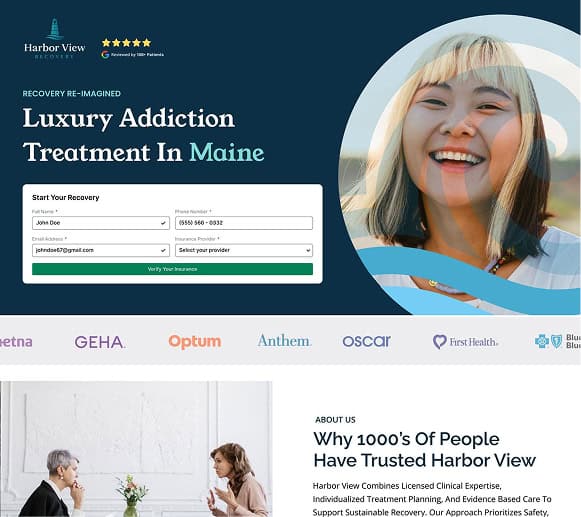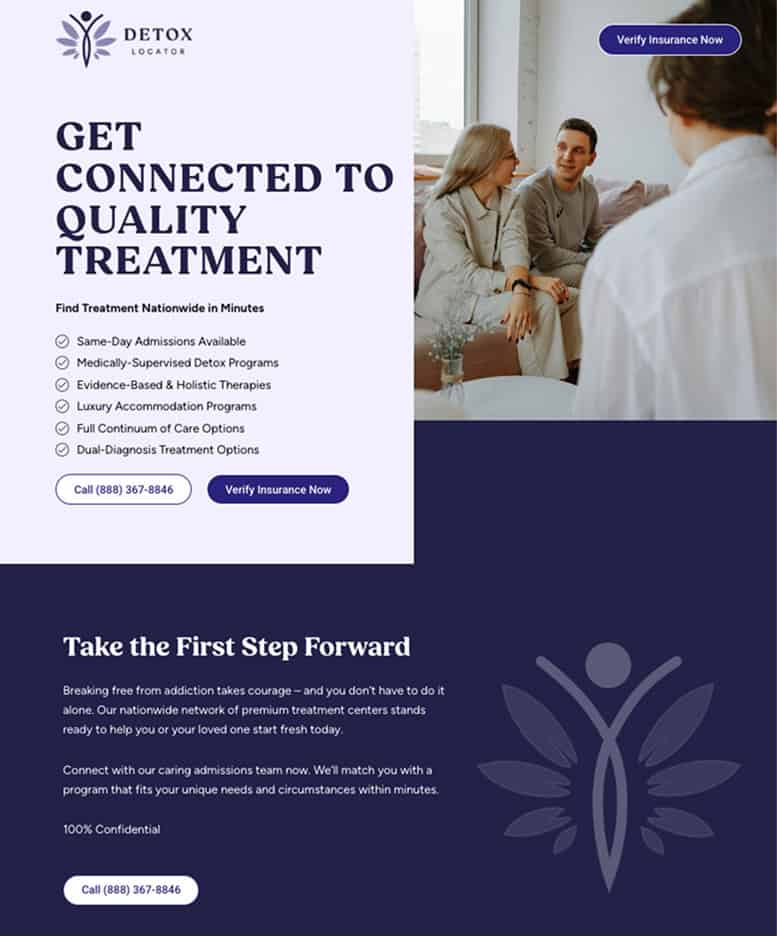





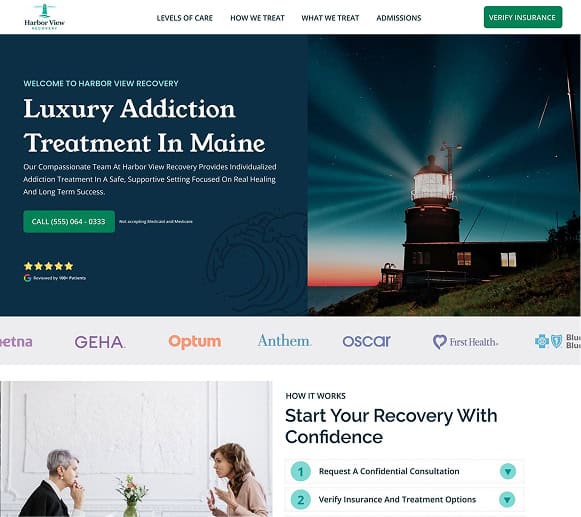
Most rehab centers lose 50-80% of potential admits to friction, confusion, or dead ends in their process. Every lost conversion represents someone who didn’t get help, and revenue your center didn’t capture.
Trusted by 200+ Treatment centers nationwide


THE CHALLENGE
Your ads are driving clicks. Your SEO is generating traffic. But somewhere between the first click and the admission, most of these opportunities disappear.
Paid campaigns not converting
Your paid campaigns are driving clicks, but visitors aren't converting. You're spending thousands on traffic that leaks out of your funnel before ever reaching admissions.
Poor mobile experience causing abandonment
Complex forms, slow-loading pages, and poor mobile experiences cause visitors to abandon before completing contact. Over 60% of visitors arrive on mobile—if your experience isn't optimized, you're losing the majority of potential admits.
Hidden contact options losing leads
Hidden phone numbers, buried CTAs, and confusing navigation force visitors to hunt for how to reach you. When someone needs help now, they won't wait—they'll call your competitor instead.
Disconnect creating doubt
Ad copy promises one thing, but landing pages deliver another. Generic pages serve specific searches. This disconnect creates doubt at the exact moment you need to build trust.
Flying blind without data
Without proper tracking, heatmaps, and user session analysis, you're flying blind. You don't know where visitors drop off, what's working, or how to improve.
THE COMPOUND EFFECT
“Most treatment centers focus on driving more traffic—spending more on ads, pushing harder on SEO. But what if the biggest opportunity isn’t getting more visitors, but converting more of the ones you already have?
Small improvements in conversion rate create exponential growth in admissions and revenue. The math is simple: same traffic, same budget, better conversion. Here’s what that looks like in real numbers:
| Metric | Center A | Center B | Center C |
|---|---|---|---|
| Site Visitors | 10,000 | 10,000 | 10,000 |
| Conversion Rate | 1% | 2% | 3% |
| Leads Generated | 100 | 200 | 300 |
| New Admits | 10 | 20 | 30 |
| Avg Admit Value | $20K | $20K | $20K |
| Revenue Impact | $200,000 | $400,000 | $600,000 |
Same traffic. Same budget. Just better conversion. That's a $400,000 difference between Center A and Center C.
See how conversion rate optimization translates to real revenue growth for your center.
Current Monthly Revenue
$200,000
With 2% CR Improvement
$600,000
(+$400,000)
With 3% CR Improvement
$800,000
(+$600,000)
Annual Impact (2% CR)
$4,800,000 additional revenue
These projections are based on actual client results. Your specific results will vary based on traffic quality, services offered, and market conditions.
SYSTEMATIC OPTIMIZATION
CRO isn’t just about landing pages. It’s a performance layer that makes every part of your marketing work harder. From ad creative to website UX to organic content, we systematically remove friction and optimize for conversion across all touchpoints.
Reduce friction and streamline the user journey across all site touchpoints.
Discover the best performing ads to drive high-intent visitors to your pages.
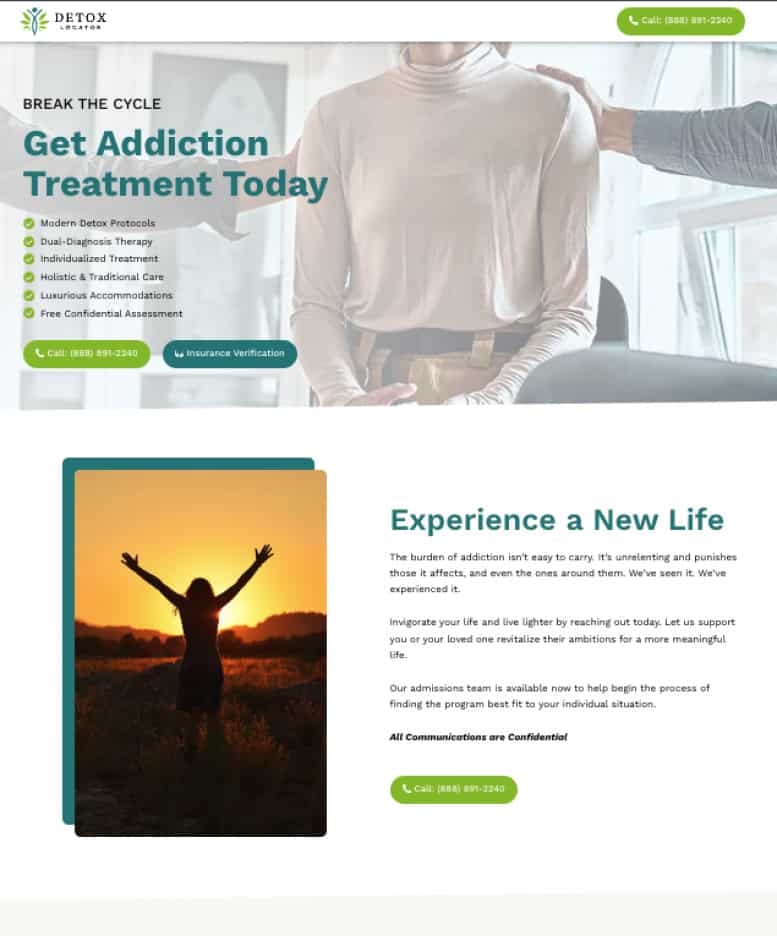
Turn post-click visits into leads through optimized layouts and forms.
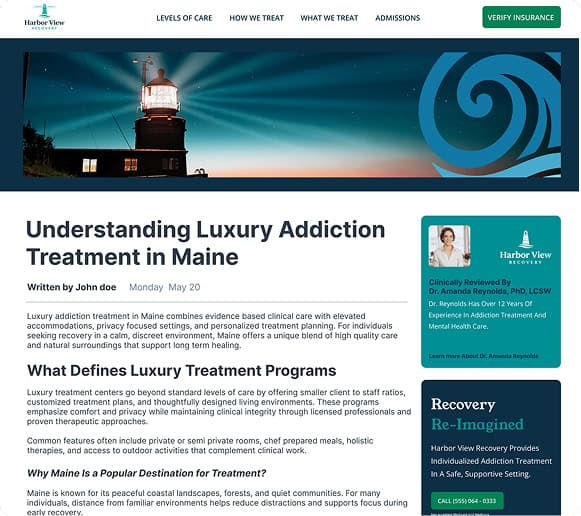
Make high organic traffic pages convert more visitors into leads.
CASE STUDY
Conversion Rate
Call & Form Submits
Cost per Qualified VOB
THE PROCESS
Our four-step process removes friction at every touchpoint. We analyze where visitors drop off, test solutions, implement improvements, and continuously optimize.
STEP 1
STEP 2
STEP 3
STEP 4
Paid Admissions
Director of Paid Admissions
Mitch has 6+ years at Webserv, navigating the difficulty and restrictions that come with Behavioral Health digital marketing across various...
Paid Admissions
Associate Director, Paid Admissions
Performance marketing professional with 6+ years of experience driving growth through data-informed paid media across most paid media channels. Manages...
Paid Admissions
Associate Director, Paid Admissions
Coming Soon.
COMMON QUESTIONS
Conversion rate optimization (CRO) for treatment centers is the practice of systematically improving the percentage of website visitors who become qualified admissions inquiries. CRO uses heatmaps, session recordings, A/B testing, form analytics, and user research to find friction points in your funnel, then fixes them so the same traffic produces more admits.
For most rehabs, CRO is one of the highest-return marketing investments available. Operators routinely spend tens of thousands of dollars to drive traffic to a site that loses 80 percent of that traffic to friction. CRO recovers that lost spend.
At Webserv, CRO is not a one-time project. It is a continuous performance layer running across your website, landing pages, and ad creative. We test, measure, and refine the highest-impact pages on an ongoing basis.
A well-optimized treatment center website typically converts visitors at 3 to 6 percent into form submissions or calls, with the highest-intent landing pages converting at 8 to 12 percent. Most unoptimized rehab websites convert below 1.5 percent. The difference is rarely about traffic quality. It is about friction, page speed, mobile UX, and how clearly the page maps to what families actually need.
The benchmark also depends on what you count as a conversion. Form submissions, phone calls, insurance verification requests, and live chat starts all carry different weights for an admissions team. We define conversions against admits, not vanity events.
Operators chasing a single benchmark number usually miss the bigger lift. The right question is what your highest-intent pages convert at and whether you have a structured plan to test your way upward from there.
Most treatment centers see measurable lift from CRO within 60 to 90 days, with compounding gains over the following 6 to 12 months. The first 30 days are about analytics setup, baseline measurement, and identifying the highest-impact friction points. Months 2 and 3 produce the first round of tested improvements. From there, the program compounds as each round of tests informs the next.
The timeline depends heavily on traffic volume. Pages with 5,000 plus monthly visitors can validate A/B tests in days. Pages with 500 visitors per month take longer. We sequence the program to start with your highest-traffic pages so the early wins are real and statistically defensible.
CRO does not have a finish line. Visitor behavior changes, ad creative changes, and Google's expectations change. Centers that stop testing after a single round of fixes lose the compounding effect that makes CRO worth doing in the first place.
Most treatment centers do not need a redesign. They need CRO. A redesign solves brand or aging-platform problems. CRO solves the conversion problem. We audit what you have first. If your existing site can be optimized into a high-converting asset, that is almost always faster and cheaper than rebuilding. If a rebuild is the right call, we tell you why and what it would take.
The reflex to redesign is one of the most expensive mistakes treatment centers make. Redesigns take six to twelve months, often launch with worse conversion than the previous site, and frequently lose organic rankings in the migration. CRO produces measurable lift in weeks against the site you already have.
We have seen treatment centers triple their conversion rate without changing a single design element, simply by fixing form UX, mobile speed, and CTA clarity. The redesign question is real, but it should be answered after the optimization data, not before it.
SEO and paid ads drive traffic to your site. CRO turns that traffic into admissions. The three work as a stack. SEO and paid ads can double your visitor volume, but if your site converts at 1 percent, half of those visitors leak out before reaching your admissions team. CRO is the layer that captures the lift.
The math also compounds. A 2 percent improvement in conversion rate against the same SEO and paid ads budget can double your cost-per-admit efficiency. That is why operators who treat CRO as optional usually overspend on acquisition.
For most facilities, the right sequence is to fix major conversion gaps first, then scale traffic. Driving more visitors to a site that does not convert is the most expensive way to grow admissions.
Most treatment centers we work with see conversion rates improve 50 to 200 percent within the first 6 months of CRO, with the largest gains coming from form UX, mobile page speed, click-to-call clarity, and message-to-page alignment. The exact lift depends on your starting point. Sites with severe friction often see the largest gains. Sites that are already well optimized see smaller, but still compounding, improvements.
Translation to revenue is straightforward. If your site converts 10,000 monthly visitors at 1 percent today, getting to 3 percent adds 200 monthly leads. At a typical admit value, that is hundreds of thousands of dollars in additional monthly revenue against the same marketing spend.
We do not promise specific percentages until we have your analytics data and benchmarks. What we will commit to is a structured testing program, transparent reporting, and a focus on the conversion metrics that actually move admissions.
MARKETING SERVICES FOR REHABS
Build sustainable, long-term patient acquisition through search visibility and content authority.
Drive immediate results with targeted advertising and optimized conversion experiences.
Streamline your admissions process with data-driven operations and conversion tracking.
Websites, landing pages, and ad creative built as part of the patient acquisition system.
Ready to Grow?
30-minute strategy session to discuss your census goals, current challenges, and how we can help you scale admissions sustainably.
Trusted by 200+ Treatment centers nationwide