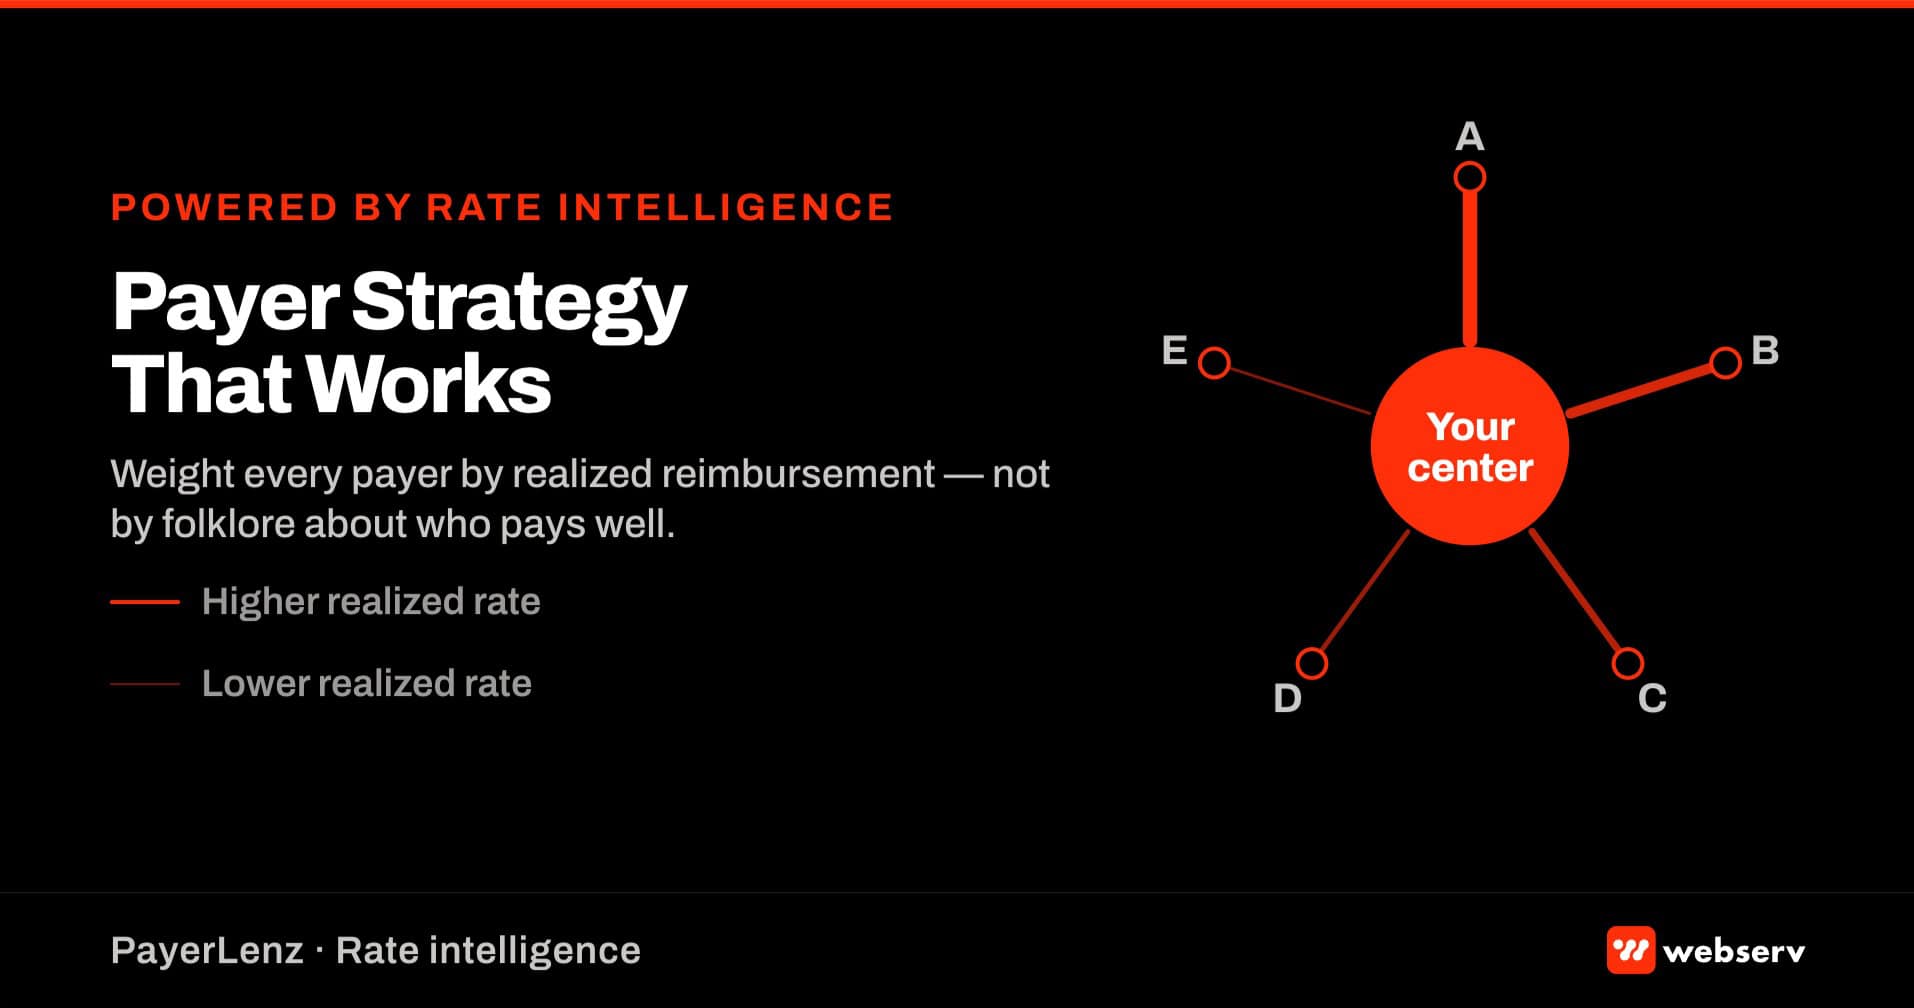
Every treatment center operator I have spoken with in the last two years has some version of a payer strategy. Some are formal quarterly reviews with the CFO, the admissions director, and ownership around a conference table. Others are stored in the operator’s head as folklore. “Aetna pays great, Cigna is terrible, BCBS depends.”
The formal versions are usually still built on folklore. That is the problem this piece is about.
Payer strategy is the operating discipline that decides which OON programs to run, which in-network contracts to renegotiate, which referral partners to weight higher, and which levels of care to invest in versus contract. Done well, it is the single highest-ROI operational lever available to a treatment center after the admissions ops layer itself. Done on folklore, it destroys margin at a scale most operators do not realize until the collections report tells them.
The category we built PayerLenz inside of exists because payer strategy without rate intelligence is guesswork. Coverage confirmation from a VOB tool tells you whether you can admit a patient. Our rate intelligence and reimbursement platform tells you whether the specific plan the patient carries will pay enough for that admission to make sense strategically.
This piece walks the three payer strategy mistakes we see repeatedly across operator conversations, the five strategic decisions rate intelligence changes, and the quarterly cadence that turns rate data into an operating discipline rather than a dashboard.
Key Takeaways
- Payer strategy is the discipline of deciding which OON programs to run, which in-network contracts to renegotiate, which referral partners to weight higher, and which levels of care to invest in versus contract. Rate intelligence is what makes those decisions defensible rather than folklore.
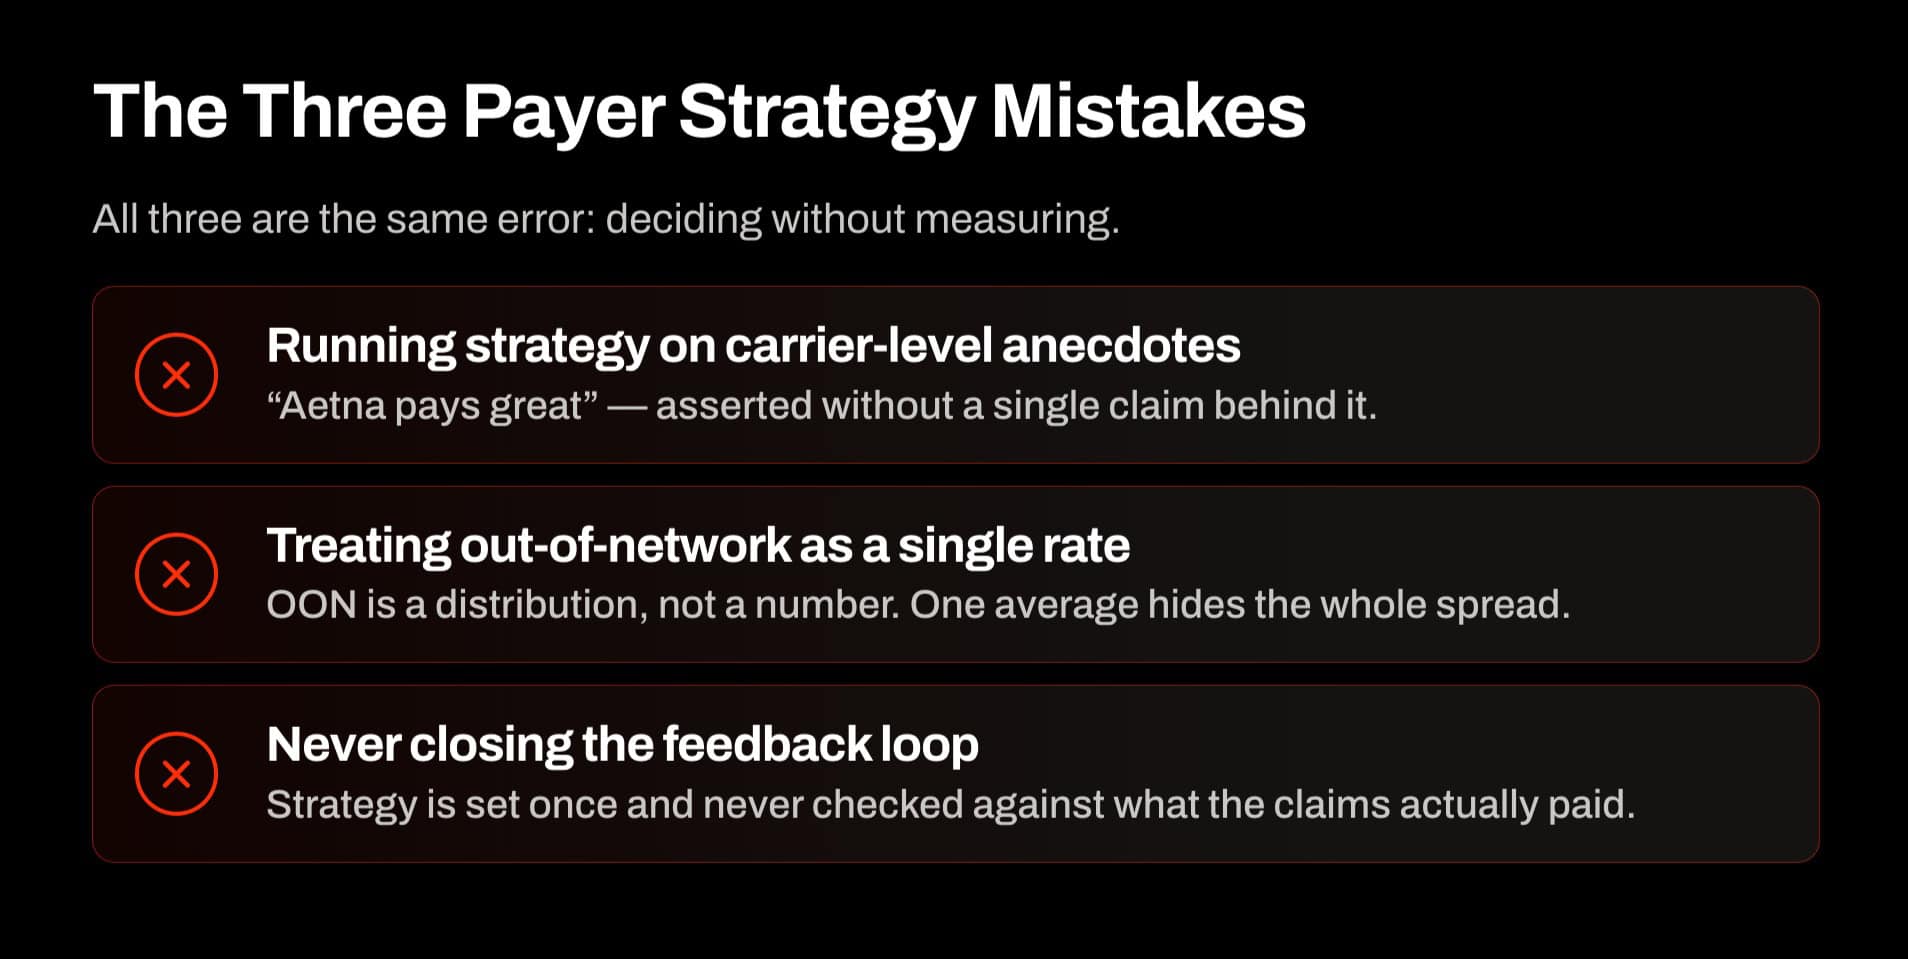
- The three payer strategy mistakes we see repeatedly: running strategy on carrier-level anecdotes, treating out-of-network as a single rate rather than a distribution, and never closing the feedback loop between what the VOB predicted and what the payer actually paid.
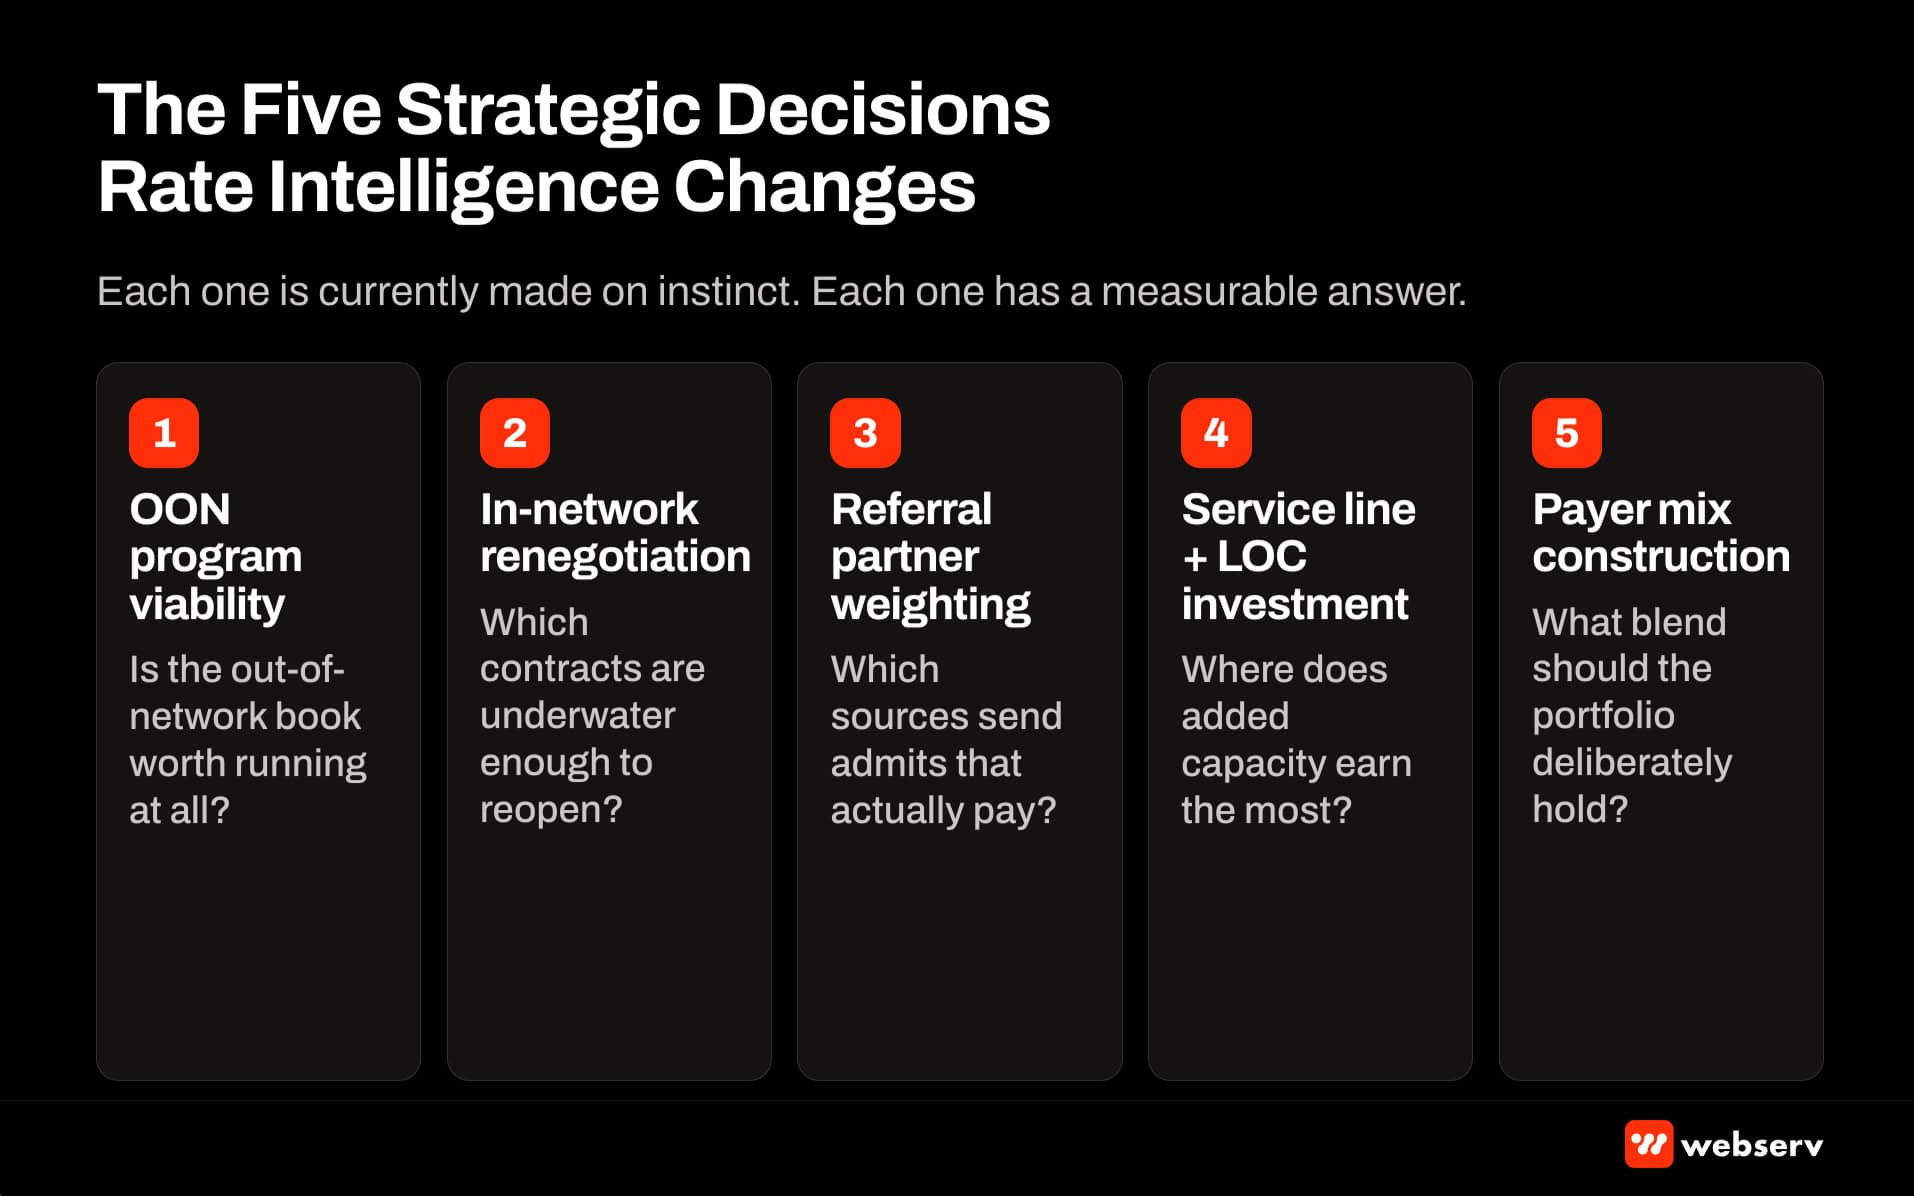
- Rate intelligence changes five specific strategic decisions: OON program viability, in-network contract renegotiation, referral partner weighting, service line and level-of-care investment, and payer mix portfolio construction at the plan level rather than the carrier level.
- The right cadence for payer strategy work is quarterly, run by the CFO or controller with the admissions director present, and anchored on QBR reporting that includes rate-adjusted admissions volume alongside raw admissions volume.
- Common resistance to switching from folklore to data typically comes from operators who have been running programs on carrier-level assumptions for years. The transition works when the first strategic decision using rate intelligence produces a measurable outcome at the next quarterly review.
DEFINITION
Payer strategy. The set of decisions treatment center operators make about revenue-generating relationships with insurance payers: contract terms, network status, service line offerings, referral partner priorities, and investment allocation across levels of care and payer mix categories.
Distinct from admissions operations (which decides how to run intake, verify coverage, and schedule admits) and distinct from revenue cycle management (which decides how to bill and manage collections after the admit). Payer strategy sits above both and shapes which admits the downstream disciplines actually get to work on.
What Payer Strategy Actually Is
Payer strategy is a set of decisions treatment center operators make about their revenue-generating relationships with insurance payers. The decisions include contract terms, network status, service line offerings, referral partner priorities, and investment allocation across levels of care and payer mix categories.
The category is distinct from admissions operations. Admissions ops decides how to run intake, verify coverage, and schedule admits at the workflow level. Payer strategy decides which admits the operation should be pursuing and at what expected rate. Our piece on the ten percent rule covers the rate data that decision needs.
The category is also distinct from revenue cycle management. RCM decides how to bill, follow up on paid claims, and manage collections after the admit. Payer strategy decides which admits should have been pursued in the first place and how to reshape the mix over time.
The right way to think about payer strategy is as the layer that sits above both admissions ops and RCM and shapes what those two disciplines actually get to work on. When payer strategy is done well, admissions ops and RCM produce compounding results. When payer strategy is done on folklore, both downstream disciplines run efficiently against the wrong targets.
OPERATOR INSIGHT
Coverage confirmation from a VOB tool tells you whether you can admit a patient. Rate intelligence tells you whether the specific plan the patient carries will pay enough for that admission to make sense strategically.
Payer strategy without rate intelligence is guesswork. Done well, it is the single highest-ROI operational lever available to a treatment center after the admissions ops layer itself. Done on folklore, it destroys margin at a scale most operators do not realize until the collections report tells them.
The Three Payer Strategy Mistakes We See Repeatedly
Kyle McHenry, our co-founder and the founder of Revenue Logic, has spent more than a decade looking at behavioral health claims and payer behavior data. Three payer strategy mistakes surface in almost every operator conversation.
Mistake 1: running strategy on carrier-level anecdotes
The most common mistake is running payer strategy at the carrier level. “Aetna pays great, Cigna is terrible, BCBS depends.” The framing is intuitive and it is how most operators have been trained to think about payers.
The problem is that rate variance within a single carrier is often larger than rate variance between carriers. Same California, same residential level of care, same OON status: four different BCBS home plans in the PayerLenz pool pay $3,778, $3,090, $2,297, and $662 per patient day.
Any statement about how “BCBS pays” that averages across those four home plans is technically true and operationally useless.
Operators making the anecdote mistake turn away profitable admissions because they believe the payer “pays badly,” and accept unprofitable admissions because they believe the payer “pays well.” Our BCBS alpha prefix and home plan resolution piece covers the mechanic that produces intra-carrier variance and why it is invisible from the carrier-level view.
Same California, same residential level of care, same OON status: four different BCBS home plans in the PayerLenz pool
$3,778
Per patient day, home plan A
$3,090
Per patient day, home plan B
$2,297
Per patient day, home plan C
$662
Per patient day, home plan D
Mistake 2: treating out-of-network as a single rate
The second mistake is treating OON reimbursement as if it converges to a single expected rate. In practice OON is a distribution that can span an order of magnitude within a single alpha prefix on identical coverage.
Operators making this mistake set their internal cost floor against a single OON assumption (typically the middle of the observed distribution) and then get crushed on the low tail. The admits that landed at the top of the distribution look like wins. The admits that landed at the bottom look like operational errors. Neither view captures the underlying reality, which is that OON is a distribution the operator needs to see and admit against, not a point estimate.
Rate intelligence produces the distribution view. The operator sees the range, sees where the specific plan lands within that range, and makes the admit decision against the probable rate rather than the folklore average.
Mistake 3: never closing the feedback loop
The third mistake is the most consequential and the least visible. The VOB said the coverage looked strong. The admit went ahead. The paid claim came back sixty days later at an amount below what the operator expected. Nobody reconciled the VOB assumption against the paid amount, so the pattern that predicted the underpayment did not get recorded, and the same misjudgment repeats every month, on every payer, forever.
Each individual admit produces a small delta between expected and actual. Aggregated across a year of admits, the delta becomes the largest revenue leak in the operating model.
Rate intelligence closes this loop by producing an expected reimbursement estimate at admit time and reconciling it against the paid amount at claim adjudication. The gap between the two feeds back into future admit decisions on similar cases. Over time, the operator’s assumptions calibrate against actual reimbursement history rather than drifting further from reality.
The Five Strategic Decisions Rate Intelligence Changes
Rate intelligence changes five specific payer strategy decisions. Each one produces a measurable improvement in the operating model when the operator runs the discipline with real data rather than folklore.
1. OON program viability
Every operator running out-of-network business has some OON programs that produce strong contribution margin and some that lose money. The problem is that carrier-level averages hide which programs fall into which category.
Rate intelligence separates the OON book at the alpha-prefix-plus-plan level. Some prefixes within a carrier consistently produce reimbursement above the operator’s cost floor. Others consistently produce reimbursement below it.
The strategic decision the operator can now make is which OON prefixes to continue accepting, which to redirect to different levels of care, and which to stop pursuing altogether. That decision is impossible without plan-level rate data. It is straightforward with it.
2. In-network contract renegotiation
In-network contract renegotiation happens when the operator brings evidence of the actual paid amounts to the payer contracting team. The contract negotiation shifts from an assertion about what the rate should be to a documented case built on claim-level evidence.
Rate intelligence produces that documented case. The operator can walk into the renegotiation with a specific claim volume at a specific paid rate distribution and make an evidenced argument for a rate increase, contract restructuring, or level-of-care carve-out.
Contract renegotiations built on rate intelligence data typically move meaningfully further than renegotiations built on operator assertions. The evidence is what changes the payer contracting team’s willingness to move.
3. Referral partner weighting
Referral partners deliver leads to the treatment center at a cost (either through direct payment, marketing spend, or opportunity cost on the admissions team’s attention). The right way to think about referral partner value is not the raw number of admits but the revenue-adjusted value of those admits.
Rate intelligence changes this calculation because the operator can now see which referral partners route higher-rate plans versus lower-rate plans.
A partner delivering 40 admits per quarter at an average paid rate of $2,800 per day is producing materially more value than a partner delivering 50 admits per quarter at an average paid rate of $900 per day, even though the volume-based ranking looks the opposite. Our referral partner attribution piece covers the specific attribution mechanics that turn admit volume into revenue-adjusted admit value.
4. Service line and level-of-care investment
Treatment centers making decisions about which service lines to build out or which levels of care to invest in typically make those decisions on volume assumptions rather than rate assumptions. “Detox brings in a lot of volume. PHP has good margins. Residential is our anchor product.”
Rate intelligence changes the investment calculation by producing service-line-level expected reimbursement at the plan level. Some payer mixes produce strong economics on residential and weak economics on PHP. Others produce the reverse. Some produce strong economics on detox but weak downstream conversion to residential. The investment decision changes when the operator sees the plan-level rate data by level of care.
The strategic implication is that service line investment decisions should be made with a payer-mix-specific rate model, not a generic industry benchmark.
5. Payer mix portfolio construction
The most important strategic decision rate intelligence changes is the composition of the payer mix itself. Most treatment centers do not actively manage payer mix; the mix is whatever the referral pipeline and admissions ops decisions have produced.
Rate intelligence lets the operator manage payer mix as a portfolio. The portfolio view identifies which plans and alpha prefixes concentrate profitable admits, which concentrate underperforming admits, and how the mix should shift to improve overall economics.
The portfolio construction discipline is closer to how a financial planner thinks about asset allocation than how most treatment centers think about payer mix. The framework is the same: allocate resources (admissions attention, referral partner development, service line investment) toward the payer categories that produce the best risk-adjusted return, and reduce exposure to categories that consistently underperform.
The Quarterly Payer Strategy Cadence
The right cadence for payer strategy work is quarterly. Monthly is too frequent to see meaningful rate pattern shifts. Annual is too infrequent to catch pattern changes before they materially affect the collections number.

The quarterly review should include the CFO or controller, the admissions director, ownership, and (if applicable) the marketing lead. The specific artifacts the review works from are the quarterly QBR reporting on admissions volume, the rate-adjusted admissions volume at the plan and alpha prefix level, the underpayment recovery outcomes from the billing team, and the referral partner performance broken out by revenue-adjusted value.
Our marketing and admissions QBR playbook covers the reporting shape and the discussion structure that produces good strategic decisions.
The outputs of the quarterly review should be specific and dated. Not “we should improve our BCBS mix” but “we are dropping OON prefixes A, B, and C effective 30 days from now, opening in-network renegotiation with payer D based on the observed rate distribution, and reweighting referral partner E’s admit priority from Tier 1 to Tier 2.”
Specific and dated decisions produce measurable outcomes at the next quarterly review.
Common Resistance and How to Handle It
Operators who have been running their payer strategy on folklore for years often resist the transition to rate-intelligence-informed strategy. The resistance is understandable and it typically comes from three sources.
The first is that folklore feels certain in a way that data does not. Operators who have said “BCBS pays badly” for a decade are unsettled by data showing that BCBS actually pays wildly differently across home plans, and that some of those home plans are among the best-paying OON opportunities available.
The second is that data-informed strategy requires more operational work than folklore. Weekly variance reports, quarterly QBR reviews, and portfolio-level payer mix management are more effort than “I know how Cigna pays, we’ve been doing this for years.”
The third is that data-informed strategy sometimes produces decisions that contradict the operator’s intuition. Dropping a payer the operator thought paid well because the data shows the mix is actually underperforming. Investing in a service line the operator was ready to shut down because the plan mix on that LOC produces strong economics. Reweighting a referral partner the operator liked because the partner’s admit stream is a low-rate plan concentration.
The transition works when the operator picks one payer strategy decision, runs it through rate intelligence, executes the decision, and measures the outcome at the next quarterly review. A single measurable win typically resolves most of the resistance and clears the path for the broader discipline shift.
This connects to the broader revenue cycle picture covered in billing mistakes that reduce admissions and reducing claim denials.
Frequently Asked Questions
How do I know if my current payer strategy is folklore-driven or data-driven?
Ask yourself two questions. First, when you say “payer X pays well” or “payer Y pays badly,” at what resolution do you make that claim: carrier, plan, alpha prefix, or level of care? Folklore-driven strategy makes the claim at the carrier level. Data-driven strategy makes the claim at the plan or alpha prefix level.
Second, when the VOB predicts a specific coverage picture at admit and the paid claim comes back sixty days later, does anyone reconcile the two? Folklore-driven strategy does not close the loop. Data-driven strategy runs weekly variance reports that catch the pattern shifts before they compound.
If your answers are carrier-level and no-reconciliation, the current strategy is folklore-driven regardless of how sophisticated the internal framing feels.
What’s the smallest first step to move toward data-driven payer strategy?
Start with a single alpha prefix on a single OON payer you believe you know well. Pull the last 12 months of paid claims for that prefix. Compare the actual paid amounts against what your operator instinct would have predicted.
The gap between the two is your case for the transition. If the gap is small, your folklore is doing better than most; the value of rate intelligence for you is more marginal.
If the gap is large (which is the far more common finding), you have specific evidence for why the transition to data-driven strategy is worth the operational effort. That single-prefix exercise typically takes a billing analyst two hours and produces a defensible answer about whether the transition is worth pursuing.
How does rate intelligence handle payer mix changes over time?
Rate intelligence tracks payer adjudication patterns as they shift. A payer that renegotiated rates in Q2 will show the shift in the pool within a few weeks as new claims flow in. Confidence scoring updates as older claims decay through the 12-month half-life and newer claims accumulate.
For payer strategy purposes, the practical implication is that the quarterly review should look at both current-quarter rate estimates and trailing-quarter comparisons. A payer that has been drifting downward over three consecutive quarters is a different strategic situation than a payer that spiked down in the current quarter but has been stable historically.
Longer-term trends inform contract renegotiation timing and OON program viability decisions.
Should we drop payers whose rate intelligence data shows they are underperforming?
Not automatically. Payer economics are one input to the strategic decision, not the whole decision.
Other factors that matter: the payer’s share of your referral pipeline (dropping a payer that delivers 30 percent of your admits without a replacement referral source damages more than the rate improvement compensates), the payer’s role in your local network landscape, and the operational cost of the transition.
The right framing is that rate intelligence identifies the candidate decisions. Executing them requires weighing the full operational picture, not just the rate math.
How does rate intelligence change contract renegotiation with in-network payers?
Contract renegotiation shifts from an operator assertion about what the rate should be to a documented case built on claim-level evidence. The operator brings the actual paid distribution across the last 12-24 months, the specific plans and levels of care that are underperforming against the contract terms, and the requested rate structure.
Payer contracting teams respond to evidence differently than they respond to assertions. Data-informed renegotiations typically move further and settle in fewer rounds than folklore-driven ones.
The specific claim volume that supports a defensible negotiation position varies by payer, but in general 100-plus adjudicated claims at the plan and LOC level over a trailing 12-month window is enough to support a formal renegotiation conversation.
How do referral partner conversations change with rate intelligence?
The conversation shifts from admit volume to revenue-adjusted admit value. Instead of “you delivered 40 admits this quarter, thank you,” the framing becomes “you delivered 40 admits at an average rate-adjusted value of $X, which puts you in the top quartile of our current partners.”
That framing is more useful to both sides. The treatment center makes better resource allocation decisions on referral partner development. The referral partner gets clearer feedback about which case profiles produce the best mutual value.
Some referral partners resist the shift because they are used to being measured on volume. The ones who lean in typically become higher-value partners over time because they can shape their referral patterns toward the plans that produce the best outcomes for both sides.
Preston Powell is CEO of Webserv, a behavioral health marketing agency and admissions operations platform working with residential, outpatient, and telehealth treatment providers across the United States. He founded Webserv in 2015 and co-founded the PayerLenz reimbursement intelligence product alongside Kyle McHenry.