A regional operator ran three separate marketing QBRs last year. Their paid vendor’s QBR. Their SEO vendor’s QBR. Their creative shop’s QBR. Every one of the three ran through impressions, clicks, leads, and vanity metrics.
None of them mentioned admits. None of them talked to the admissions team. None of them reconciled the marketing report against the CRM’s actual admit count for the quarter.
The operator’s CFO called our admission ops team after the third QBR that quarter and asked a simple question: how do we run a QBR that ties marketing to admissions? This piece is that answer.
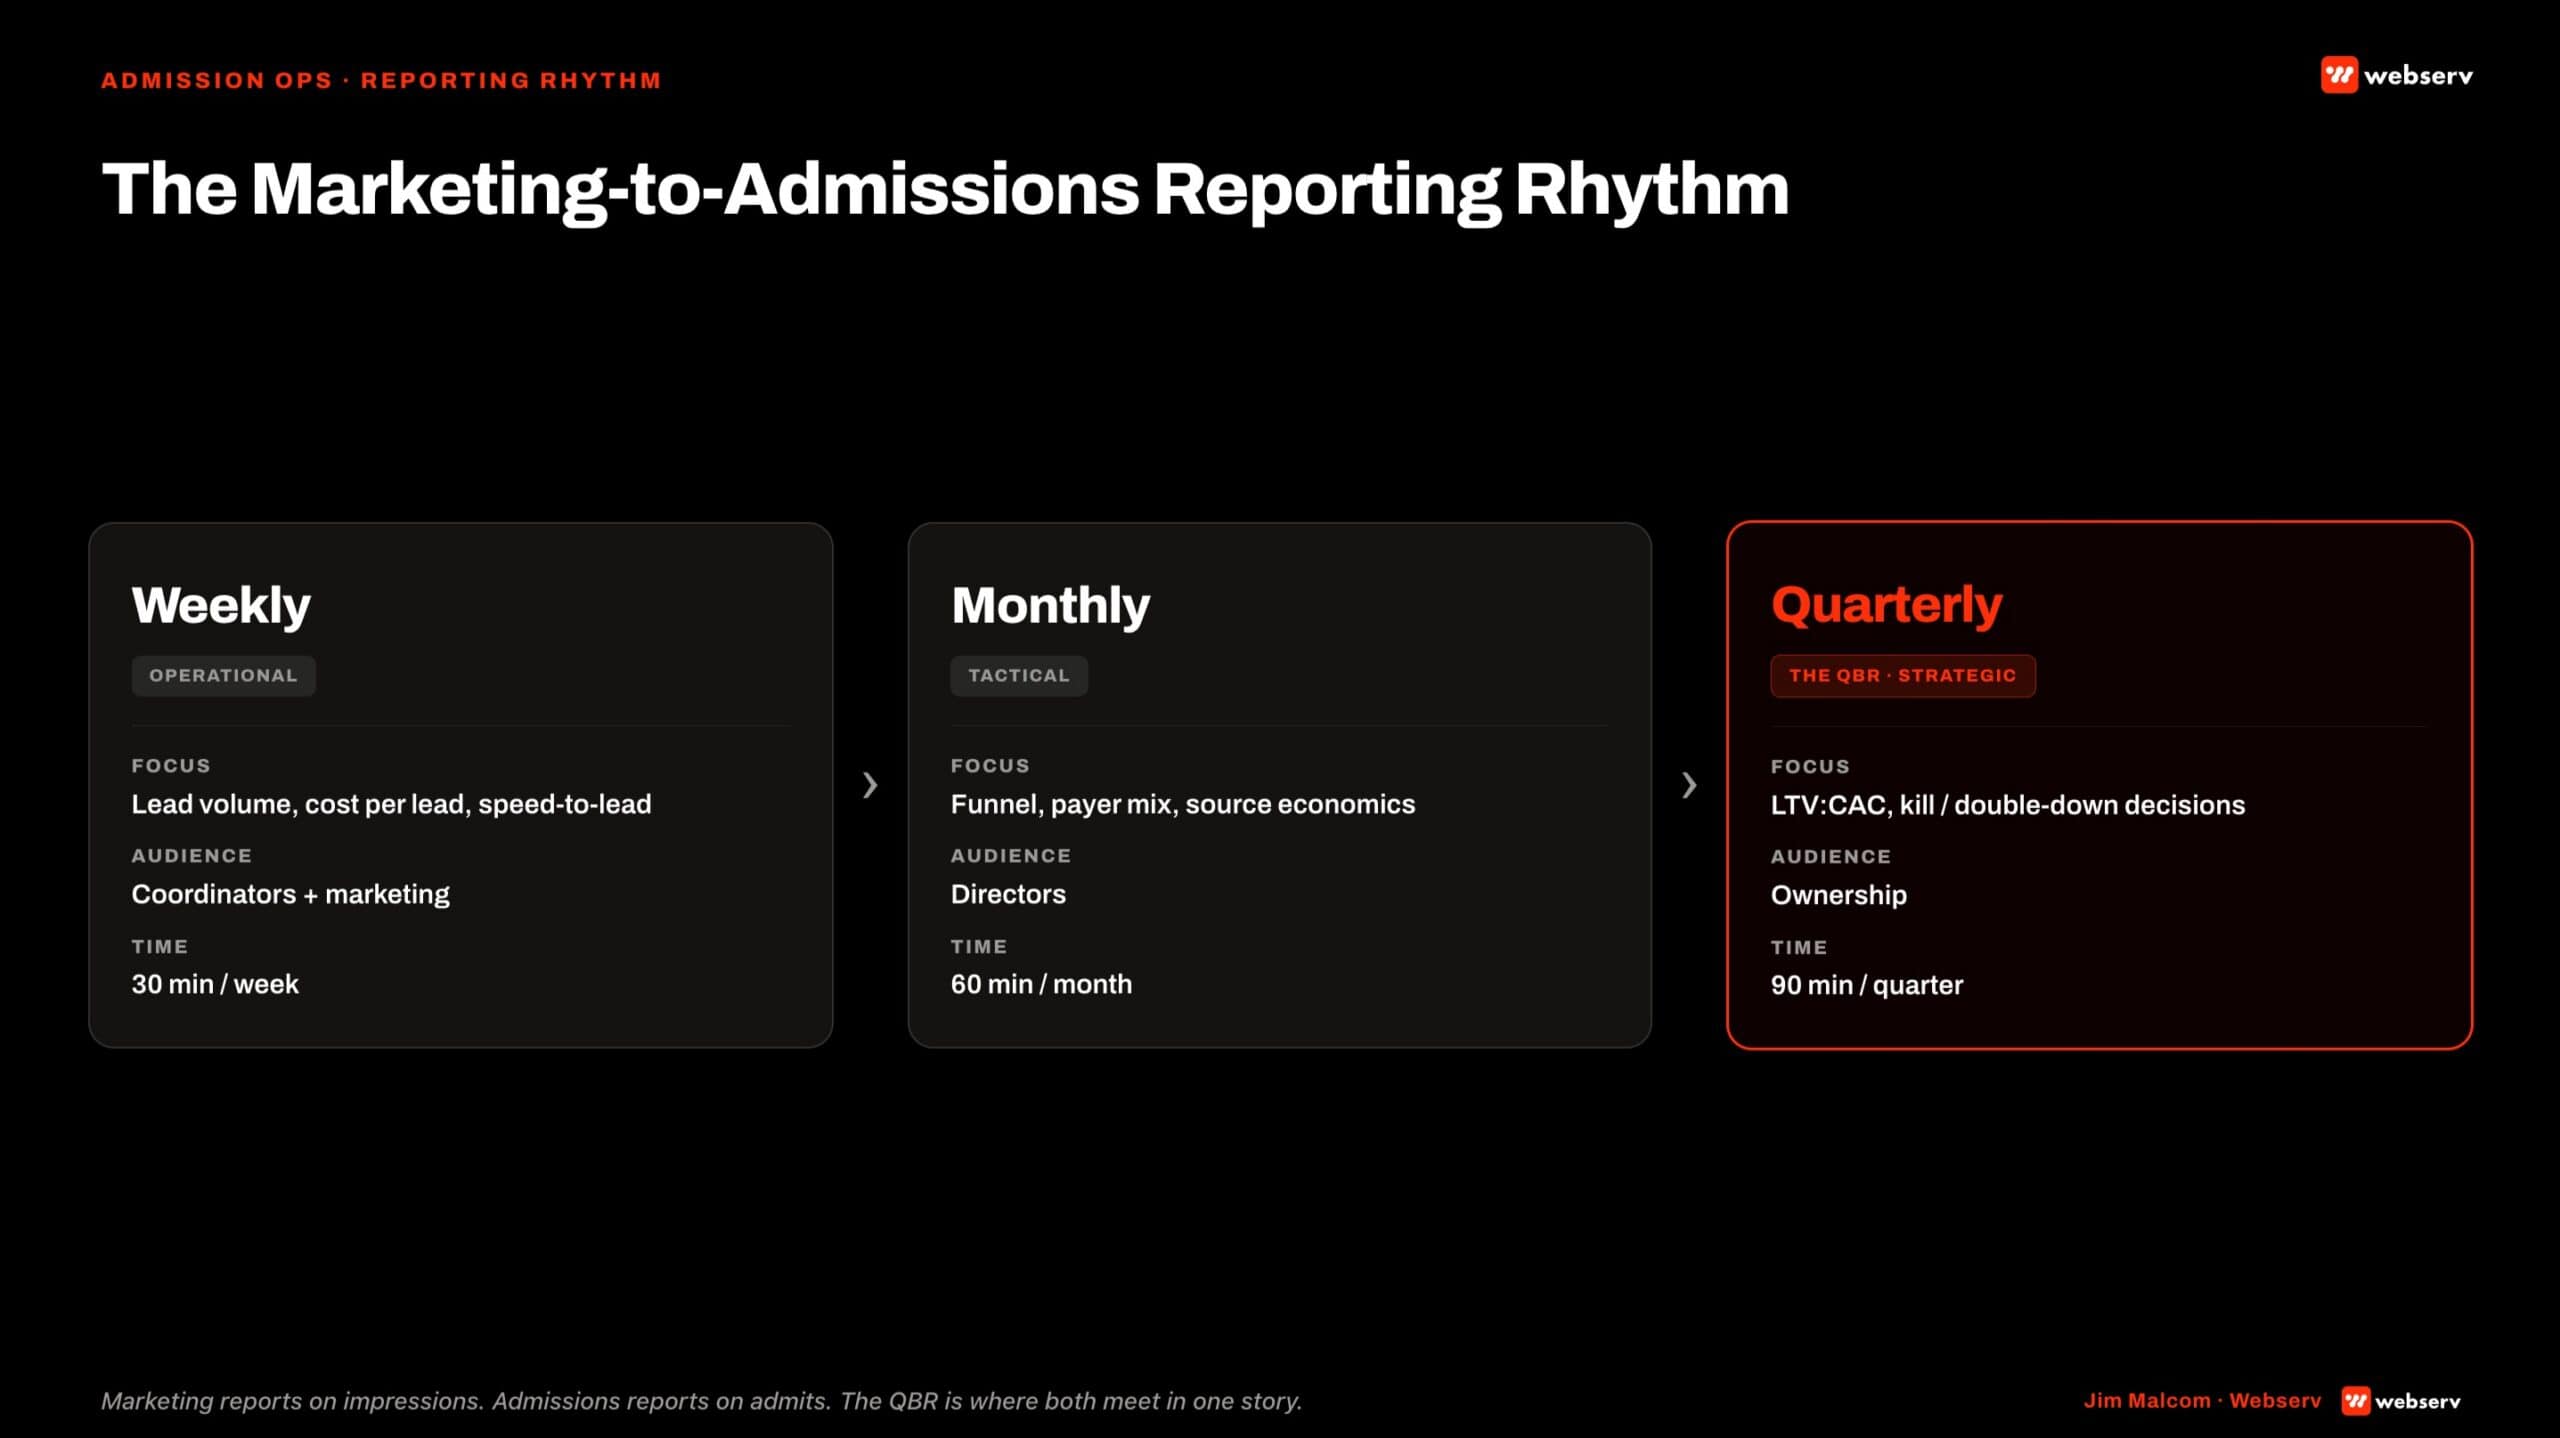
The playbook covers the weekly reporting rhythm that feeds the monthly strategic review that feeds the quarterly business review. Metrics that belong at each cadence. Failure modes to avoid. The agenda template that separates a marketing report from a marketing-and-admissions operating review. For the full marketing side of the review, see our complete guide to behavioral health marketing.
This piece is the Attribution and Reporting sub-hub inside the broader Admissions Operations Complete Guide. The QBR is where the four sub-disciplines (Lead Management, EMR Integration, Billing/RCM, Attribution) get read together, and the umbrella guide covers the full operating layer this playbook sits inside.
Key Takeaways
- The right joint operating rhythm has three cadences: weekly reporting, monthly strategic review, and quarterly business review. Each cadence has different metrics, different attendees, and different decisions. Collapsing them into one meeting a month misses the point of all three.
- Admits is the north star metric. Every rhythm rolls up to admits. Every channel is evaluated on its contribution to admits, not its own vanity metrics.
- Weekly reporting is a data hand-off, not a meeting. Automated dashboards or a 5-line email covering admits, viable-VOB rate, cost per admit, and missed-call rate. Any facility running weekly meetings is running the wrong cadence.
- Monthly strategic review is a 60-minute working session covering pipeline health, upcoming initiatives, platform policy or compliance changes, and any interventions the reporting surfaced. This is where the marketing team and the admissions team sit in the same room.
- QBR is a 90-minute leadership session. Rolls up the quarter’s performance. Benchmarks against the plan. Resets the next quarter’s targets. Every QBR should be attended by the CFO or COO of the facility, not just marketing.
- Six metrics belong in every QBR: admits by source, cost per admit, viable-VOB rate, coordinator close rate by source, discharge outcome by source, and payer-mix by source. Marketing reports that skip any of these six are optimizing the wrong number.
- The QBR agenda has seven parts and takes 90 minutes. Any QBR that ends in 30 minutes is a status update, not a business review. Any QBR that runs three hours is not scoped.
What a Marketing-to-Admissions QBR Actually Is
A quarterly business review is not a marketing report. It is a joint operating review where marketing performance gets evaluated against admissions outcomes, not against clicks and leads.
The distinction matters because most addiction treatment marketing agencies run QBRs that never touch admissions. Impressions climbed. CPC came down. Landing page conversion rate improved. All of it is optimization work. None of it answers whether the marketing produced admits.
The right QBR ties every marketing metric back to an admissions outcome. Impressions produced how many admits. Which source produced admits that completed treatment versus admits that left AMA at day 6. Which coordinator converted which source at what close rate. Which payer mix admitted from which channel.
That is the QBR that leadership can make decisions from. Anything less is a status update.
Why Most Marketing QBRs Miss the Admissions Layer
Three structural reasons marketing QBRs skip admissions.
The agency does not have admissions data. Marketing agencies see the CRM’s lead-to-admit conversion when they have access to the CRM. Most facilities do not give their marketing agency CRM access. The QBR reports what the agency can see: ad platform metrics and Google Analytics. Admits stay invisible.
Admissions and marketing report to different leadership. Marketing reports to the CMO or CEO. Admissions reports to the COO or Director of Admissions. QBRs happen inside marketing’s reporting line. The admissions team is not in the room. The reporting stops at the marketing-to-admissions handoff.
Attribution is hard and everyone gives up. Attribution from ad click to admit is complex. Marketing sources feed leads. Leads become VOBs. VOBs become admits. Admits become completed treatments.
The chain has 60-90 day lag and multiple handoffs. Most agencies do not build the reporting infrastructure to close the loop, so the QBR reports what is easy to measure instead.
The fix is architectural. The right QBR is designed backwards from admits. Start with the admit count. Segment by source. Ask which channels produced which admits. Every metric upstream of that question is optimization detail.
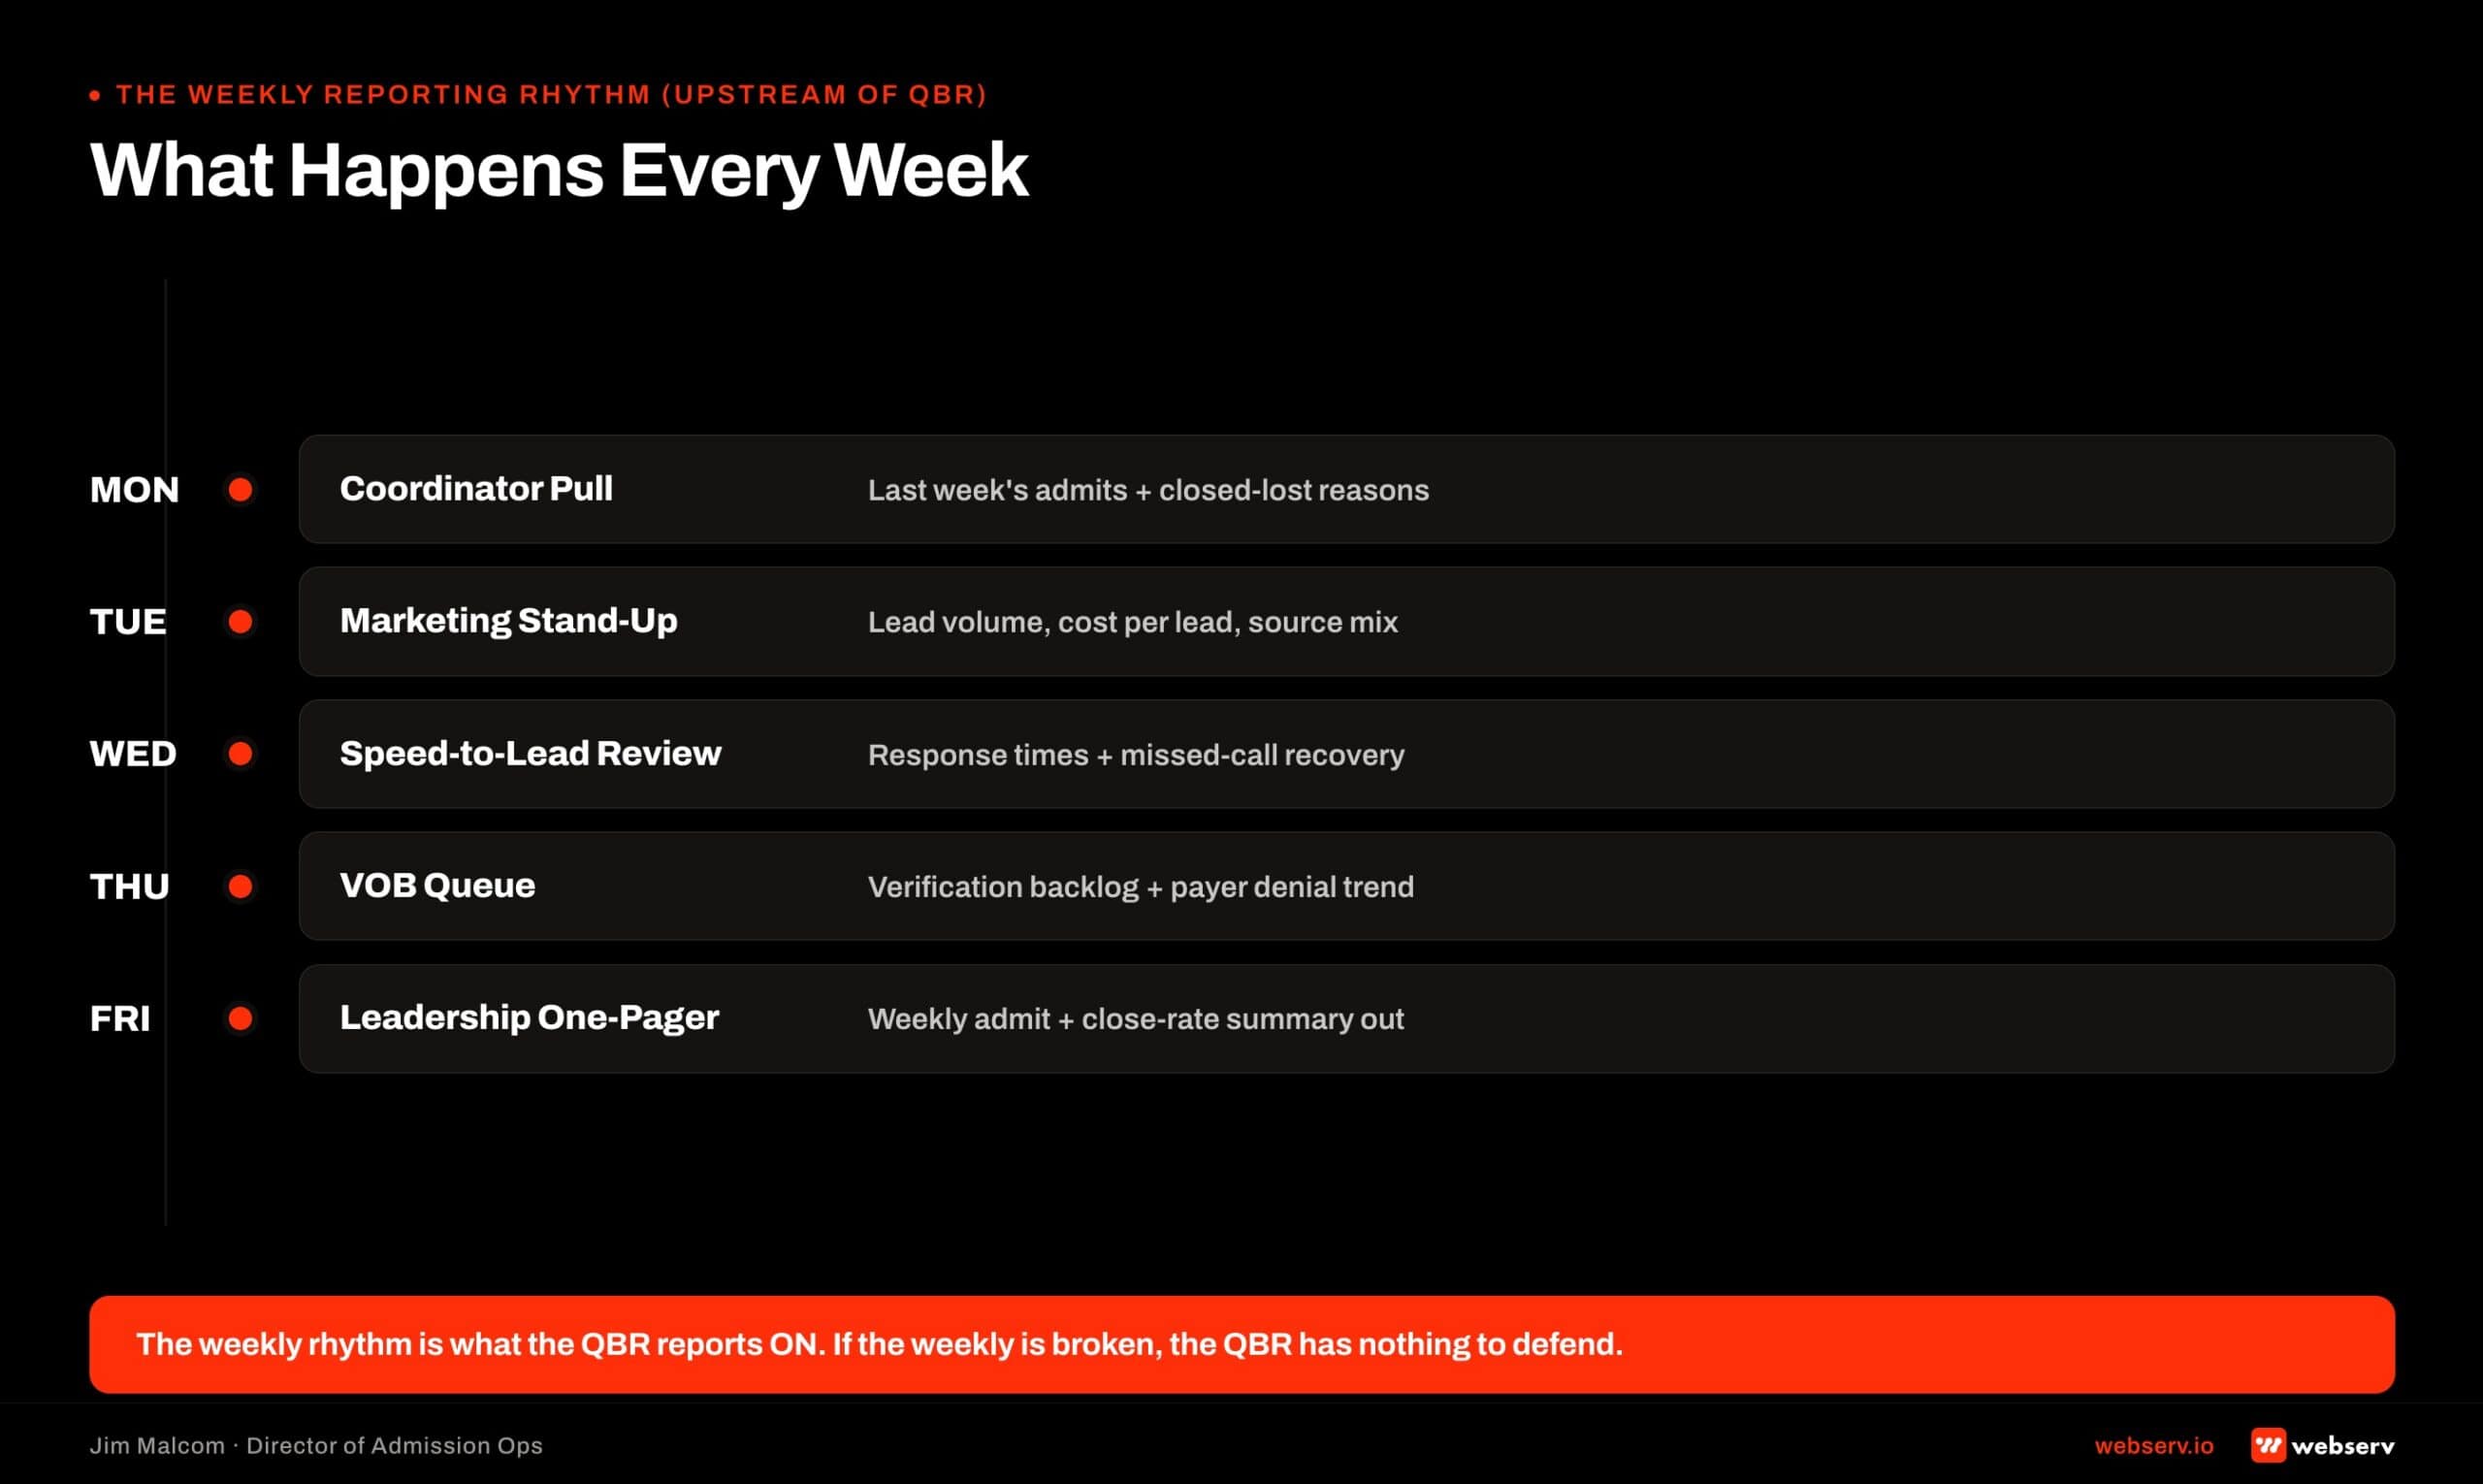
The Weekly Reporting Rhythm (Upstream of QBR)
Weekly reporting is where the QBR gets its data. If the weekly reporting is broken, the QBR is broken.
The right weekly reporting is a data hand-off, not a meeting. A dashboard that leadership can pull on demand, or a 5-line email that summarizes the week’s performance against the plan.
What belongs in the weekly report.
- Admits this week versus target
- Viable-VOB rate this week versus target
- Cost per admit this week versus target
- Missed-call rate this week versus target
- Any interventions or anomalies from the week
That is the full report. If the report is longer than five bullets, it is reporting more than the operator needs on a weekly cadence.
What does not belong in the weekly report. Deep source segmentation. Coordinator scorecards. Payer-mix analysis. Platform-level detail from Google Ads or Meta. All of it matters. None of it belongs on a weekly cadence. It belongs in the monthly strategic review.
Facilities running weekly marketing meetings that cover source segmentation and platform detail are running the wrong cadence at the wrong depth. The result is that leadership gets swamped with detail every week and never has the strategic conversation the monthly cadence is designed for.
Monthly Strategic Review
The monthly strategic review is a 60-minute working session. Marketing team, admissions team, and one operational leader (Director of Marketing, Director of Admissions, or the operating executive who owns both).
The four topics that belong on the agenda.
Pipeline health by source. Which channels are producing which admits at which cost. Where the leaks are. Where the wins are. This is the segment-level analysis the weekly report deliberately skipped.
Upcoming initiatives. New campaigns, new landing pages, new content pieces, new payer contracts that will affect the source mix. What is going live this month and what leadership needs to know.
Platform policy or compliance changes. LegitScript re-certification cycles, HIPAA online tracking guidance updates, ad platform policy changes affecting behavioral health, 42 CFR Part 2 changes. Anything in the compliance stack that could affect marketing operations.
Interventions the reporting surfaced. Any anomaly from the weekly reporting that needs a decision. Sudden drop in viable-VOB rate on one payer. Spike in missed-call rate at a specific time of day. Cost per admit climbing on a paid channel. This is where fast decisions get made.
The monthly review is where marketing and admissions sit in the same room. The whole point of the cadence is that the two functions communicate at a rhythm that catches problems before the quarter.
The Quarterly Business Review Agenda
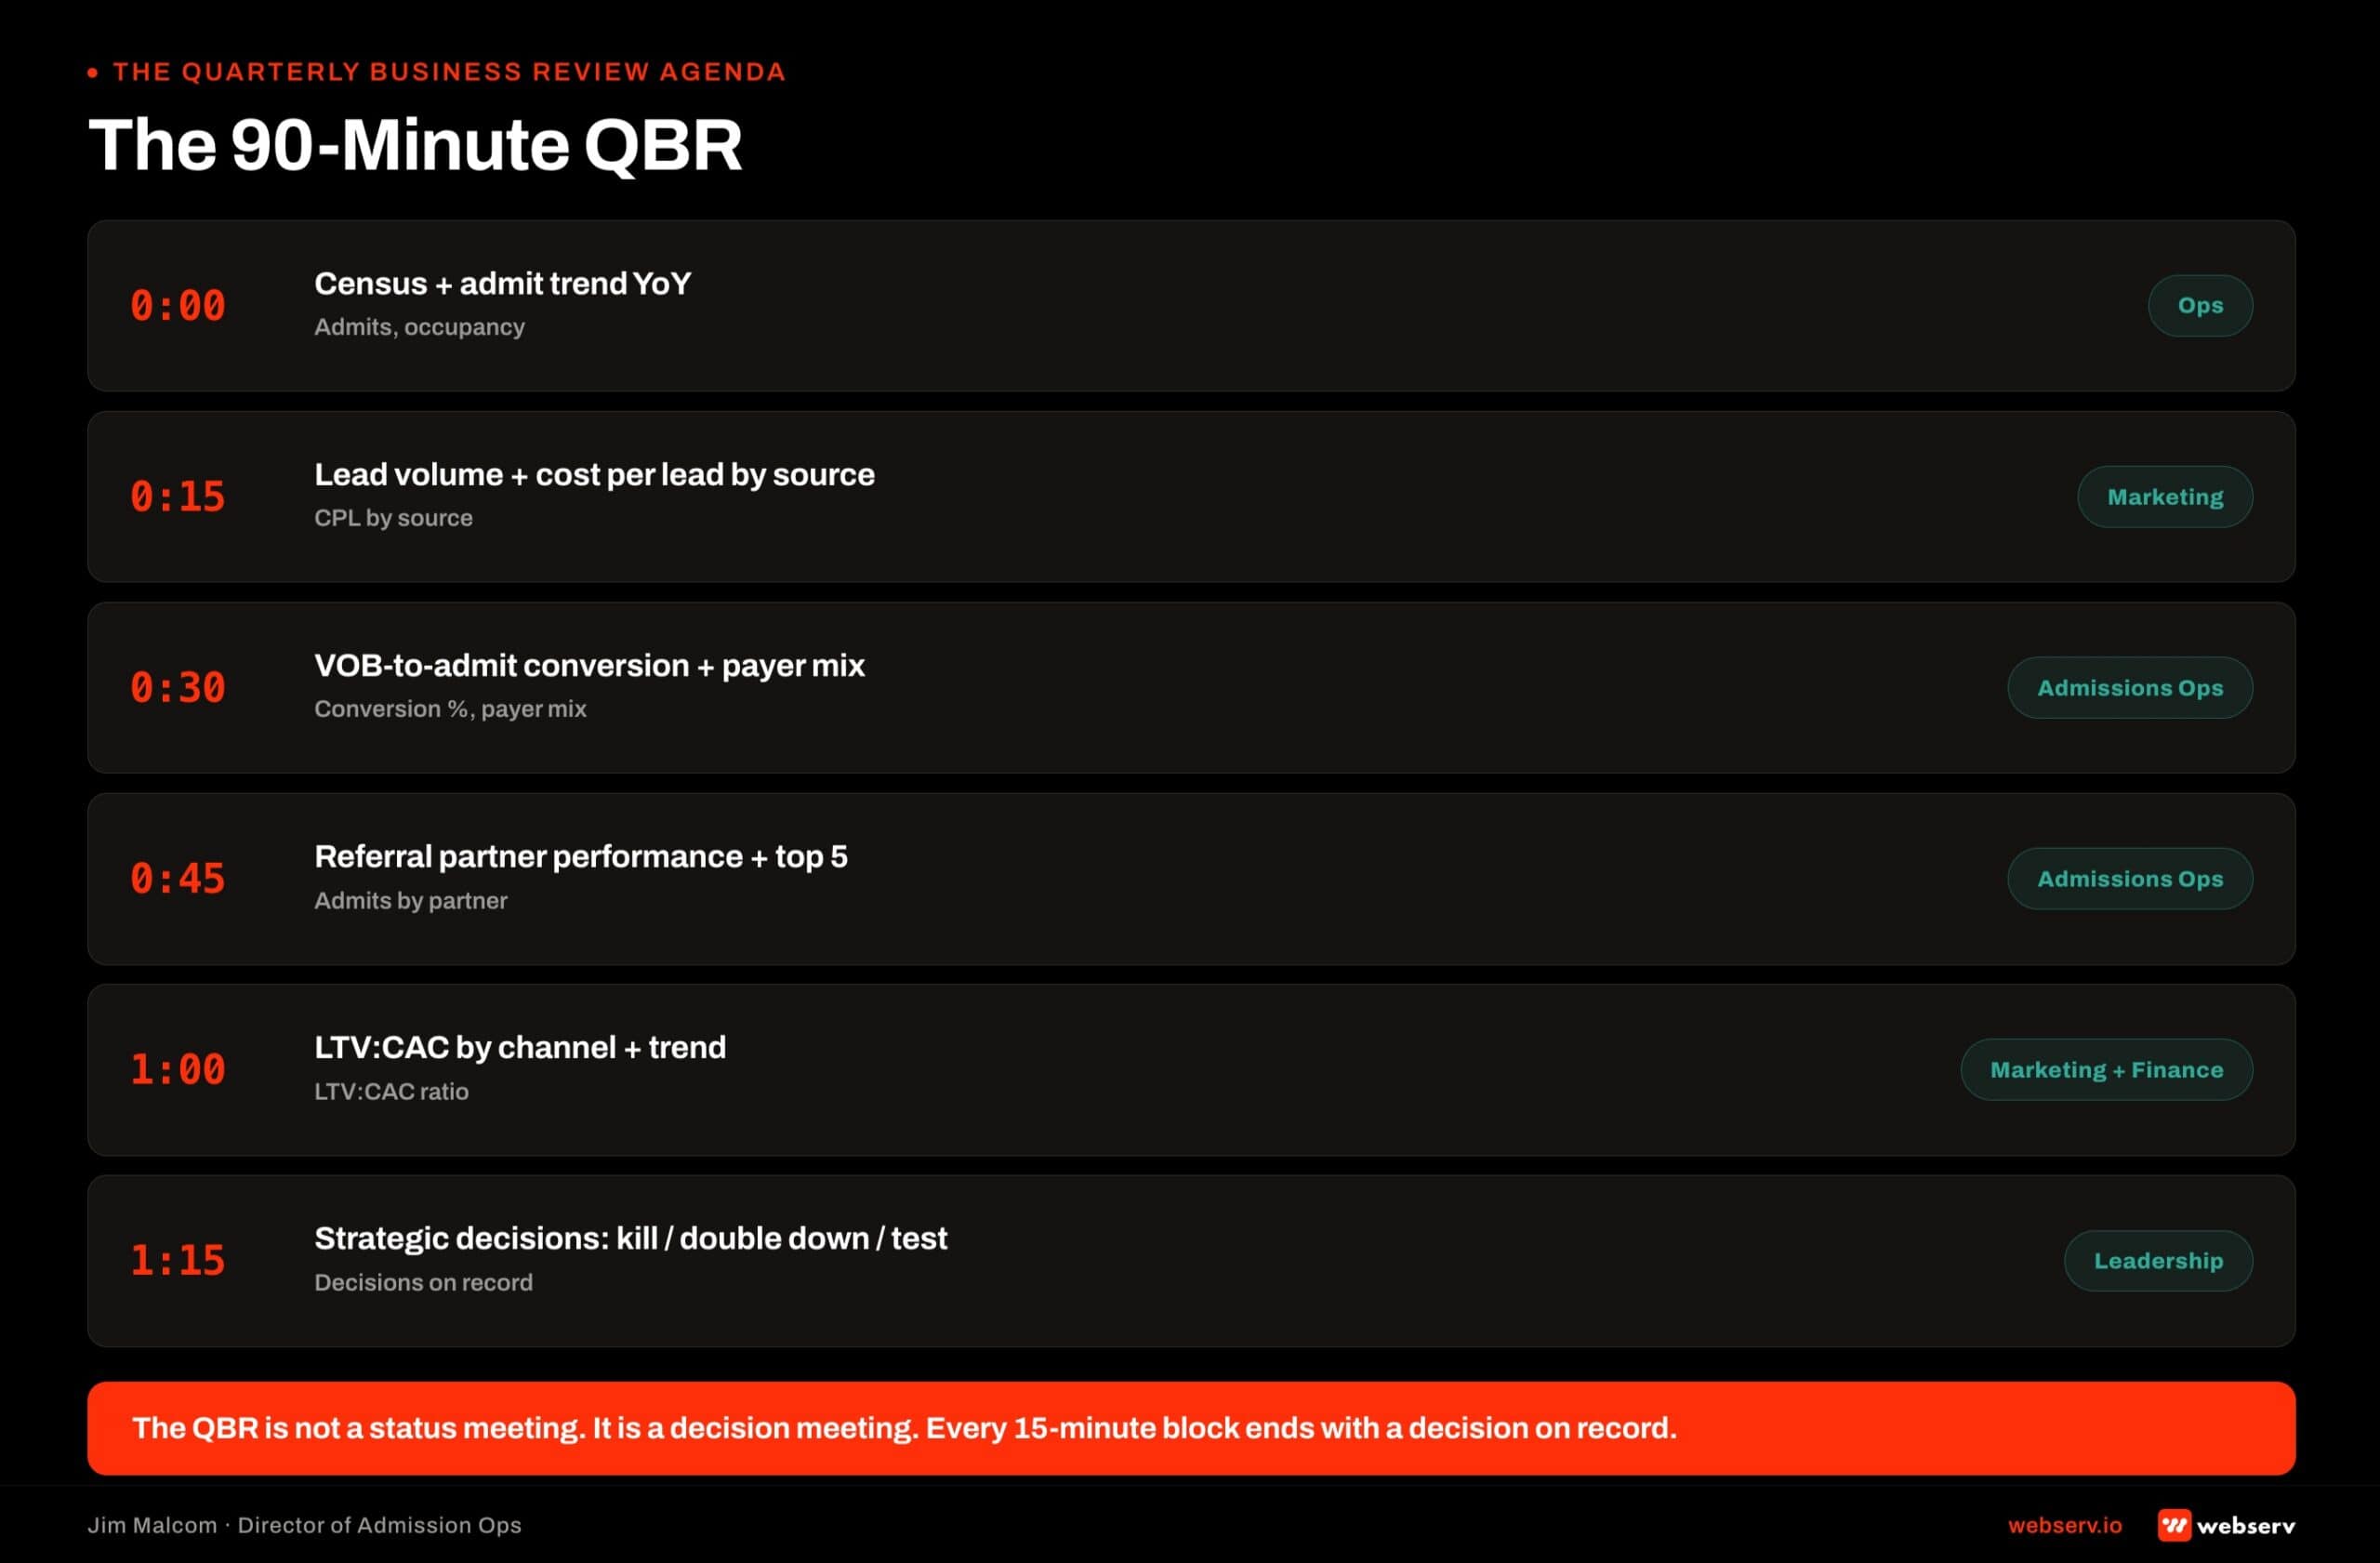
The QBR is a 90-minute leadership session. The right attendees are the CFO or COO, the Director of Marketing, the Director of Admissions, and the primary agency lead. Any QBR without the CFO or COO in the room is a status update, not a business review.
The agenda has seven parts. Every part has a specific time allocation and a specific decision output.
Part 1: Quarter-in-review (15 minutes). Roll up the quarter’s admits, cost per admit, viable-VOB rate, and payer mix against the plan. Delta from plan. What drove the delta.
Part 2: Source-level performance (15 minutes). Admits by source for the quarter. Cost per admit by source. Which sources over-delivered and which under-delivered against their target.
Part 3: Discharge outcome by source (10 minutes). Percentage of admits per source that completed treatment. This is where marketing spend gets calibrated against admit quality, not just admit count.
Part 4: Payer mix by source (10 minutes). Which sources produced which payer mix. This ties marketing directly to reimbursement outcomes.
Part 5: Interventions and lessons (15 minutes). What changed during the quarter. What we tried that worked. What we tried that didn’t. What we would do differently.
Part 6: Next quarter plan (20 minutes). Target admits by source. Budget allocation. Any campaigns or initiatives scheduled. Any admissions ops changes that affect marketing (new coordinators, new hours, new payer contracts).
Part 7: Open questions and decisions (5 minutes). Anything that needs a leadership call. Anything that needs a follow-up meeting. Anything that changes between now and the next monthly review.
That is the QBR. 90 minutes. Every part produces a decision or a plan. Any QBR that ends in 30 minutes is not a business review.
Behavioral health admissions operations infrastructure is a documented driver of conversion outcomes (SAMHSA, National Survey of Substance Abuse Treatment Services). The QBR is the leadership rhythm that keeps that infrastructure aligned with the marketing spend feeding it.
Weekly stand-up
Monday morning. 30 minutes. Admissions manager + marketing director + operator. Admits, cost per admit, speed to lead, missed-call recovery, VOB-to-admit conversion.
Monthly funnel review
First business day of each month. 2 hours. Full funnel + payer mix + denial rate. Deliverable is a monthly report to ownership.
Quarterly business review
First business day of each quarter. 90 minutes. Every KPI on the spine. Every channel green-yellow-red. Every referral partner named.
Four Stakeholder Frames: The Same QBR Reads Differently
The same QBR deck lands very differently in the room depending on who is sitting across the table.
I have watched excellent QBR data get rejected as useless by an owner because it opened with the wrong slide, and I have watched mediocre data get received as strategic because the marketing director framed the first ten minutes correctly.
Every operator running QBRs at a treatment center is presenting to at least four distinct listener frames, and running the same content four different ways is how good reporting turns into good decisions.
Owner Frame: “Are We Winning?”
The owner walks into the QBR with one question underneath everything else. Is this business winning or losing this quarter.
They care about census versus plan, cost per admit trend, payer mix stability, and LTV to CAC by channel. They do not care about coordinator-level metrics, tactical channel performance, or individual referral partner details unless one of those is the answer to the winning-or-losing question.
Open the QBR for an owner with a single slide answering the question directly. Census versus plan, a trend line, and a single number that says whether the quarter closed forward or back. Everything else gets earned by the first slide landing.
COO Frame: “Where Are We Fragile?”
The COO reads the same numbers looking for operational fragility. Where is the business exposed. Which channel is one algorithm change away from collapsing. Which referral partner represents 30% of our census with no backup relationship.
Open the QBR for a COO with a fragility scorecard. Three operational risks with dollar exposure attached to each, and a mitigation plan for each. The COO’s decision moment is whether to fund the mitigation. Everything else in the deck is context for that decision.
Marketing Director Frame: “Is Every Channel Earning?”
The marketing director reads the QBR at the channel level. Which channels are producing admits at what cost per admit. Where is creative fatigue setting in. What is the ad-spend allocation ask for next quarter. What is the test roadmap for the coming 90 days.
Open the QBR for a marketing director with a channel-level P&L view. Every channel gets a row. Every row shows spend, admits, cost per admit, and trend versus last quarter.
The next-quarter allocation ask is the final slide, and every allocation number has to trace back to the P&L rows above it.
CFO Frame: “What’s the ROI?”
The CFO reads for financial defensibility. LTV to CAC by channel with 24-month attribution. Days sales outstanding on new admits. Gross margin per admit by payer. Capital efficiency of marketing spend against alternate uses of the same capital.
Open the QBR for a CFO with the financial-first slide. ROI math with explicit assumptions, capital allocation recommendations, and the sensitivity table showing what changes if the assumptions move.
One QBR deck. Four opening slides. Every operator running QBRs at a treatment center should run the same content through four presentation frames, or accept that three of the four stakeholders leave the room without what they came for.
Metrics That Belong in Every QBR
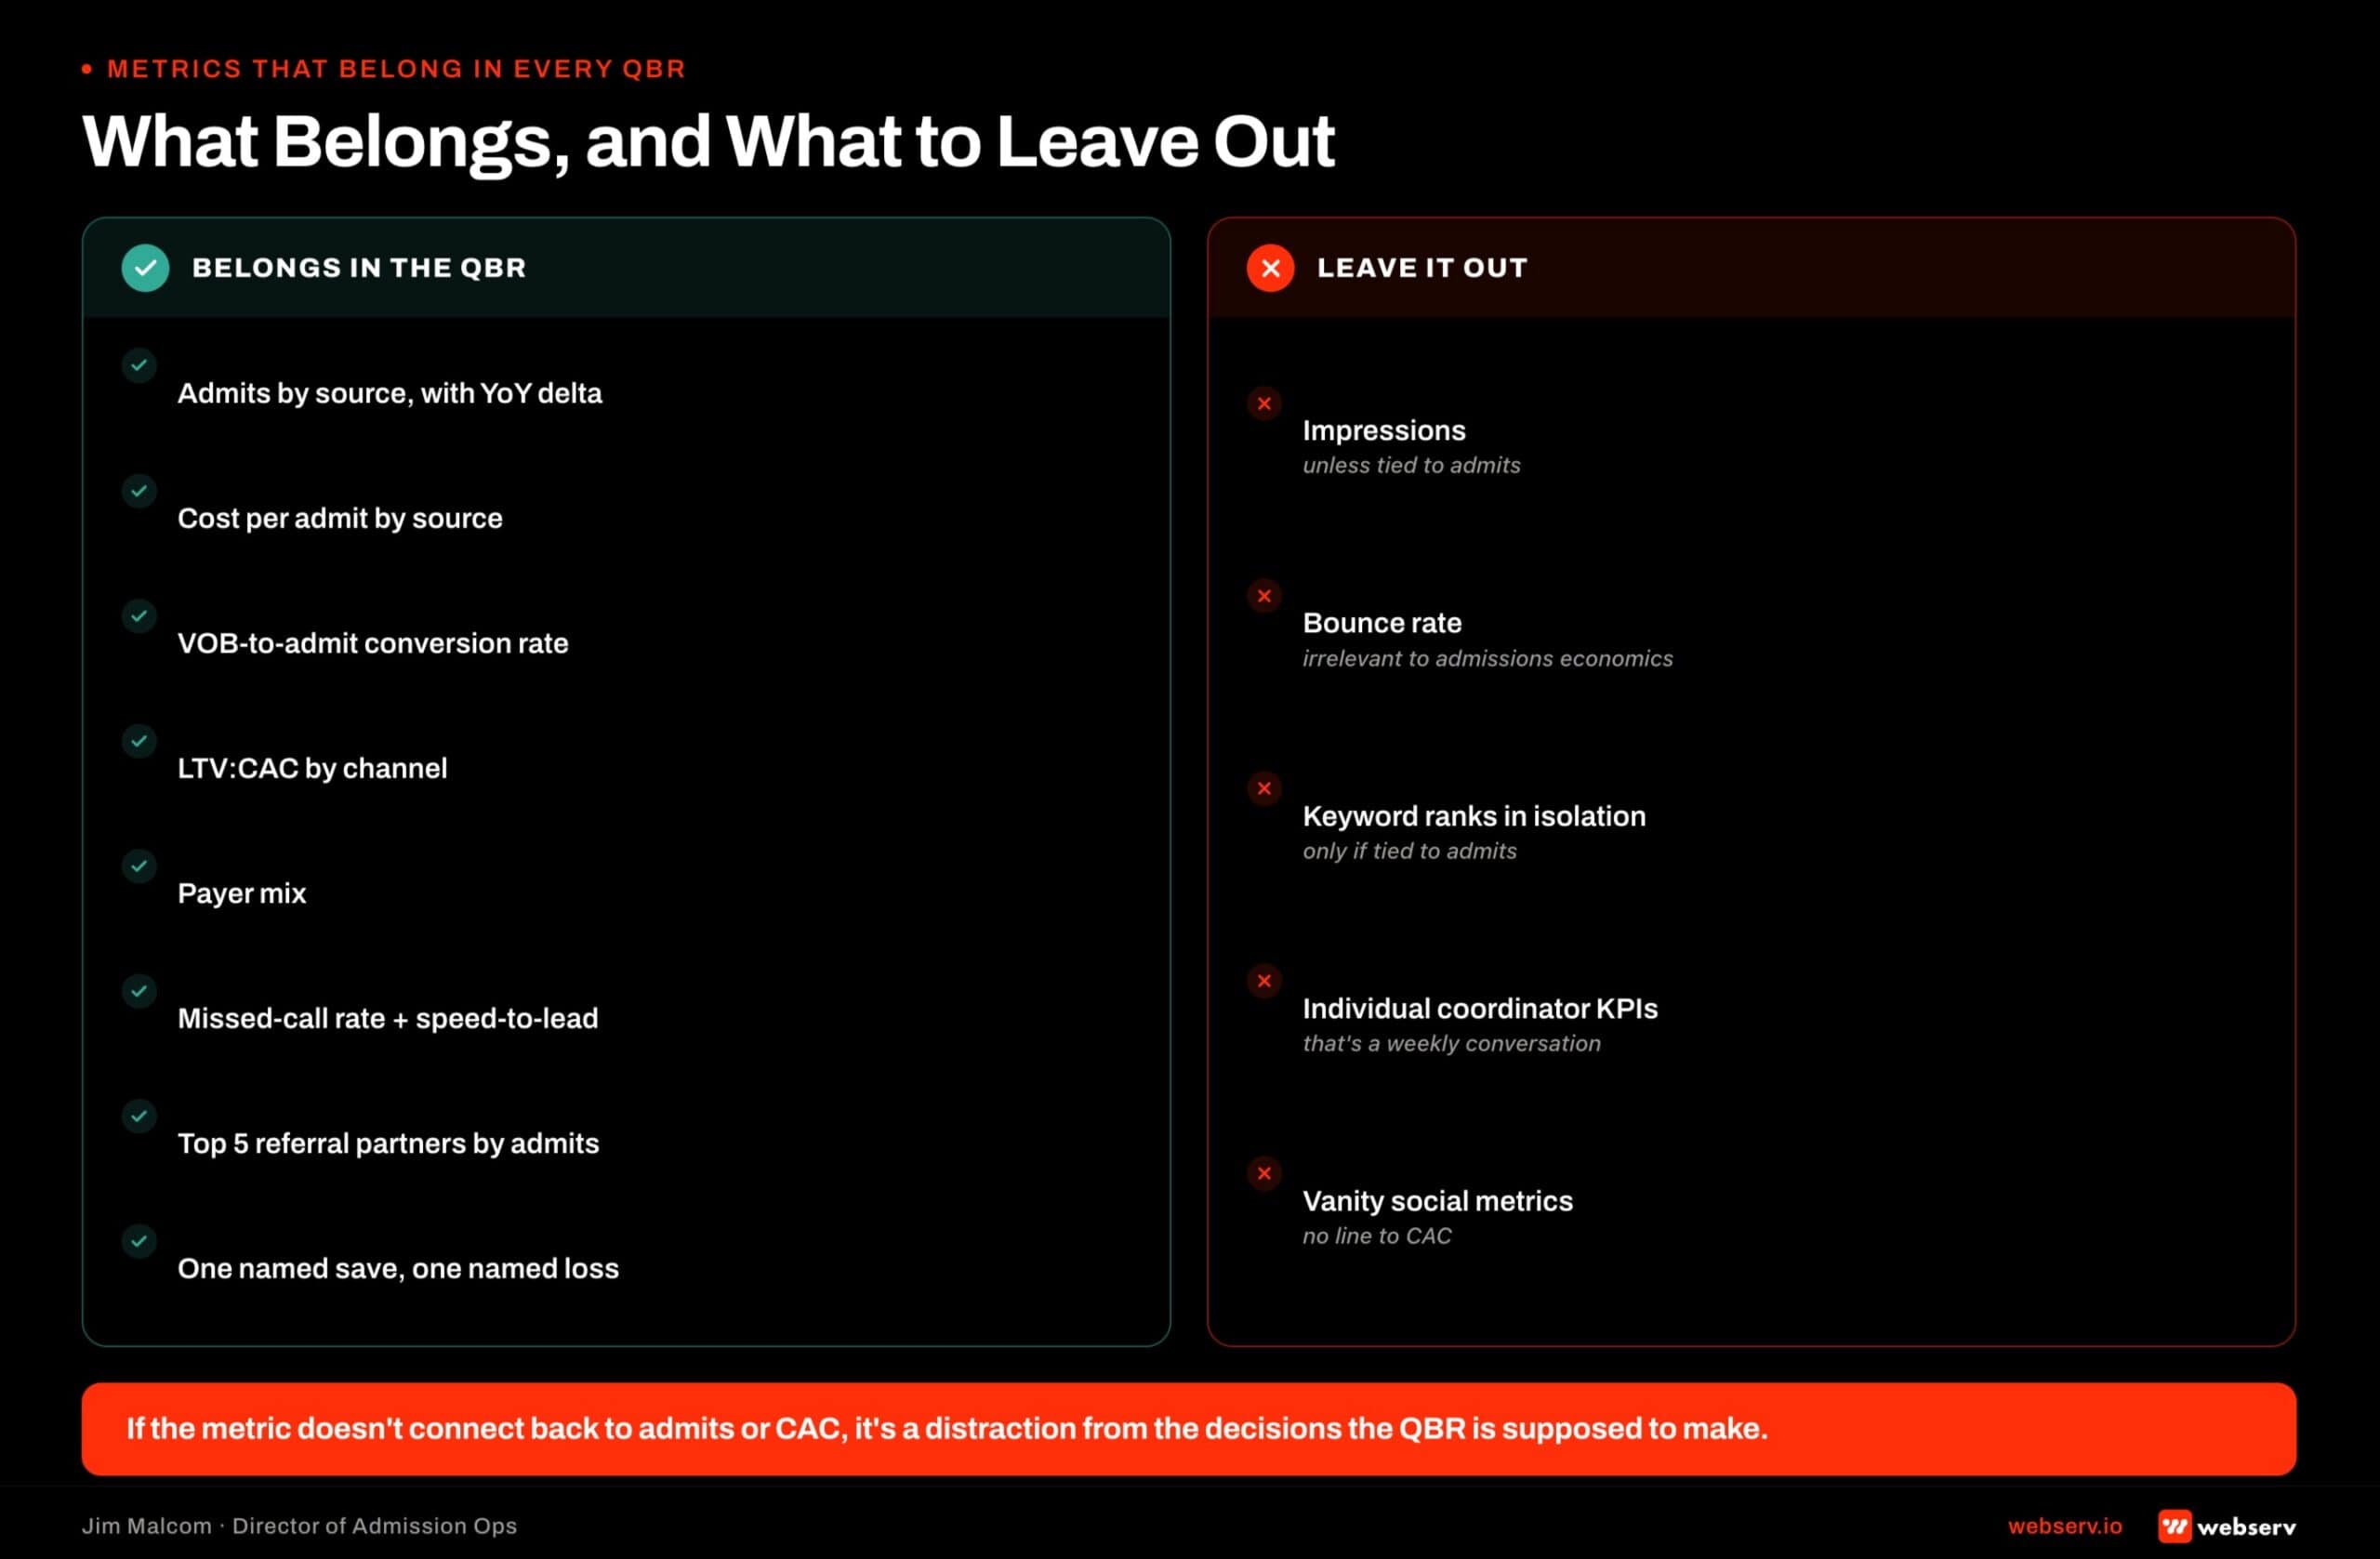
Six metrics that appear in every quarterly business review, without exception.
Admits by source. The north star. Which channels admitted which patients this quarter. Segment by paid, organic, referral, direct, and any facility-specific source categories.
Cost per admit. Marketing spend divided by admits, sliced by channel. Recalibrated monthly. Not gross billed. Actual reimbursement per admit, when the data is available.
Viable-VOB rate. Percentage of inbound leads that produced a viable VOB. This is the KPI spine every admissions CRM should carry, rolled up quarterly.
Coordinator close rate by source. VOB-to-admit close rate per coordinator, sliced by lead source. This surfaces whether a coordinator is genuinely converting or whether they are getting the easy sources.
Discharge outcome by source. Percentage of admits per source that completed treatment. Distinguishes marketing spend that produced completed treatments from marketing spend that produced revolving-door admits.
Payer mix by source. Which sources produced commercial-insurance versus Medicaid versus self-pay admits. Reimbursement math on each admit is different by an order of magnitude, so the payer-mix-by-source view is where marketing spend efficiency actually gets calculated.
LOC segmentation matters inside every one of these six metrics. Detox, residential, PHP, IOP, and OP each carry different reimbursement math and different admissions economics (ASAM Criteria). QBRs that report admits without segmenting by LOC are averaging across radically different economics.
Marketing reports that skip any of the six are optimizing the wrong number. Ask any agency to produce these six in a QBR before signing.
KPI Attribution: Tying Every Number to a Source
Every number in the QBR deck has to survive one question. Where did this come from and how confident are we.
If the number cannot answer both halves, it does not go in the deck. The invisible half of QBR mechanics is the attribution work behind every metric on the slide.
Marketing Channel Attribution
Marketing channel admits get calculated three different ways at three different treatment centers. First-touch attribution credits the channel that produced the initial inquiry. Last-touch attribution credits the channel active when the admit closed. Multi-touch attribution distributes credit across the full path from first touch to admit.
Every operator should pick one attribution model and stay with it. Switching models mid-quarter to make a channel look better is how QBRs lose credibility.
The source data lives in three places on most treatment center stacks: Google Analytics for organic and paid, the ad platform reports for direct spend, and the CRM lead source field for what actually converted.
The gap between “reported admits” (what the ad platform claims) and “attributable admits” (what the CRM confirms) is where most attribution arguments happen. The mechanical deep-dive on this at the tool level lives in the CallRail attribution setup piece.
Referral Partner Attribution
Referral partner admits get tracked through one of three mechanisms. A dedicated DNI (dynamic number insertion) pool assigned to the partner. A UTM plus landing page handoff that survives the intake handoff to the CRM. Or a manual source field the coordinator fills in when the admit closes.
PHI boundaries limit what you can share back with the partner. You cannot send patient-level data. You can send aggregated admit counts, aggregated LTV, and aggregated payer mix, but only when the aggregate is large enough to avoid re-identification.
The recurring QBR moment is when the referral partner says they sent us 12 admits last quarter and our CRM shows 8. Both numbers are usually correct.
The gap is intake attribution failing at the handoff, and it is fixable in the CRM configuration. The referral partner attribution deep-dive covers the mechanical fix.
Coordinator Attribution
Which coordinator owned which admit matters for coordinator-level performance management, but coordinator-level metrics stay OUT of the QBR. That conversation belongs in the weekly stand-up, where the coordinator is present, the numbers are recent, and the accountability lives with the admissions manager.
What stays IN the QBR is the coordinator-level trend at the team level. Ramp curves on new coordinators. Retention risk on senior coordinators. Capacity constraints when the team is undermanned. Those signals belong in the QBR because they inform hiring and staffing decisions the owner needs to make.
When a coordinator’s individual number is embarrassing, that gets handled outside the QBR. The CRM metrics piece covers what belongs at the coordinator level versus the team level.
Every number in the QBR deck needs an answer to “where did this come from and how confident are we.” If you cannot answer both, the number does not go in the deck. That discipline is what separates a QBR from a status meeting.
WATCH OUT
Skipping any of the three cadences produces the same failure pattern. Weekly slippage compounds into monthly firefighting. Monthly gaps compound into quarterly surprise. Quarterly gaps produce annual plans that were never grounded in operating reality. The rhythm is not administrative overhead. It is the discipline that keeps admissions ops from decaying.
Common QBR Failure Modes
Five failure modes that show up on QBR audits.
QBR happens without the admissions team in the room. Marketing runs the QBR. The admissions team never gets pulled in. The result is a marketing status update that no operator can use to make an admissions-quality decision.
Metrics stop at leads. The QBR reports lead volume and cost per lead. Never gets to admits. Every optimization decision downstream of the QBR is optimizing for lead volume instead of admit volume, and marketing spend calibrates against the wrong number.
No discharge outcome layer. The QBR reports admits by source but never revisits which admits actually completed treatment. Marketing spend that produced 30 admits at day-6-AMA rates gets treated the same as marketing spend that produced 30 admits at 30-day completion rates. Both look like 30 admits in the report.
No decisions get made. The QBR is treated as a status update. Nothing gets committed. No target changes. No budget shifts. No initiatives launched or defunded. Everyone leaves the room and the same problems show up in the next QBR.
QBR runs 30 minutes. A properly scoped 90-minute QBR that ends in 30 minutes is a QBR that skipped the analysis. Every part of the agenda gets compressed until only the marketing status update survives. Nothing actionable comes out.
The pattern under all five. The QBR is treated as a marketing meeting instead of a business review. The fix is architectural. Rebuild the QBR from admits backward, not from clicks forward.
Running the QBR When the Numbers Are Bad
Every QBR playbook writes the good-numbers version. The playbook for bad numbers is where operator credibility gets built or destroyed. I have run more bad-numbers QBRs than good-numbers QBRs across my career, and the pattern for handling each of the four common scenarios is more repeatable than most operators expect.
Scenario 1: Census missed plan by 15+ points
Open with the number, not the excuse. Put census versus plan on the first slide, showing the gap. Then walk the room through the funnel and isolate the leak. Almost every 15-point census miss traces to one of three causes. Lead volume down. Close rate down. VOB-to-admit conversion down.
Once the leak is isolated, present three response options with cost, timeline, and expected impact per option. Ask the room to pick one, not to debate the diagnosis.
The diagnosis is your job as facilitator. The decision is theirs. Confusing the two is how QBRs lose the next hour to relitigating data that was already correct.
Scenario 2: A channel needs to be killed
Present 90-day trend data with dollars attached. Explicit ask on the slide: kill or fund. Present the “what happens if we do nothing” scenario alongside the kill scenario so the room can see the counterfactual.
Have the replacement channel already scoped before the QBR. The room will not agree to kill a channel if there is nowhere to redirect the budget. Coming to the QBR with the replacement scoped is how the decision gets made in one meeting instead of three.
Scenario 3: A coordinator needs to be replaced
Never in the group QBR. Escalate to the owner or COO in a 1:1 before the QBR. Present the case as an operational risk with data attached, not opinion, and let the owner make the personnel call outside the room.
The QBR references it once, in the fragility scorecard as an operational risk, and moves on. Discussing individual staffing decisions in a group QBR is how the room stops trusting the QBR as a strategic space.
Scenario 4: A referral partner has stopped sending
Present the raw admit trend from the partner, the last conversation date, the payment history, and the retention play. Frame the situation as recoverable until proven otherwise. Do not announce “we lost the partner” until it is actually true.
The retention play should be specific. Partner check-in scheduled. On-site visit planned. Contract renegotiation on the calendar. Referral partners drift for a hundred reasons, most of them fixable inside a 30-day recovery window. The QBR is where the recovery play gets committed to, not where the partnership gets buried.
The QBR you run when the numbers are bad is the one operators remember. Do it well and you keep the trust to run the next one. Do it poorly and the QBR discipline decays inside two cycles.
QBR Artifacts: What Actually Gets Produced
Operators who ask “what does a QBR deliverable actually look like” do not get a clean answer from most reporting playbooks. The artifact stack that supports a functioning QBR discipline has four layers, and each layer has a defined shape.
The weekly one-pager. Every Monday. Owner is the coordinator or admissions manager lead. One page. Contains admit count for the week, VOB-to-admit conversion, speed to lead, missed-call recovery rate, and one flagged issue if the team is watching something. Reads in two minutes.
The monthly funnel review deck. First business day of each month. Owner is marketing and admissions together. 8 to 12 slides. Contains the funnel end to end, channel performance, payer mix trend, and a rolling forecast for the next 30 days. Reads in 20 minutes.
The quarterly business review deck. First business day of each quarter. Owner is the operator plus marketing plus admissions. 20 to 30 slides. Every KPI on the spine gets reviewed. Every channel gets a green-yellow-red. Every referral partner relationship gets named. Reads in 90 minutes.
The annual planning brief. Q4 to Q1 handoff. Owner is the operator and leadership. 5 to 8 pages of narrative plus supporting exhibits. Contains the census plan for the coming year, the marketing budget allocation, the staffing plan, and the operating priorities for each quarter.
Every artifact has a rule about what goes in it and what does not. Coordinator-level detail lives in the weekly one-pager, not the QBR deck. Channel-level P&L lives in the monthly deck, not the annual brief. Strategic bets and capital allocation live in the annual brief, not the weekly.
The artifact stack is scaffolding, not product. If the team is spending more time producing the artifacts than acting on them, the artifact stack is too heavy and needs to be trimmed.
The right test is whether each artifact drives a decision or an action. If it does not, the artifact should not exist.
OPERATOR INSIGHT
Data standards become non-negotiable at four-plus facilities. Every facility reports the same 8 to 10 KPIs in the same format on the same cadence. Facility A tracking admits by lead source and Facility B tracking admits by referral partner makes cross-facility comparison impossible, and the regional QBR degenerates into arguing about definitions instead of making decisions.
Multi-Location QBR Variations
The QBR mechanics I have described work as-is for a single-facility treatment center. Multi-location operators need explicit variations, or the QBR discipline breaks in predictable ways as facility count grows.
One facility. Single QBR. Owner in the room. 90 minutes. Everything already described in the agenda H2 applies without modification. The full stakeholder frame set (Owner, COO, Marketing Director, CFO) fits inside one meeting.
Two to three facilities. Combined QBR with per-facility segments. Two hours instead of 90 minutes. Standardized templates for each facility so cross-facility comparison is possible in the same room.
Regional admissions director attends alongside the owner. The stakeholder frames still apply, but the CFO frame gets weighted more heavily because capital allocation across facilities becomes the primary financial decision.
Four or more facilities. Two-tier structure. Facility-level QBR happens at each site, run by the facility director. Facility-level rolls up into a regional QBR run by a regional director. Owner attends the regional QBR only. Facility-level QBRs live with operations and are not on the owner’s calendar.
Data standards become non-negotiable at four-plus facilities. Every facility reports the same 8 to 10 KPIs in the same format on the same cadence.
Facility A tracking admits by lead source and Facility B tracking admits by referral partner makes cross-facility comparison impossible, and the regional QBR degenerates into arguing about definitions instead of making decisions.
The most common multi-location QBR failure I see is inconsistent measurement across facilities. Standardize the KPI spine before the third facility comes online, or the QBR structure will not scale past three sites without breaking.
How a Tennessee treatment center tripled its paid media close rate and cut missed calls to 1%
Full CRM configuration, system integrations, and call tracking metrics unified a fragmented admissions process into a single high-converting workflow in two months.
Read the case study →Up from 17% — missed calls cut from 15% to 1%
What a Webserv Engagement Looks Like
The Webserv Admission Ops engagement runs the joint operating rhythm as a core part of the ongoing retainer.
Weekly reporting. Dashboard access plus a 5-line email covering admits, viable-VOB rate, cost per admit, missed-call rate, and any interventions. Data hand-off, not a meeting.
Monthly strategic review. 60-minute working session. Pipeline health by source, upcoming initiatives, platform policy or compliance changes, interventions from the reporting. Marketing team plus admissions team plus operational leader.
Quarterly business review. 90-minute leadership session with the seven-part agenda above. CFO or COO plus Director of Marketing plus Director of Admissions plus Webserv account lead. Roll up the quarter, reset the next.
Pricing. One-time setup runs $7,500 to $15,000 depending on center size, CRM complexity, and integration scope. The joint operating rhythm is included in every engagement.
Ongoing retainer tiers by location count: $3,500 to $5,000 per month for 1-2 locations, $5,000 to $8,000 per month for 3-5 locations, $8,000 to $15,000 per month for 6+ locations.
The Fast-Track Diagnostic is the low-friction entry: $3,000, credited 100 percent toward month one if the facility moves forward. Two-week audit of the current reporting cadence, gap map, and firm proposal.
The bias in the rhythm is toward decision speed. Weekly reporting catches leaks. Monthly reviews course-correct. QBRs reset targets. Every cadence produces action. Facilities that adopt this rhythm typically see the reconciliation gap between marketing reports and admissions reports close inside 60 days.
Most in-house teams hit a wall not because they lack knowledge, but because they lack bandwidth.
When you are ready to hand it off, Webserv has spent 9 years executing exactly this for treatment centers nationwide.
Frequently Asked Questions
What is a marketing-to-admissions QBR?
A marketing-to-admissions QBR is a 90-minute quarterly leadership review that evaluates marketing performance against admissions outcomes, not against marketing vanity metrics. The QBR reports admits by source, cost per admit, viable-VOB rate, coordinator close rate by source, discharge outcome by source, and payer mix by source.
The distinction from a marketing QBR is that the admissions team is in the room, the reporting closes the loop from ad spend to admit, and every decision the QBR produces gets evaluated on its contribution to admits. Marketing that never touches admissions is optimizing the wrong number.
Any QBR without the CFO or COO in the room is a status update, not a business review. Any QBR that ends in 30 minutes is not scoped. The right cadence takes 90 minutes and produces target changes, budget shifts, or initiative decisions every quarter.
What metrics belong in a treatment center marketing QBR?
Six metrics. Admits by source. Cost per admit. Viable-VOB rate. Coordinator close rate by source. Discharge outcome by source. Payer mix by source. Marketing reports that skip any of these six are optimizing the wrong number.
The six metrics answer the questions leadership actually asks. Which channels produced admits. Which admits completed treatment. Which admits carried which payer mix. What did marketing spend produce in reimbursement per admit. What is the plan for next quarter.
Impressions, clicks, cost per click, cost per lead, and landing page conversion rate all matter operationally. None of them belong in a QBR. They belong in the monthly strategic review one cadence upstream.
How often should marketing and admissions teams meet?
Three cadences. Weekly reporting as a data hand-off (dashboard access plus a short email). Monthly strategic review as a 60-minute working session. Quarterly business review as a 90-minute leadership session.
Weekly reporting should not be a meeting. If the team is meeting weekly, the cadence is wrong. Weekly is where the data flows without needing conversation. Anomalies get flagged. Real interventions wait until the monthly review.
Monthly strategic review is where marketing and admissions sit in the same room. Pipeline health, upcoming initiatives, compliance changes, interventions the weekly reporting surfaced. Decisions get made. Course corrections happen.
Who should attend the QBR?
CFO or COO of the facility. Director of Marketing. Director of Admissions. Primary agency lead. That is the core group. Any QBR without the CFO or COO is not a business review because nobody in the room can commit to budget or target changes.
Additional attendees depending on quarter. Head of Clinical if admit quality or discharge outcome is under review. Head of RCM if payer mix or reimbursement is under review. Ownership if the quarter’s performance is materially off plan.
Do not add optional attendees. QBRs run tight when the attendee list matches the decisions the meeting will produce. Adding stakeholders who cannot commit turns the QBR into a status update.
How do I run a QBR if I do not have admissions data in my CRM?
The first task is fixing the CRM before running a QBR that means anything. A CRM that does not track admits by source, cost per admit, viable-VOB rate, coordinator close rate, and payer mix cannot feed a real QBR.
The reconfiguration typically takes 4-6 weeks. Pipeline stages, automations, field mapping, integration with call tracking and EMR. The admissions operations hub is where the CRM configuration lives.
Facilities running QBRs off ad platform data alone (Google Ads reports, Meta reports) are running the wrong QBR. The reporting has to close the loop to admits. If the CRM does not close the loop, the CRM is the constraint, not the QBR.
What is the difference between a monthly review and a QBR?
The monthly review is a 60-minute working session covering four topics: pipeline health by source, upcoming initiatives, platform policy or compliance changes, and interventions the weekly reporting surfaced. It is a working session where marketing and admissions coordinate.
The QBR is a 90-minute leadership session covering the seven-part agenda: quarter-in-review, source-level performance, discharge outcome by source, payer mix by source, interventions and lessons, next quarter plan, and open questions. It is a leadership session where the CFO or COO reset targets and budgets.
The monthly review is tactical. The QBR is strategic. Collapsing them into one meeting misses the point of both. The right facilities run all three cadences (weekly reporting, monthly review, QBR) at their proper depth.
How does Webserv structure the QBR for its clients?
Webserv runs the joint operating rhythm as part of the ongoing Admission Ops retainer. Weekly dashboards plus a 5-line email. Monthly 60-minute strategic reviews. Quarterly 90-minute business reviews with the seven-part agenda.
The agency lead attends every cadence. The Webserv team also sits inside admissions coordinator huddles at least monthly, which is what makes the marketing-to-admissions integration work. Marketing that never touches admissions is optimizing the wrong number, and the huddle attendance is how Webserv keeps its work routed to admits.
Facilities that want to see the rhythm before committing to a full engagement can start with the $3,000 Fast-Track Diagnostic. The diagnostic includes a review of the current reporting cadence and a firm proposal for what the joint operating rhythm would look like at the facility.
Who should actually attend the QBR?
Owner, marketing director or CMO, admissions director, and one financial voice. That is 4 to 5 people in the room. Any more and the QBR turns into a status meeting instead of a decision meeting.
Coordinators, referral partner reps, and vendor account managers should not attend the QBR. Coordinator issues belong in the weekly stand-up. Vendor discussions belong in dedicated review meetings. Referral partner conversations happen in the partner check-in cadence.
The tell that the QBR attendee list is too large is when nobody speaks except when specifically called on. That is a briefing, not a QBR.
How long should the QBR actually run?
90 minutes for a single-facility operation. Two hours for multi-facility of 2 to 3 sites. Half a day for 4 or more facility operations that also cover regional strategy. Anything longer and the room burns out before the decisions get made.
The most common time trap is spending 60 minutes on Q3 recap and 15 minutes on Q4 planning. Reverse it. 30 minutes on what happened, 60 minutes on what you are going to do about it. The forward-looking half is where the QBR earns its keep.
Book the meeting with 15 minutes of buffer at the end. Every good QBR generates two or three decisions that need immediate follow-up assignments. That buffer is when the assignments happen.
Should the marketing agency be in the room during the QBR?
If the agency is Webserv, yes. If the agency is a purely tactical execution shop, no.
The QBR is a strategic decision-making meeting. Agencies equipped to participate strategically (own the attribution and reporting layer, understand the admissions economics, can defend channel-level ROI) belong in the room. Agencies that are booked to execute campaigns do not add value in a strategic meeting.
Ask the agency: “Can you tell me what our cost per admit was last quarter and what changed?” If they can answer, they belong in the QBR. If they cannot, they belong in a separate campaign review meeting.
What happens if a stakeholder does not like the numbers?
Numbers do not like or dislike stakeholders back. If a stakeholder consistently argues with the numbers rather than acting on them, the problem is not the reporting. It is the accountability structure above the reporting.
The most common failure mode is the owner rejecting numbers because they contradict a story the owner is committed to, usually about which channel or referral partner is working. The QBR facilitator’s job is to keep pointing back to the data, not to relitigate the source of the data mid-meeting.
If this becomes a pattern, escalate to the owner in a 1:1 outside the QBR. Either the data is wrong (in which case fix the data), or the story is wrong (in which case fix the story). QBRs do not work when either side refuses to update.
Closing Note From the Admission Ops Floor
The QBR is not a marketing meeting. It is a business review that happens to include marketing. The distinction is what separates facilities that use QBRs to grow admits from facilities that use QBRs to hear about clicks.
Every marketing agency your facility works with should be held to the seven-part agenda above. Every one of them should be able to produce the six metrics above on demand. Any agency that cannot is optimizing the wrong number.
If you want the Webserv team to build or rebuild the joint operating rhythm at your facility, start with the $3,000 Fast-Track Diagnostic. Credited 100 percent toward month one if you engage.
Jim Malcom is the Director of Admission Ops at Webserv. He has spent his career inside behavioral health admissions operations (call floors, VOBs, CRMs, and the reporting stack that ties them together) and now leads the Webserv admission ops practice for treatment center operators nationwide.