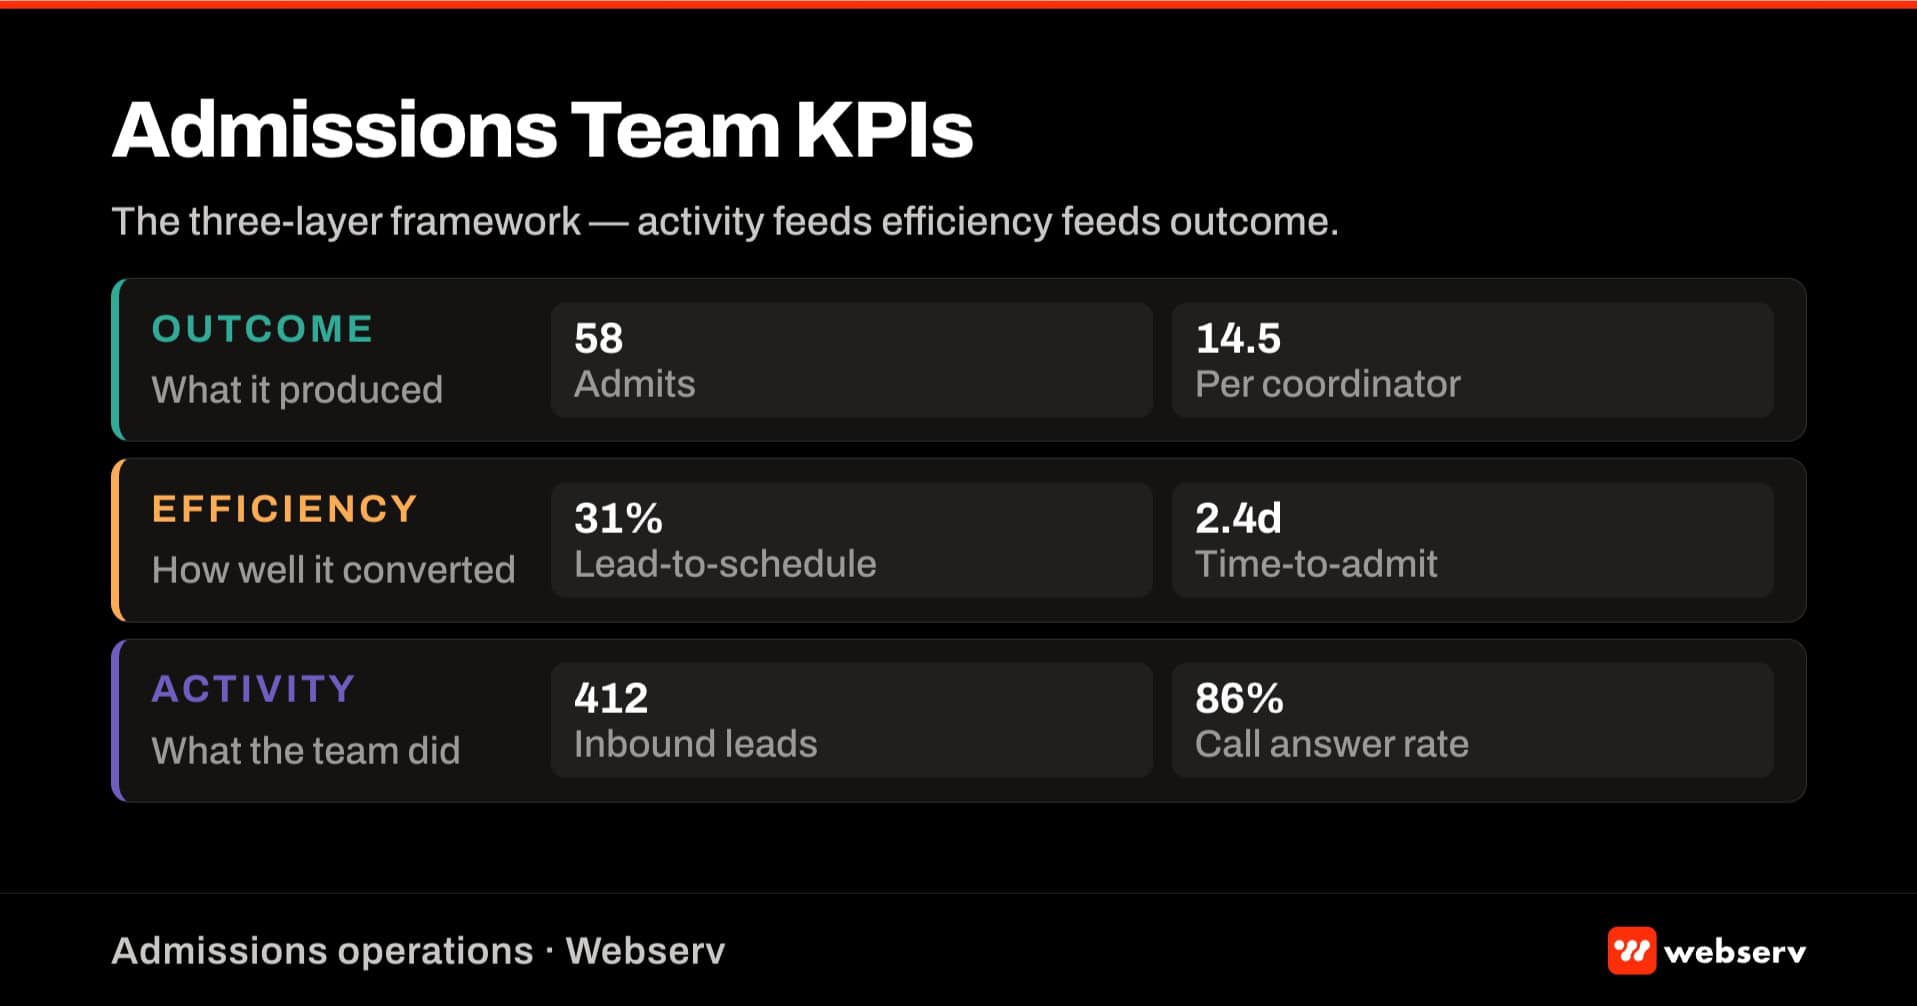
Most treatment center admissions teams get measured on one metric. Admit volume. The number of patients that scheduled and completed an admission last month.
That metric is directionally useful and structurally incomplete. Raw admit volume tells you what the outcome was. It does not tell you whether the admissions team ran a tight process to produce that outcome, or whether the marketing engine feeding the team was producing enough qualified leads to make the outcome possible.
It also fails to surface where the funnel breakage is if the number came in soft. When ownership sees admit volume drop 15 percent, the reflex is to lean on the admissions team. The correct diagnosis requires a full KPI stack that separates activity from efficiency from outcome, and this piece walks the framework we run for that inside our admissions operations and billing playbook.
This piece walks the admissions ops KPI framework we run with the treatment centers in our client book. It is the admissions-side companion to the marketing KPI benchmark set that measures the funnel from the marketing perspective.
Where marketing owns the inputs (spend, leads, channel conversion), admissions owns the middle of the funnel (VOB, scheduling, conversion to admit). That middle-of-funnel is the load-bearing conversion event that determines whether marketing spend produces admits, and it is the layer most treatment centers under-measure.
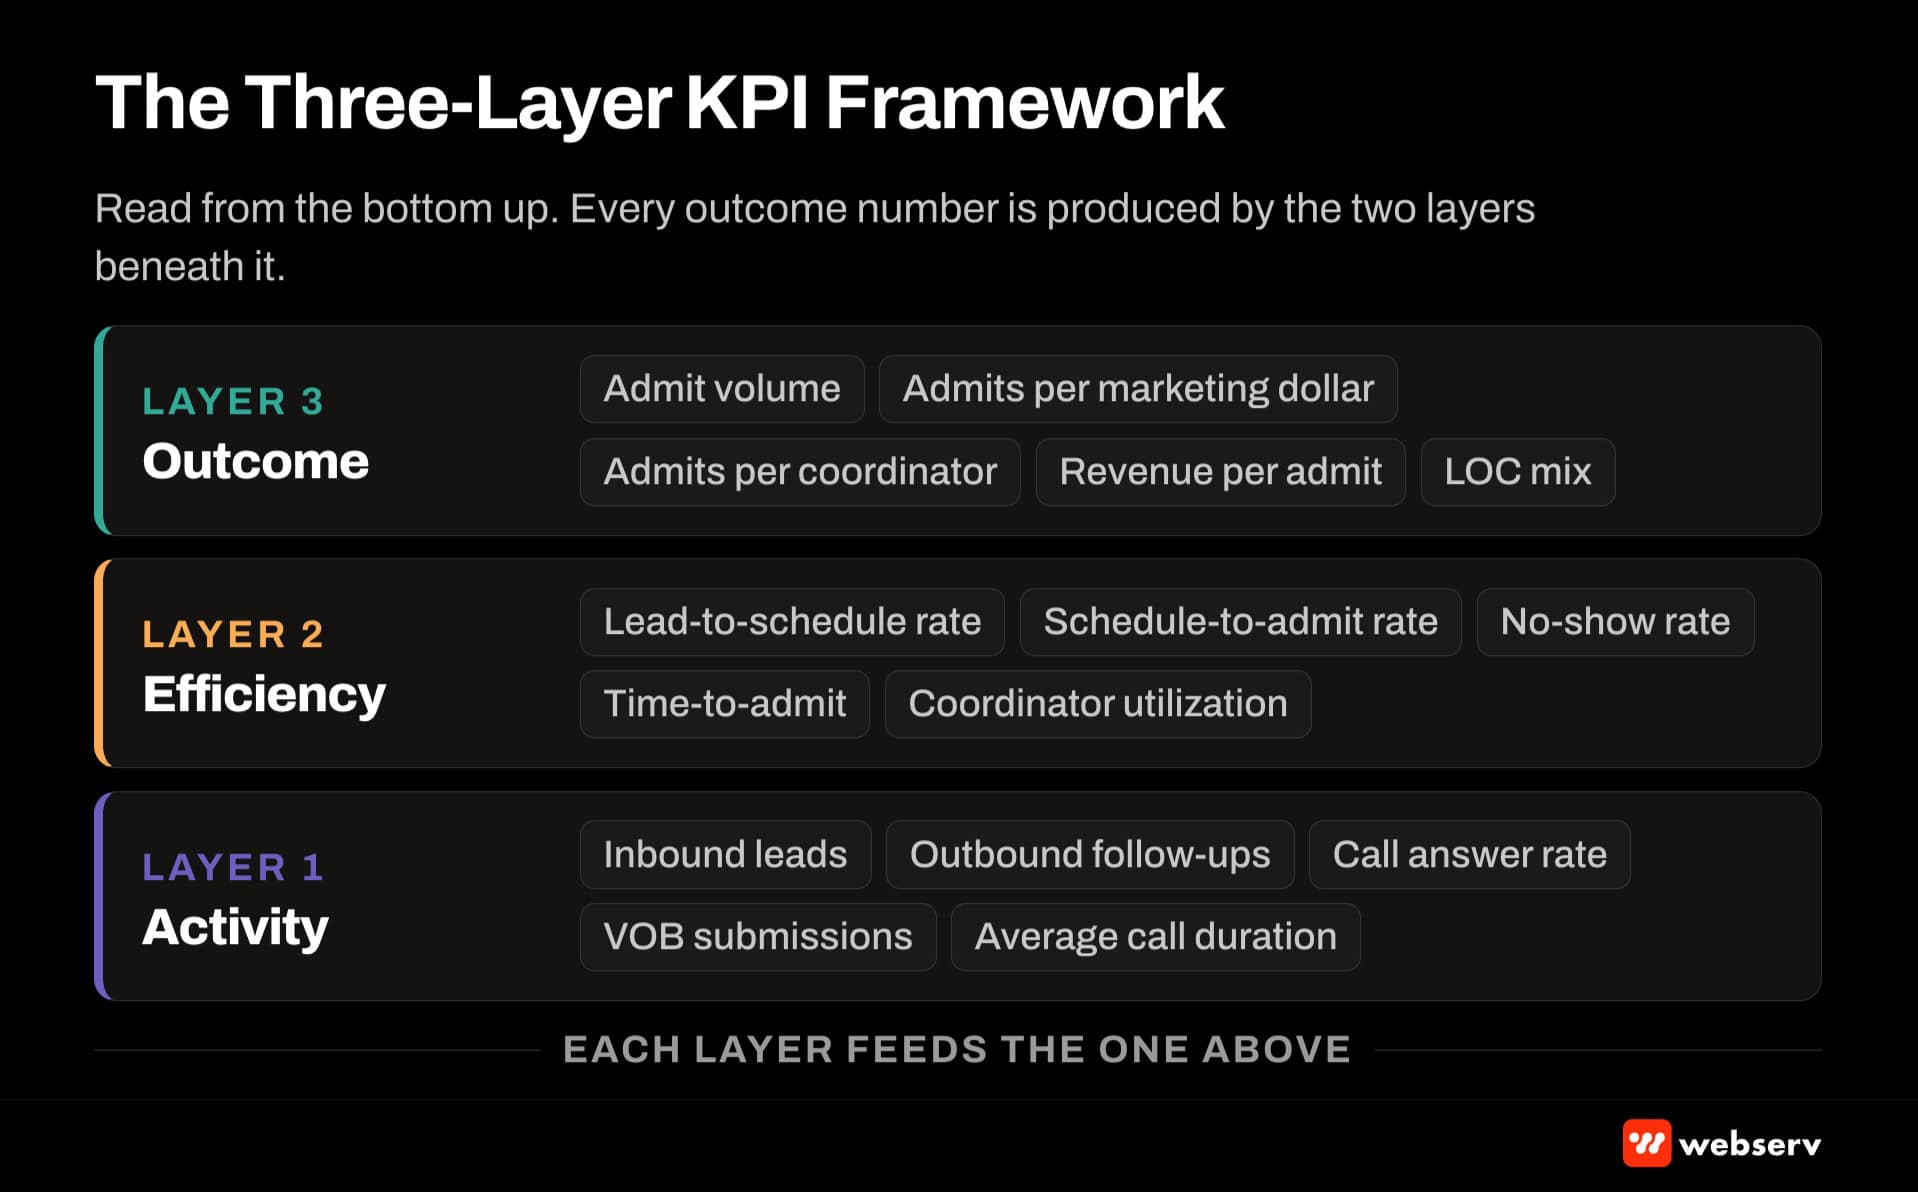
The framework has three layers, ten specific KPIs, and defensible benchmark ranges at each layer. Those ranges account for the facility mix (level of care, payer mix, geography, program scale) that determines where within each range a given operator lands.
It also has a specific reporting cadence that ties into the admissions ops discipline our client book runs on. It integrates cleanly with the marketing-side reporting at the QBR review.
Key Takeaways
- Admit volume alone is directionally useful and structurally incomplete as an admissions team performance metric. Defensible reporting separates activity metrics (calls answered, VOBs completed) from efficiency metrics (time-to-VOB, lead-to-admit conversion) from outcome metrics (contribution margin per admit).
- The three-layer framework covers ten specific KPIs. Layer 1 activity: call answer rate, VOB completion rate, intake conversation completion rate. Layer 2 efficiency: time-to-VOB, time-to-admit, lead-to-admit conversion, coordinator productivity ratio. Layer 3 outcomes: admits per coordinator per month, contribution margin per admit, admits by referral source.
- The single most under-measured admissions KPI is contribution margin per admit at the coordinator level. Coordinators measured on raw admit volume optimize for whoever is easiest to admit. Coordinators measured on contribution margin per admit optimize for the admits that actually improve the operator’s P&L.
- Benchmark ranges are wide because facility mix determines where within each range a given operator lands. Same benchmarks do not apply to residential SUD as apply to outpatient PHP or IOP. Same benchmarks do not apply to OON-heavy operators as apply to Medi-Cal-heavy operators.
- The right reporting cadence is weekly at the coordinator layer, monthly at the team layer, and quarterly at the strategic layer tied to the QBR. Skipping any cadence produces optimization gaps at the corresponding decision layer.
DEFINITION
Admissions team KPI. A defined metric that measures the admissions team’s contribution to the treatment center funnel, from lead handoff through completed admit. Organizes into three layers: activity (what the team is doing), efficiency (how well the workflow converts activity to admits), and outcomes (whether the admits produced improved the operator’s P&L).
Distinct from admit volume alone (directionally useful but hides the funnel layer where breakage actually happens). Distinct from marketing KPIs (which measure the top-of-funnel inputs). The admissions team owns the middle-of-funnel conversion event — VOB completion through scheduled admit — that determines whether marketing spend produces admissions outcomes.
Why Admissions Team KPIs Matter More Than Most Operators Realize
Admissions team performance is the load-bearing conversion event in the treatment center funnel. Marketing produces leads. Admissions converts them into scheduled admits. If the admissions team drops leads, delays VOBs, or fails to schedule cleanly, marketing spend produces nothing regardless of how well the top of the funnel is running.
The gap I see most often is that operators measure marketing performance in detail (channel spend, CPL, landing page conversion) and measure admissions performance in aggregate (monthly admit volume). The imbalance produces two failure modes.
Marketing looks efficient when the pipeline is being wasted at the admissions layer. Admissions looks weak when the marketing pipeline is producing low-intent leads that no team could convert.
The fix is a symmetric KPI framework that measures the admissions team’s contribution to the funnel at the same resolution as the marketing team’s. Ten KPIs across three layers, reported at the right cadence. That gets tied to the marketing and admissions QBR playbook so both functions get evaluated against the same operating reality.
The Three-Layer KPI Framework
Layer 1: Activity metrics
Activity metrics measure what the admissions team is doing. They answer the question of whether the team has enough capacity for the lead volume, whether the workflow is producing the required throughput, and whether coordinator staffing is sized correctly. Three specific KPIs at this layer.
Call answer rate. The percentage of inbound admissions inquiries answered live (versus voicemail or hold-abandoned). High-performing admissions teams answer 90 to 95 percent of inbound calls live during business hours and 75 to 90 percent live during off-hours with a defined after-hours protocol. Below 80 percent business-hours answer rate is a specific staffing or workflow problem.
VOB completion rate. The percentage of qualified leads where the admissions team successfully verifies insurance coverage before the intake conversation resolves. High-performing teams complete VOB on 85 to 95 percent of inbound leads within the first business day. Under 70 percent typically indicates understaffed intake, missing VOB automation, or workflow gaps that no marketing spend can fix.
Intake conversation completion rate. The percentage of qualified leads that reach a complete intake conversation (versus dropping after the initial call, not returning voicemails, or ghosting on the callback). Ranges from 60 to 85 percent depending on population, LOC mix, and callback discipline.
Layer 2: Efficiency metrics
Efficiency metrics measure how well the admissions workflow converts activity into scheduled admits. They answer the question of where the funnel is breaking and which specific process improvements would move the numbers. Four specific KPIs at this layer.
Time-to-VOB. The average hours or days between initial inquiry and completed VOB. High-performing residential SUD teams complete VOB within 4 to 24 hours of inquiry. Outpatient teams often run 2 to 12 hours because the intake motion is compressed. Facilities running more than 48 hours to VOB systematically lose inquiries to competitors that respond faster.
Time-to-admit. The average days between initial inquiry and scheduled admit day. For residential SUD, well-run teams run 3 to 10 days. For outpatient, 1 to 7 days. Shorter time-to-admit correlates strongly with higher lead-to-admit conversion because BH inquiries lose intent quickly.
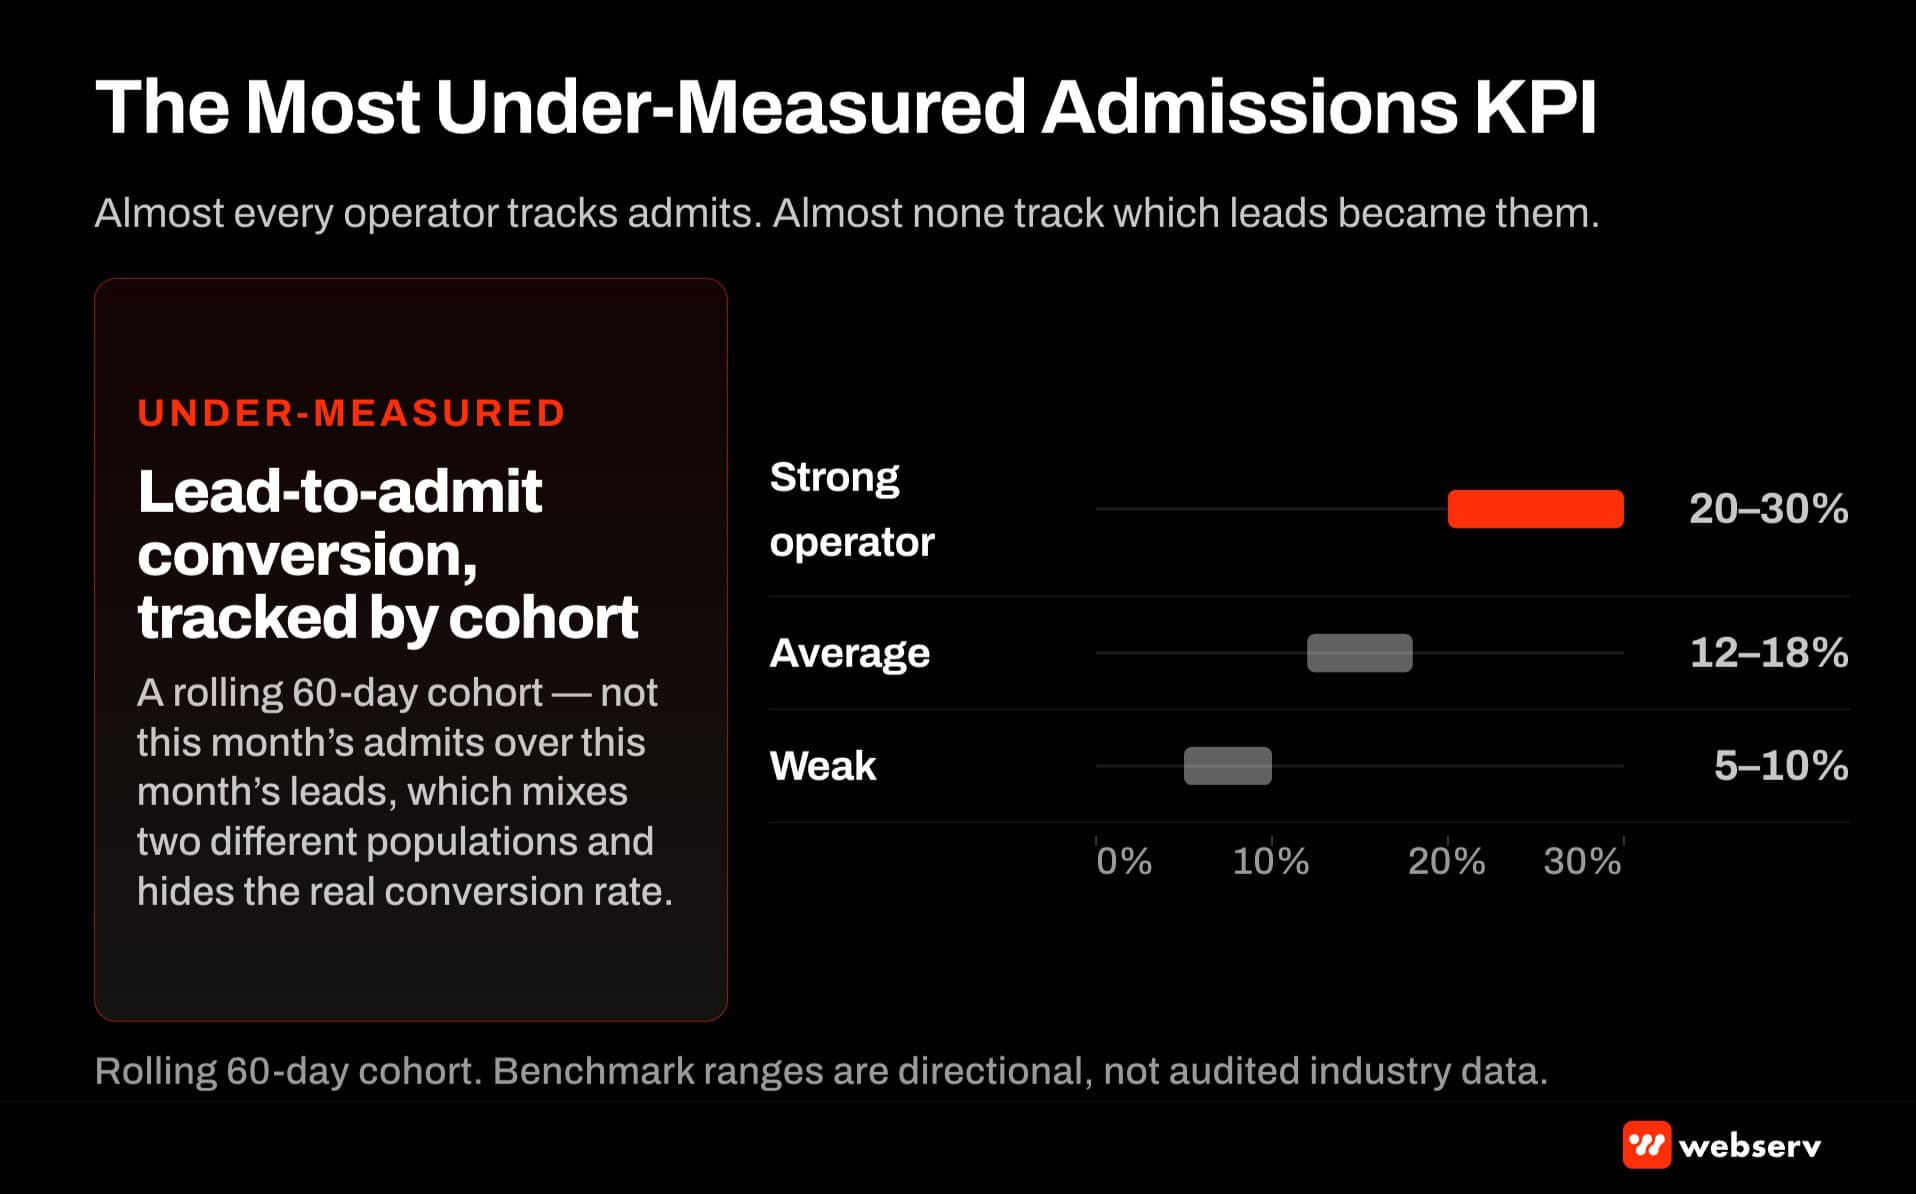
Lead-to-admit conversion rate. The percentage of qualified leads that ultimately schedule and complete an admission. Ranges from 8 to 25 percent depending on facility mix, lead source quality, and admissions team execution. High-performing residential operators push toward 20 to 25 percent on high-intent inbound; outpatient often runs lower because the commitment threshold is different.
Coordinator productivity ratio. The average admits produced per coordinator per month. High-performing coordinators in residential SUD produce 6 to 12 admits per month per coordinator. Outpatient coordinators can run higher because the intake motion is faster. Small facilities often run lower because coordinators carry case-management and family-liaison responsibilities alongside intake.
Layer 3: Outcome metrics
Outcome metrics measure whether the admissions team actually contributed to the operator’s P&L. They answer the question of whether the admits produced were profitable, which sources produced them, and whether the admissions team’s mix is improving the aggregate. Three specific KPIs at this layer.
Admits per coordinator per month. Overlaps with coordinator productivity ratio but reported at the individual coordinator level for performance management. High-performing coordinators sustain 6 to 12 admits per month over quarters. Sudden drops surface issues that need investigation.
Contribution margin per admit. The average revenue per admit minus the cost of delivering care on the admit (clinical staff, facility costs, allocated overhead) minus the marketing acquisition cost, at the coordinator level. This is the KPI that separates high-volume coordinators from high-value coordinators.
Admits by referral source. The distribution of admit volume across referral sources (paid search, organic, referral partners, alumni, hospital discharges, EAPs, walk-ins). Reported monthly at the admissions team level, this KPI is the diagnostic entry point when the aggregate mix shifts.
Admissions team benchmark ranges at high-performing BH treatment centers
90-95%
Business-hours call answer rate at well-run BH admissions teams
85-95%
VOB completion rate within first business day of inquiry
8-25%
Lead-to-admit conversion rate range across facility mix
6-12/mo
Coordinator productivity range (admits per coordinator per month)
The Most Under-Measured Admissions KPI
Of the ten KPIs above, the most consistently under-measured across the treatment centers we work with is contribution margin per admit at the coordinator level.
The reason is structural. Contribution margin per admit requires the admissions team to have visibility into per-case reimbursement data, and per-case reimbursement lives in the billing system 60 to 90 days after the admit. Most facilities do not close this loop between admissions and billing, so coordinator performance gets measured on raw admit volume alone.
The gap this produces is that coordinators optimize for whoever is easiest to admit rather than for the admits that produce the best economics. Two coordinators producing identical monthly admit counts can produce materially different contribution margin. One coordinator closes primarily on high-yielding plans while the other closes primarily on low-yielding plans. Raw volume treats them as equal performers. Contribution margin per admit surfaces the difference.
Fixing the gap requires the CFO or controller to publish per-admit reimbursement data back to the admissions director on a monthly cadence. The admissions director then reweights coordinator performance reporting from raw admit volume to contribution margin per admit.
Once this loop closes, coordinator coaching conversations shift from admit volume to admit quality. Payer strategy conversations at the QBR gain a coordinator-level diagnostic layer they did not have before.
OPERATOR INSIGHT
Two coordinators producing identical monthly admit counts can produce materially different contribution margin. One closes primarily on high-yielding plans while the other closes primarily on low-yielding plans.
Raw volume treats them as equal performers. Contribution margin per admit surfaces the difference. Fixing the gap requires the CFO or controller to publish per-admit reimbursement data back to the admissions director on a monthly cadence, and the admissions director to reweight coordinator performance reporting from raw admit volume to contribution margin per admit. Once this loop closes, coordinator coaching conversations shift from admit volume to admit quality.
Facility Mix Factors That Determine Where You Land
Benchmark ranges are wide because facility mix shifts where a given operator sits within each range. Four factors matter most for admissions team KPIs specifically.
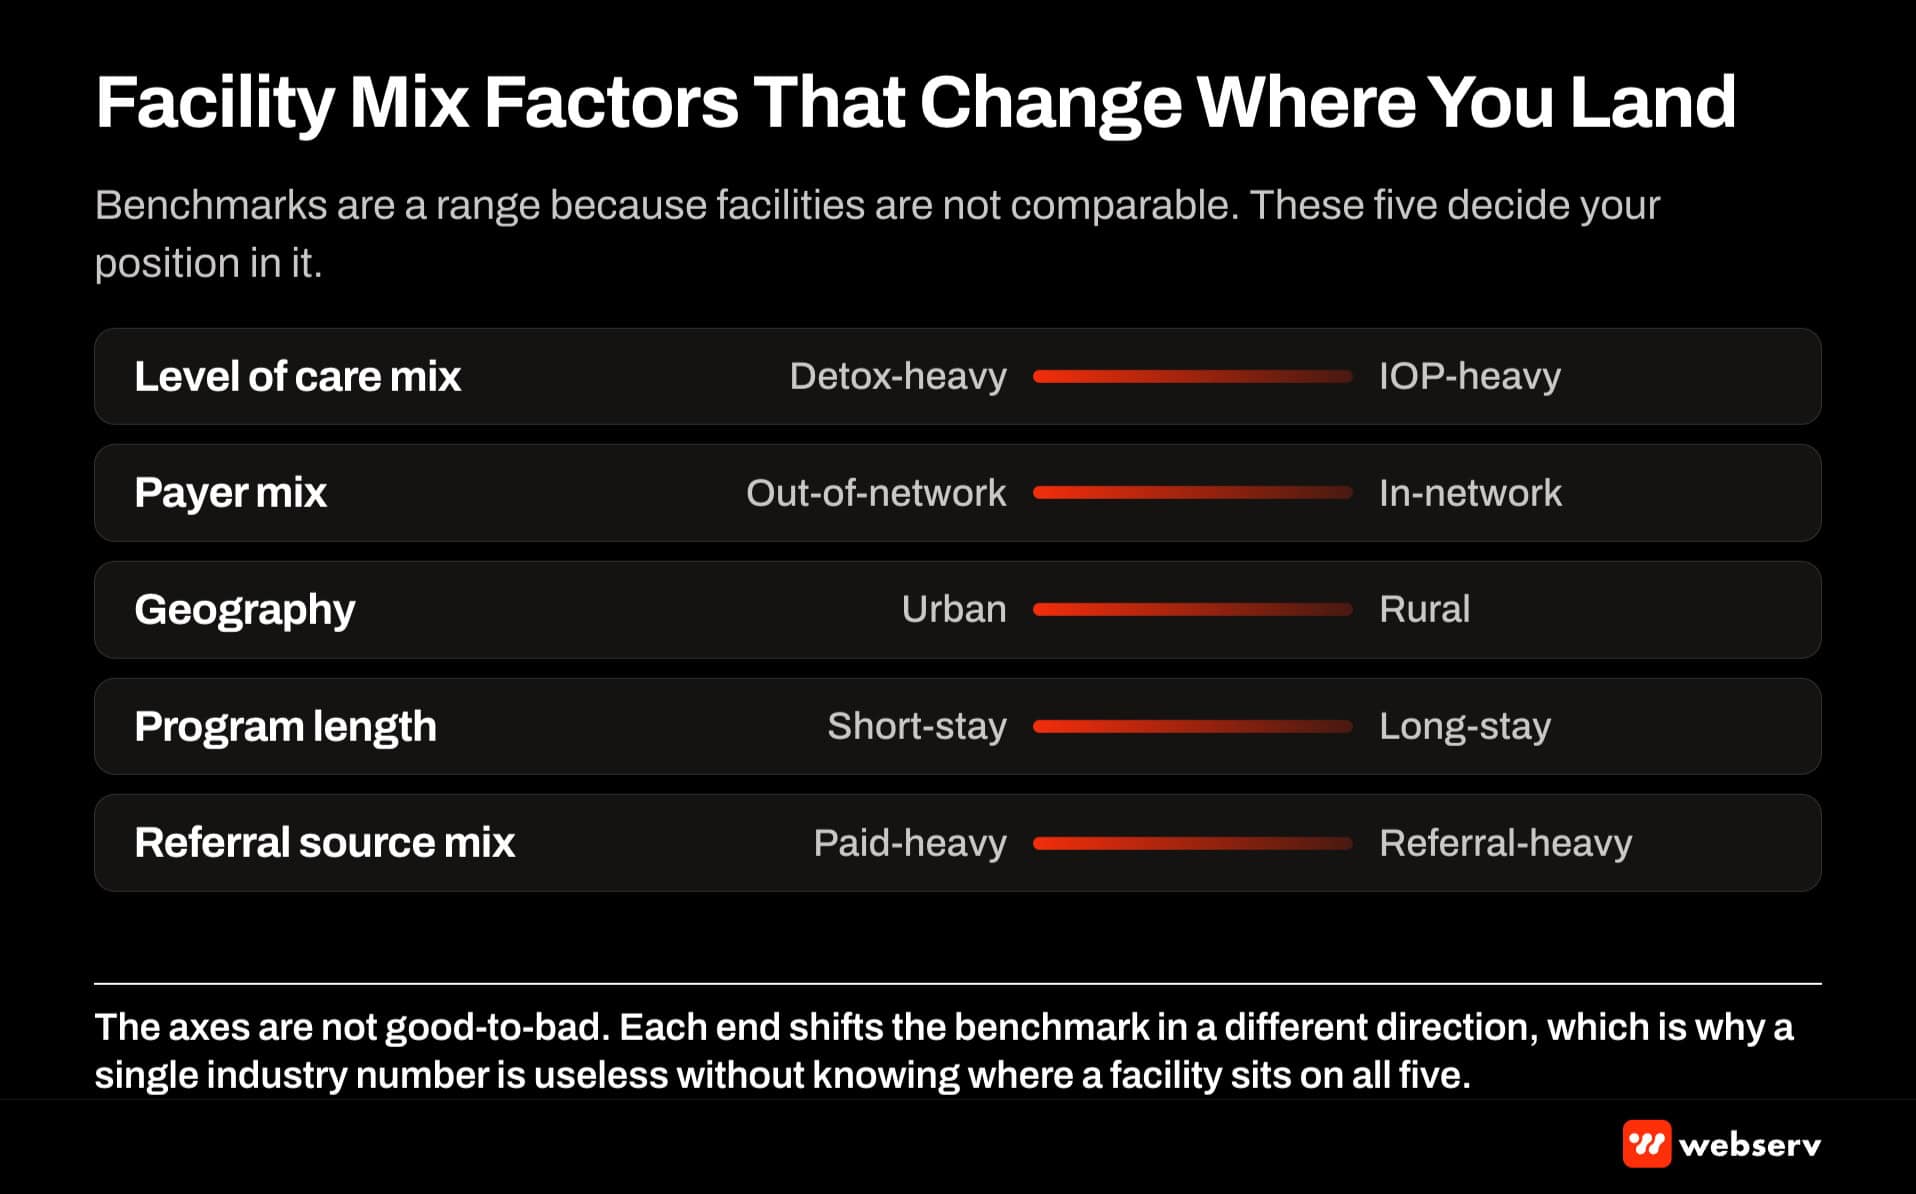
Level-of-care mix. Residential SUD operators typically see longer time-to-admit and higher time-to-VOB than outpatient operators because the clinical assessment and coordination overhead is larger. Detox operators see the shortest time-to-admit because the clinical urgency drives immediate scheduling.
Payer mix. OON-heavy operators run higher lead-to-admit conversion rates than in-network-heavy operators because the OON funnel tends to be higher-intent (families that have specifically sought out-of-network care versus families routing through in-network directory). OON also runs higher time-to-VOB because the coverage verification is more involved.
Program scale. Small facilities (single-location, up to 30 beds) typically run coordinator productivity ratios at the lower end of the range because the coordinator often carries case management and family-liaison responsibilities alongside intake. Larger facilities with dedicated coordinator roles run at the top of the range.
Referral source mix. Facilities with heavy referral-partner and interventionist mix run higher lead-to-admit conversion than facilities with heavy paid-media mix, because referral partners deliver higher-intent leads. Applying benchmarks that assume paid-media mix to a referral-heavy facility overstates weakness; applying referral-heavy benchmarks to a paid-media facility understates progress.
Understanding your specific mix on all four factors is the prerequisite to interpreting where within the benchmark ranges your numbers should land.
Coordinator-Level vs. Team-Level Reporting
Coordinator-level KPIs are diagnostic and performance-management tools. Team-level KPIs are strategic and reporting tools. Both are necessary and they serve different audiences.
The coordinator-level KPIs the admissions director reviews weekly are call answer rate, VOB completion rate, time-to-VOB, lead-to-admit conversion by coordinator, admits per coordinator per month, and (when the loop is closed) contribution margin per admit by coordinator. These surface individual coaching opportunities and workflow adjustments.
The team-level KPIs the executive team reviews monthly and quarterly are aggregate admit volume, aggregate lead-to-admit conversion, time-to-admit average, admits by referral source, and contribution margin per admit at the team level. These surface strategic questions about capacity, staffing, source mix, and payer strategy.
Confusing the two produces predictable problems. Executive teams reviewing coordinator-level performance in QBR settings pressure the admissions director on individual coaching that should happen weekly, not quarterly. Admissions directors coaching coordinators on team-level metrics like “increase admits by referral source” produce confusion because the coordinator has limited control over source distribution.
Common Failure Modes
Four patterns show up repeatedly at treatment centers trying to measure admissions team performance.
The first is measuring only admit volume. Facilities that report admit volume alone at the monthly team meeting have no diagnostic when the number moves. Volume-only reporting produces the “lean on the admissions team when the number drops” reflex that misdiagnoses systemic issues as individual performance issues.
The second is measuring activity without efficiency. Facilities that report call answer rate and VOB completion rate but not time-to-VOB and lead-to-admit conversion can look like they are running a tight operation while the actual conversion is degrading.
The third is measuring raw admit volume without contribution margin. Coordinators optimized on raw admit volume close whoever is easiest to admit, which systematically biases the admit mix toward lower-yielding plans over time. The margin conversation is the one that keeps the mix healthy.
The fourth is treating admissions team reporting as separate from marketing team reporting. Facilities that run marketing performance conversations and admissions performance conversations in isolation miss the middle-of-funnel diagnostics that determine whether specific channels or campaigns are actually working. Our admissions process complete guide and QBR playbook cover the integrated reporting cadence in depth.
DO
- Measure across all three layers — activity, efficiency, outcome — every reporting cycle.
- Report coordinator-level KPIs weekly for coaching, team-level KPIs monthly and quarterly for strategy.
- Configure the CRM fields (initial inquiry, VOB completion, admit scheduled/actual, source) before running the framework.
- Close the admissions-to-billing loop so contribution margin per admit lands at the coordinator level.
- Interpret benchmark ranges against your specific LOC, payer mix, program scale, and referral source mix.
DON’T
- Report admit volume alone at the monthly team meeting — leaves no diagnostic when the number moves.
- Measure activity metrics without efficiency metrics — a tight-looking team can still convert badly.
- Optimize coordinators on raw admit volume without contribution margin — biases the mix toward low-yield admits.
- Run admissions reporting in isolation from marketing reporting — misses middle-of-funnel diagnostics.
- Treat every bad month at a coordinator level as a coordinator performance problem (or a system problem).
The Reporting Cadence
Weekly reporting handles the coordinator layer. Admissions director reviews coordinator activity metrics, VOB throughput, escalations, and any specific coaching opportunities. Adjustments happen at the coordinator and workflow level within the week.
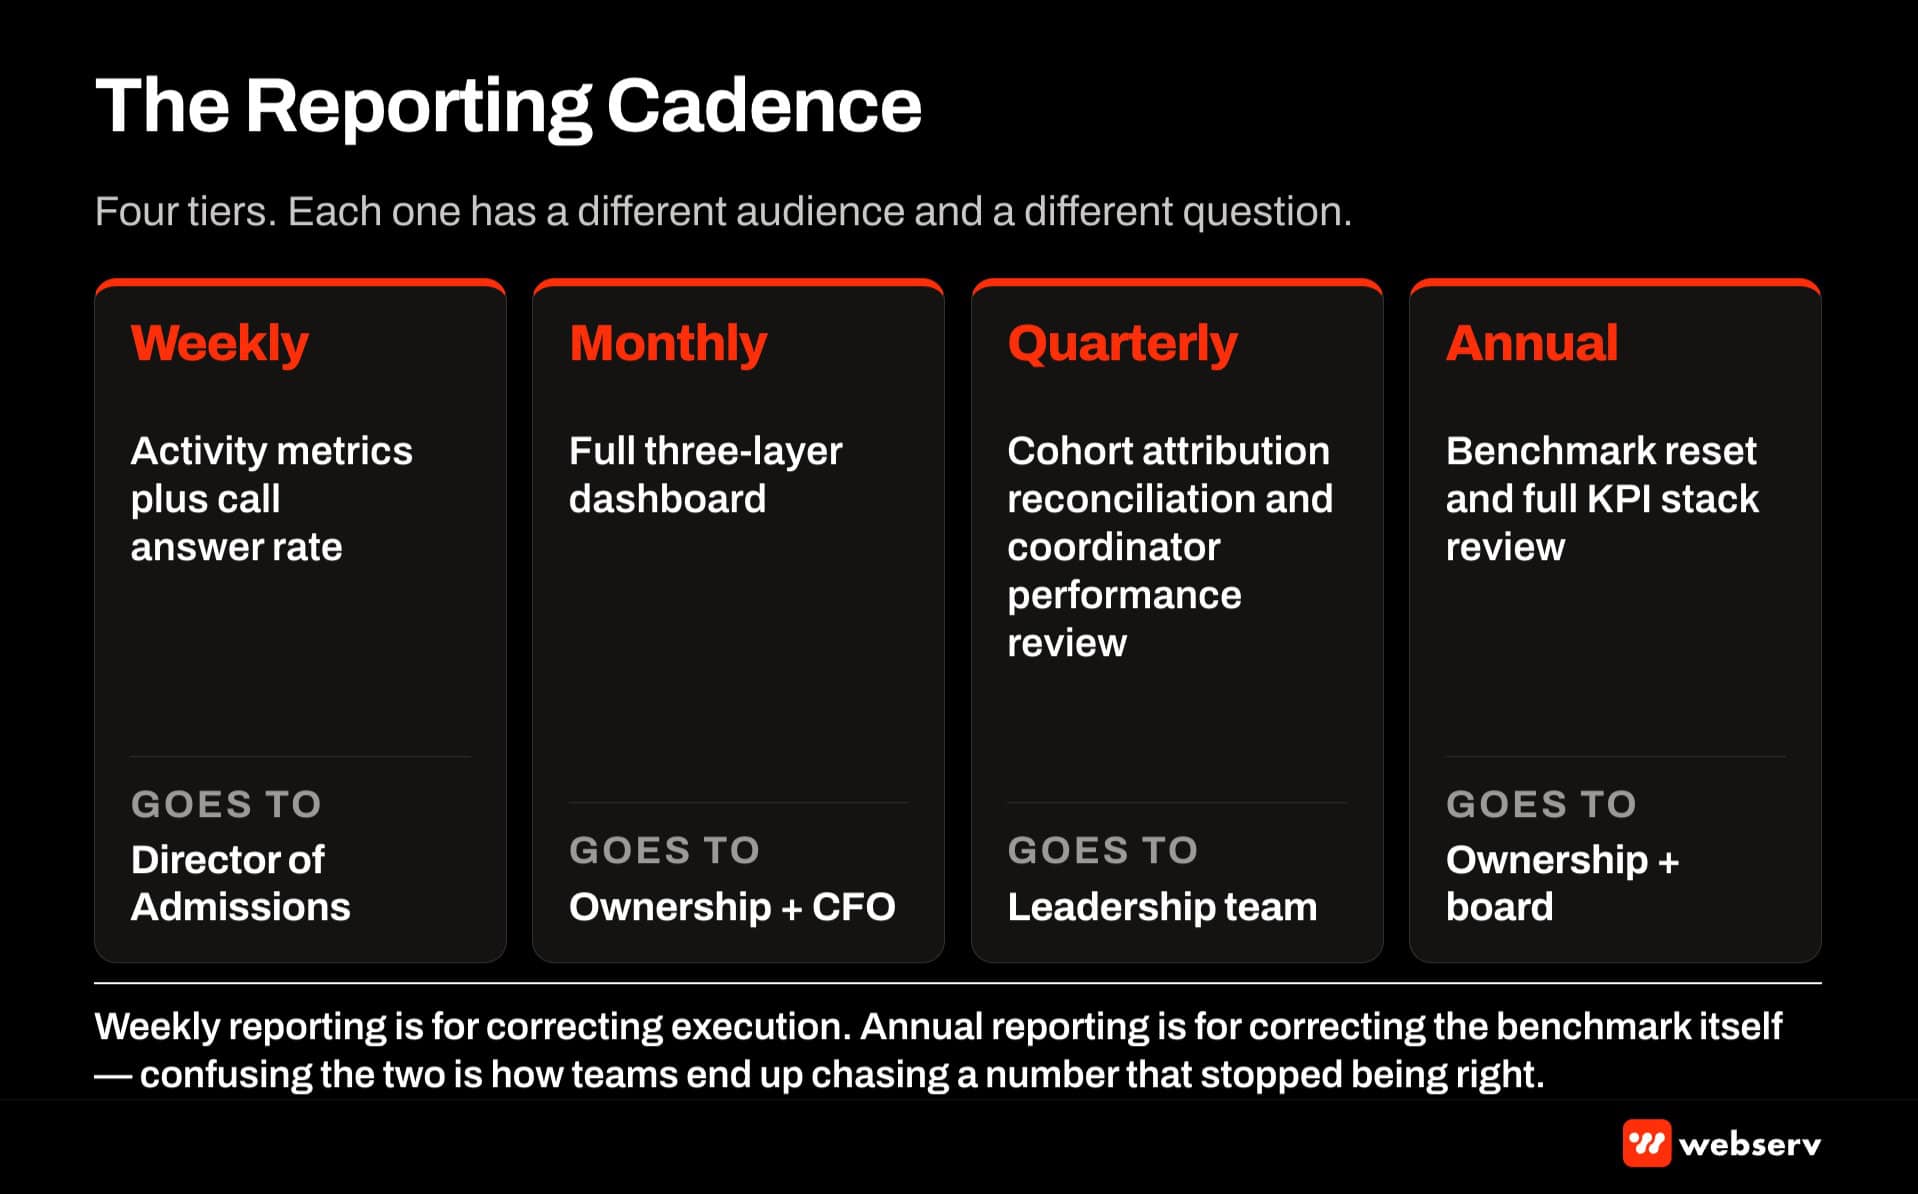
Monthly reporting handles the team layer. Admissions director and admissions leadership review aggregate conversion rates, admits by source, coordinator productivity distribution, and month-over-month trends. Adjustments happen at the team level (workflow redesign, staffing shifts, source-mix balance).
Quarterly reporting handles the strategic layer. The full team (admissions director, CMO, marketing director, CFO, ownership) reviews contribution margin per admit, payer mix quality, admissions team investment ROI, and the specific strategic decisions the operator is running against the data. This is the QBR review where marketing performance and admissions performance connect into one operating conversation.
Skipping any cadence produces optimization gaps at the corresponding decision layer.
Frequently Asked Questions
What is the single most important admissions KPI to track first?
If you have to start with one metric, track lead-to-admit conversion rate at the aggregate team level. This metric captures whether the admissions team is converting the leads marketing produces at a defensible rate, and it correlates strongly with the team’s contribution to the funnel more than any other single metric.
The specific benchmark: high-performing residential operators run 20 to 25 percent, outpatient operators run 12 to 20 percent, mixed operators typically land in the 10 to 18 percent range. Below 8 percent is a specific structural problem that a proper KPI framework will surface.
Once lead-to-admit conversion is being tracked defensibly at the team level, add time-to-VOB and VOB completion rate as the next two metrics, then build out the full framework over the next 60 to 90 days.
How do we track admissions KPIs if our CRM does not support the required fields?
Most BH-native CRMs (Kipu, Sunwave, BestNotes, Alleva) support the required fields natively or through custom field configuration. General-purpose CRMs (Salesforce, HubSpot) require more configuration work but produce equivalent data.
The specific fields required at minimum: initial inquiry timestamp, initial inquiry source, first-contact timestamp, VOB completion timestamp, VOB completion status, intake conversation completion status, scheduled admit day, actual admit day, admit outcome (completed / no-show / rescheduled / cancelled), and paid claim amount (populated 60 to 90 days after admit).
Facilities without these fields configured cannot run the full KPI framework regardless of what other measurement infrastructure they have. The CRM configuration work is the prerequisite that most operators underestimate at the front end of an admissions ops overhaul.
How do we handle coordinator performance conversations when one coordinator has a bad month?
The right framing is that a single-month performance dip typically reflects lead volume, lead quality, or specific case complexity rather than coordinator performance. The individual conversation should be diagnostic, not disciplinary.
The specific pattern: pull the coordinator’s trailing three months of KPI data, compare against team averages, and identify whether the recent month is an outlier or the beginning of a trend. If it is an outlier, the conversation is contextual (what specifically happened that month). If it is a trend, the conversation is developmental. What coaching or workflow changes would move the numbers.
Facilities that treat every bad month as a coordinator performance problem burn out coordinators and lose institutional knowledge. Facilities that treat every bad month as a system problem never address individual coaching opportunities. The diagnostic framing keeps both risks in check.
How do we integrate admissions KPI reporting with marketing KPI reporting?
The specific integration happens at the middle of the funnel where lead-to-admit conversion sits. Marketing measures CPL and lead volume by channel. Admissions measures lead-to-admit conversion by source (which typically maps to the marketing channel).
The joined view at the QBR review shows CPL by channel, lead-to-admit conversion by source, cost per admit by channel, and contribution margin per admit by channel. This produces the single operating picture that determines where marketing budget and admissions attention should flow. Our marketing-admissions QBR playbook covers the specific joined-view structure.
Facilities that run the two reporting stacks in isolation miss the cross-channel patterns that inform strategic decisions.
How does the admissions team hostage dynamic affect KPI reporting?
The admissions team hostage dynamic is the operational pattern where the admissions team accumulates disproportionate power in the organization because they control the census. Facilities in this dynamic often have distorted admissions KPI reporting because the admissions team resists the transparency the KPI framework requires.
The specific tells: admits by coordinator not reported, lead-to-admit conversion reported only in aggregate (no source-level or coordinator-level breakouts), time-to-VOB not measured, and contribution margin per admit not tracked. When the reporting layer is missing the diagnostic depth, the hostage dynamic is usually present.
The fix is executive-level insistence that the KPI reporting infrastructure gets built regardless of resistance from the admissions team leadership. Once the transparency is in place, the specific coaching, coordination, and role-fit conversations become possible.
What is a realistic timeline to move an admissions team from no KPI framework to full framework?
The specific timeline runs 90 to 120 days from decision to steady-state operation.
The first 30 days are CRM configuration and process design: the fields required for the KPI stack get configured, workflow steps that produce the underlying data get standardized, and the initial reporting templates get built. The next 30 days are execution ramp: the team runs the workflow at the new discipline level, coordinators get trained on the new fields and expectations, and the first monthly reporting cycle produces initial baselines.
The final 30 to 60 days are optimization: the KPI baselines get compared against benchmark ranges, specific coaching and workflow adjustments get applied, and the QBR integration gets configured so the marketing team sees the joined view. Facilities that skip the CRM configuration phase and try to run the framework on existing infrastructure typically produce distorted data that cannot support real decisions.
Jim Malcom is the Director of Admission Ops at Webserv, a digital marketing agency for treatment centers.