Every published piece on rate intelligence in behavioral health is written from the single-facility perspective. A treatment center runs admissions, looks up expected reimbursement on a specific admit, and decides whether the case makes economic sense at the facility level.
That framing works for the majority of operators in the market because most treatment centers are single-facility businesses. It stops describing the operating reality once an operator crosses into the portfolio zone.
A three-facility residential network in California, a five-location outpatient group across Florida, a PE-backed platform running twelve facilities across the Southeast, or a national brand with thirty-plus programs faces a payer mix question that no single-facility framing captures.
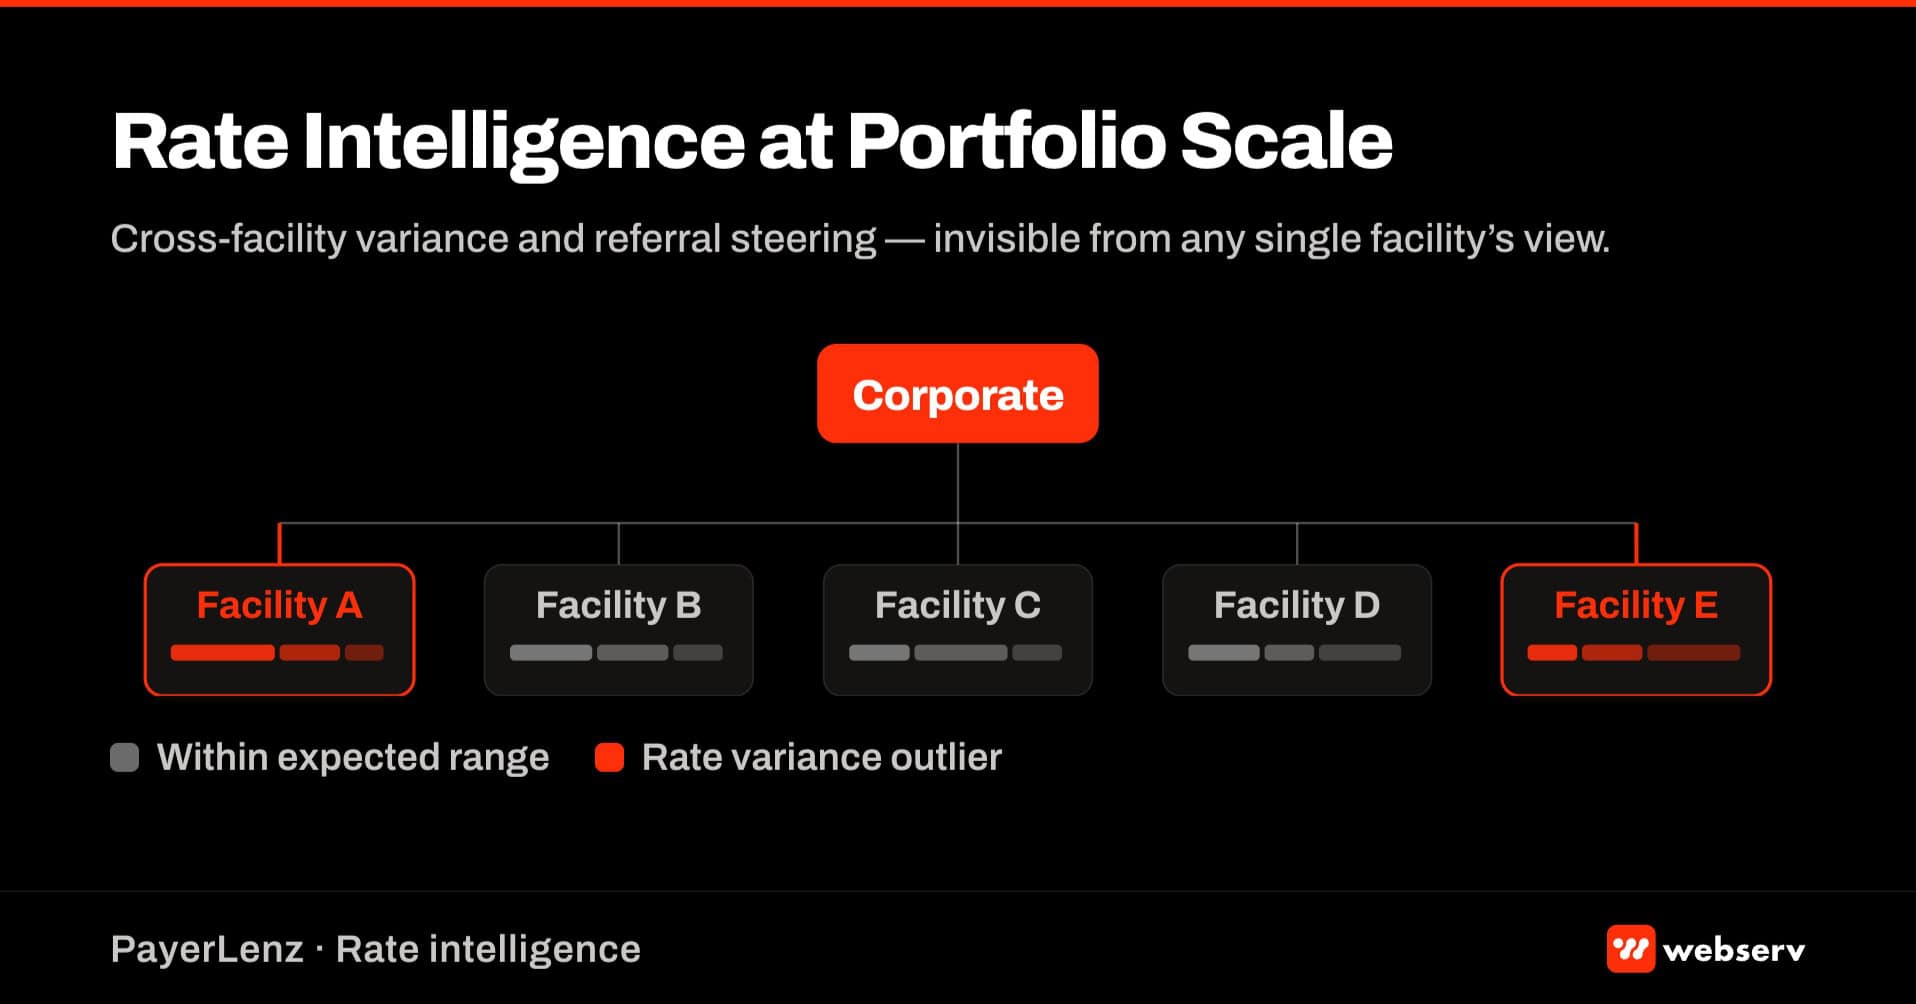
The portfolio operator does not primarily need to know what a specific payer pays at a specific admit. The portfolio operator needs to know how the payer mix performs across the network, which facilities are absorbing the underperforming admits, where the referral flow can be steered to the higher-yielding sites, and how the multi-facility volume changes the platform’s negotiating posture in contract renegotiation cycles.
PayerLenz is built as a single-facility rate intelligence tool at the admission-decision level, but the data infrastructure it runs on produces portfolio-scale operating capabilities that most multi-facility operators are not currently using.
This piece walks what changes at portfolio scale, the specific decisions rate intelligence unlocks for multi-facility operators, and the centralization question that determines whether portfolio-level payer strategy actually runs as a discipline or gets stuck as a dashboard.
Key Takeaways
- Single-facility rate intelligence answers “what will the payer pay for this specific admit.” Portfolio-level rate intelligence answers “how does our payer mix perform across the network, which facilities are absorbing the underperforming admits, and where can the referral flow be steered to improve the aggregate.”
- Multi-facility operators typically discover that the same payer and plan combination produces materially different paid amounts across their facilities. The variance drivers are billing team discipline, coding practice differences, and payer-side network routing.
- The three portfolio-specific operating decisions that single-facility framing misses: cross-facility referral steering (routing admits to the facility where the specific plan pays best), portfolio-level contract renegotiation (bringing multi-facility volume to the negotiation), and coordinated payer mix construction across the network.
- PE-backed operators face additional portfolio-level rate intelligence needs: quarterly board reporting on payer mix quality, LP-facing metrics on realized reimbursement per admit, and exit-value optimization by improving the payer mix concentration over the hold period.
- The centralization decision is where most multi-facility operators struggle. Centralized payer strategy captures the volume and reporting advantages but risks losing the local knowledge that keeps individual facilities operationally effective. The pattern that works: centralize structural decisions, decentralize operational ones.
DEFINITION
Portfolio-level payer strategy. The discipline of managing payer mix, contract terms, and referral flow across a network of facilities as one integrated operating picture rather than as a set of independent single-facility decisions.
Distinct from single-facility payer strategy (which asks “which payers should this facility accept, and at what expected rates”). Distinct from portfolio-level financial management (which aggregates facility P&Ls for reporting). Portfolio payer strategy turns a set of facility-level revenue engines into a coordinated portfolio where admissions volume flows toward the facilities and payers that produce the best risk-adjusted returns.
What Portfolio-Level Payer Strategy Actually Is
Portfolio-level payer strategy is the discipline of managing payer mix, contract terms, and referral flow across a network of facilities as one integrated operating picture rather than as a set of independent single-facility decisions.
The category is distinct from single-facility payer strategy. Single-facility payer strategy asks “which payers should this facility accept, and at what expected rates.” Portfolio strategy asks “how does our aggregate payer mix perform across the network, and how do we reshape it over time to improve the whole.”
The category is also distinct from portfolio-level financial management. Financial management aggregates the facility-level P&Ls into a consolidated view for reporting. Payer strategy at the portfolio level makes operating decisions about how to reshape the aggregate payer mix, contract structure, and referral flow.
The right way to think about portfolio payer strategy is that it turns a set of facility-level revenue engines into a coordinated portfolio where admissions volume flows toward the facilities and payers that produce the best risk-adjusted returns.
OPERATOR INSIGHT
The portfolio operator does not primarily need to know what a specific payer pays at a specific admit. That is the single-facility question.
The portfolio operator needs to know how the payer mix performs across the network, which facilities are absorbing the underperforming admits, where the referral flow can be steered to the higher-yielding sites, and how the multi-facility volume changes the platform’s negotiating posture in contract renegotiation cycles. That is a categorically different set of questions the single-facility framing does not answer.
The Three Portfolio-Specific Problems
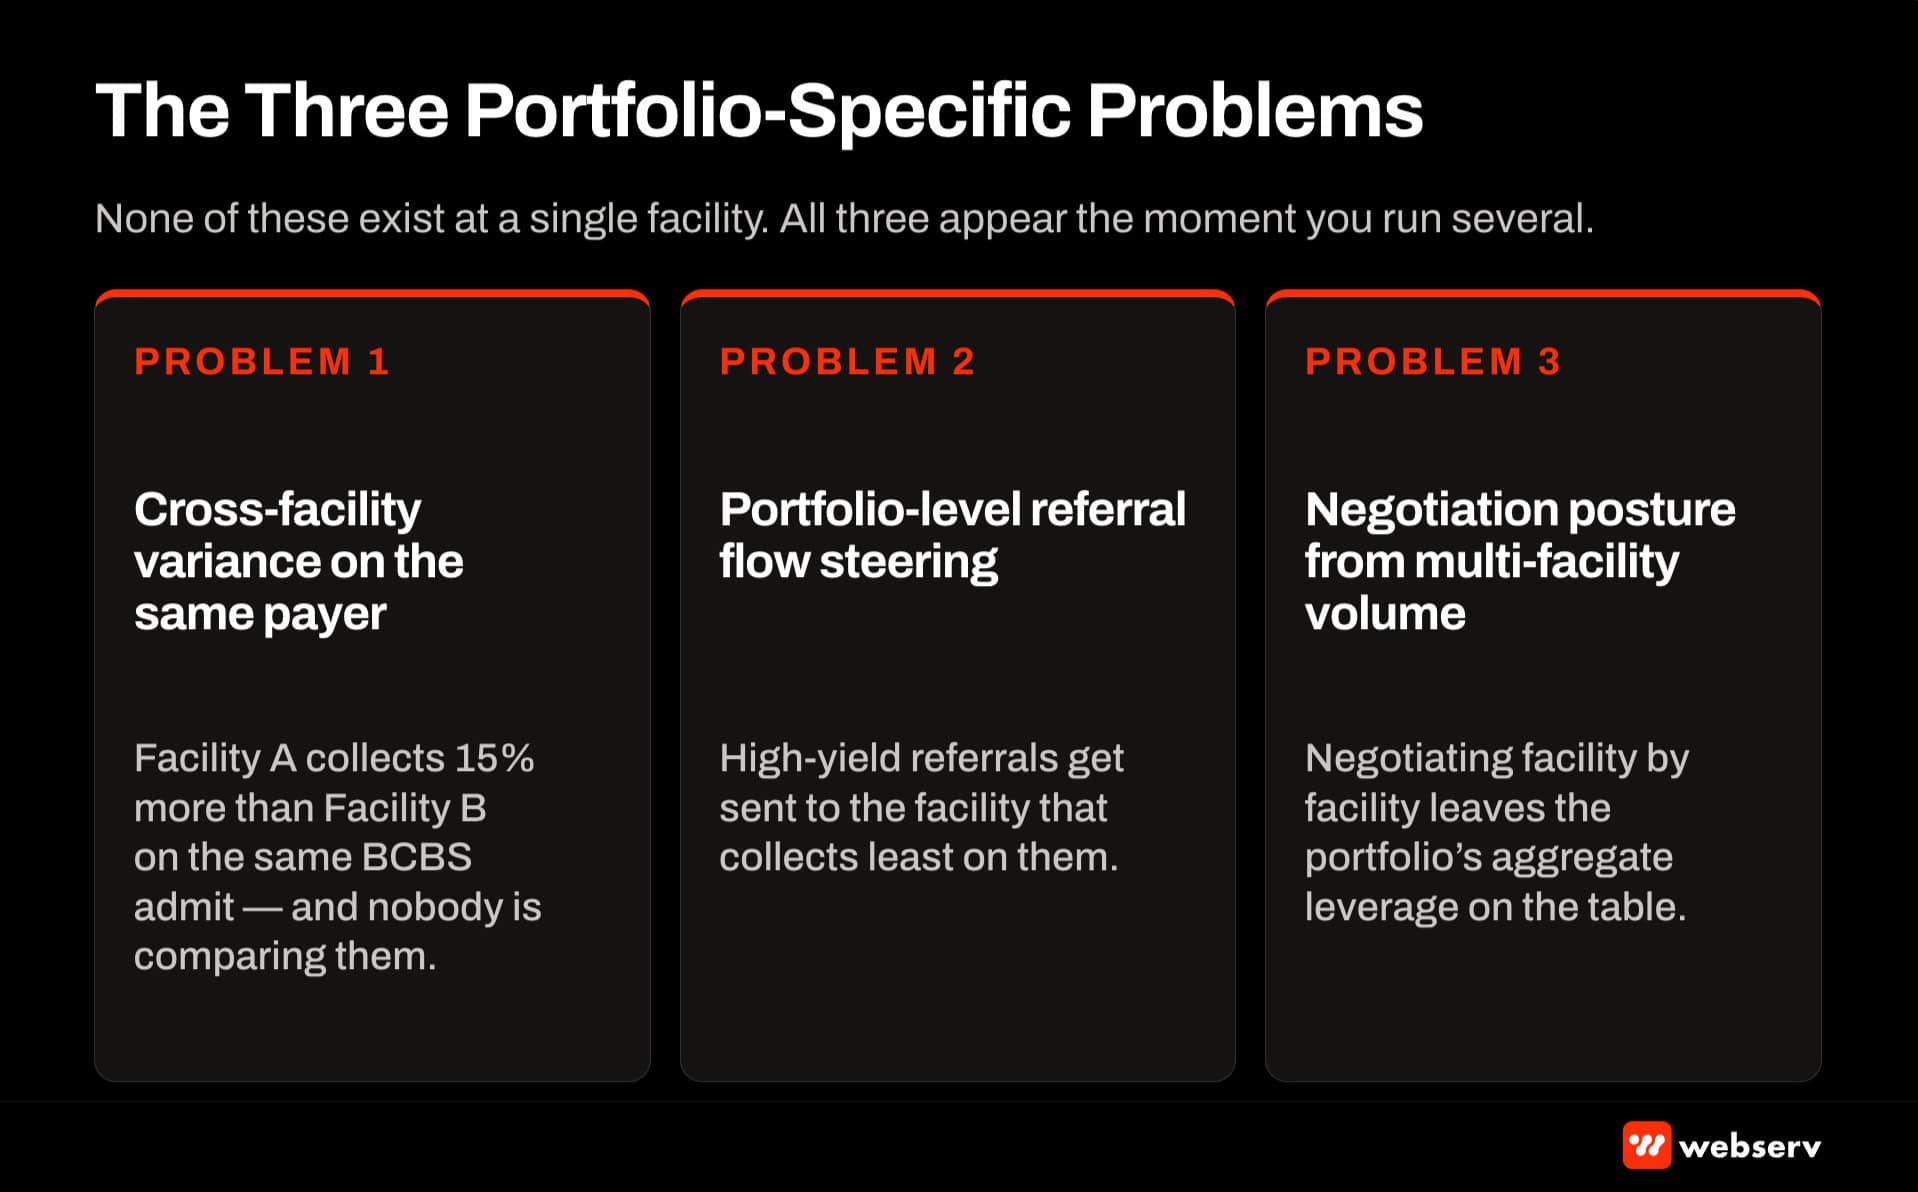
Three problems show up at portfolio scale that single-facility framing misses entirely.
Cross-facility variance on the same payer
The first problem is that the same payer and plan combination often produces materially different paid amounts across facilities in the same portfolio.
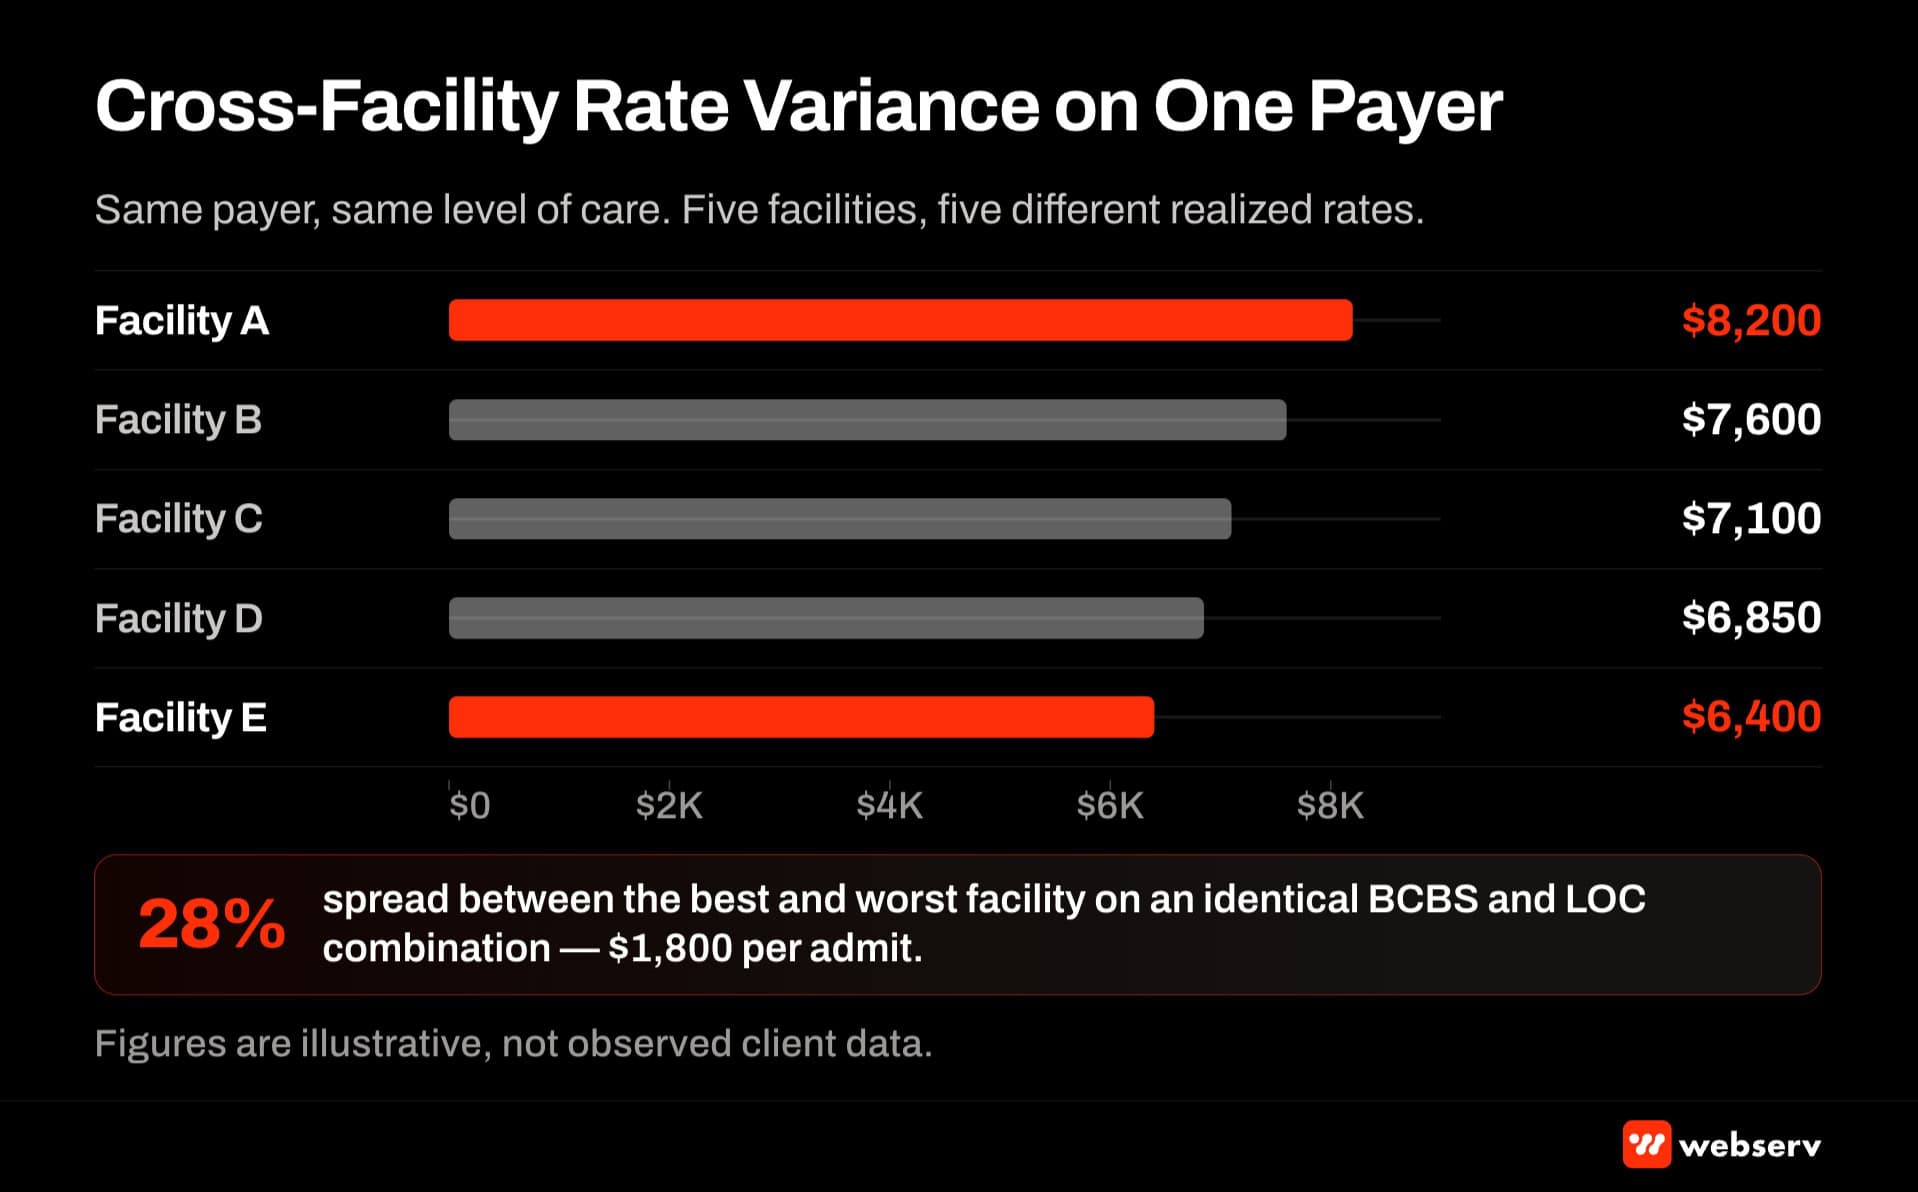
Two residential SUD facilities in California, both admitting patients on the same California BCBS home plan at OON, will see paid amounts that diverge more than most operators expect.
The variance drivers are structural. Different facilities have different billing team disciplines. Different facilities code the same service in slightly different ways. Different facilities have different follow-up cadence on denials and appeals. And payer-side network routing decisions sometimes send claims from different facility NPIs through different adjudication pipes even when the underlying coverage looks identical.
Single-facility rate intelligence cannot see this variance because it looks at each facility’s rates in isolation. Portfolio-level rate intelligence surfaces the variance and lets the executive team ask the productive question: why does Facility A get paid $2,400 per day on this plan while Facility B gets paid $1,800 on the same plan, and what specific operational fix closes the gap.
Portfolio-level referral flow steering
The second problem is that referral flow is typically routed at the facility level rather than the portfolio level. Referral partners send patients to the facility they have a relationship with, or to the geographically closest facility, rather than to the facility where the specific patient’s plan will produce the best paid rate.
At the portfolio level, this is a solvable resource allocation problem. If Patient A carries a plan that pays best at Facility X, and Patient B carries a plan that pays best at Facility Y, the platform can develop a referral routing rule that steers each patient to the facility that maximizes the expected reimbursement.
Single-facility rate intelligence cannot support this steering because it does not compare across facilities. Portfolio-level rate intelligence produces the comparative rate view that makes intelligent referral routing possible.
Contract negotiation posture from multi-facility volume
The third problem is that in-network contract negotiations run at the payer-and-facility level rather than the payer-and-portfolio level. Each facility negotiates its own contract with its own volume, which limits the negotiating power available in any single negotiation.
At the portfolio level, the aggregated multi-facility volume changes the negotiation posture materially. A payer looking at 15 residential admits per month at one facility versus 150 admits per month across a portfolio has a materially different willingness to move on rates.
The multi-facility volume also produces a stronger case for portfolio-wide contract terms that make the payer’s administrative burden lower in exchange for better rates. Single-facility rate intelligence supports single-facility negotiations. Portfolio-level rate intelligence supports platform-level negotiations that capture the volume-based negotiating power.
Portfolio-scale rate intelligence benchmarks
3-5 facilities
Typical inflection where portfolio-level rate intelligence starts producing meaningful returns
10x
Volume delta a portfolio brings vs single-facility to contract renegotiation posture
90-180 days
M&A-acquired facility integration into portfolio-level reporting
6-12 mo.
Typical time for a centralization transition to stick
What Rate Intelligence Unlocks for Portfolio Operators
The specific portfolio-level operating decisions rate intelligence changes fall into five categories.
Cross-facility comparative rate reporting
The first capability is a comparative view of paid rates across facilities on the same payer, plan, level of care, and network status. The report shows Facility A at $X per day, Facility B at $Y per day, Facility C at $Z per day on the identical cell, with the variance called out.
That report is the entry point for the “why is Facility B underperforming” conversation. Sometimes the answer is billing discipline. Sometimes it is coding practice. Sometimes it is a payer routing quirk that a portfolio-level operations team can escalate through a payer relationship the facility team does not have. Either way, the visibility is the prerequisite for closing the gap.
Referral flow steering rules
The second capability is a set of rules that route incoming admits to the facility in the portfolio where the specific plan produces the best expected reimbursement. The rule engine sits above the admissions ops workflow and directs referral partners, marketing inbound, and family-initiated inquiries to the facility that will maximize the case-level economics.
Steering rules work best when the portfolio has multiple facilities offering similar levels of care in overlapping geographies. A three-facility California residential network with two OP/IOP programs each has meaningful steering opportunity. A five-state platform with one facility per state has less steering opportunity because the clinical-fit constraints tie each admit to a specific facility regardless of the rate math.
The rule engine also has to respect clinical fit. Steering a patient to a facility that pays $500 more per day but does not match the clinical program (specialty populations, LOC availability, cultural fit) is not a win. The steering discipline is about optimizing case-level economics within the constraint of clinical appropriateness.
Portfolio contract renegotiation strategy
The third capability is a coordinated approach to in-network contract renegotiation across the portfolio. Instead of each facility renegotiating its own contract in isolation, the platform runs a coordinated renegotiation cycle that brings the aggregated volume to the negotiation.
The strategy typically has three tiers. Tier one is the small number of payers where the platform has enough volume to command a full portfolio contract with unified terms. Tier two is the payers where the volume supports coordinated but facility-specific contract terms with better rates than any single facility could negotiate alone. Tier three is the tail of payers where each facility keeps its own contract because the volume does not justify centralized coordination.
Rate intelligence supports the tiering decision by showing the platform-level revenue at stake in each payer relationship. That data determines which payers get the tier-one treatment and which stay at the facility level.
Board-facing quarterly reporting
The fourth capability is a portfolio-level payer mix report that fits the quarterly board or LP review cadence. The report shows aggregate admit volume, rate-adjusted admit volume, payer mix concentration, facility-level performance variance, and the strategic decisions the executive team is running against the data.
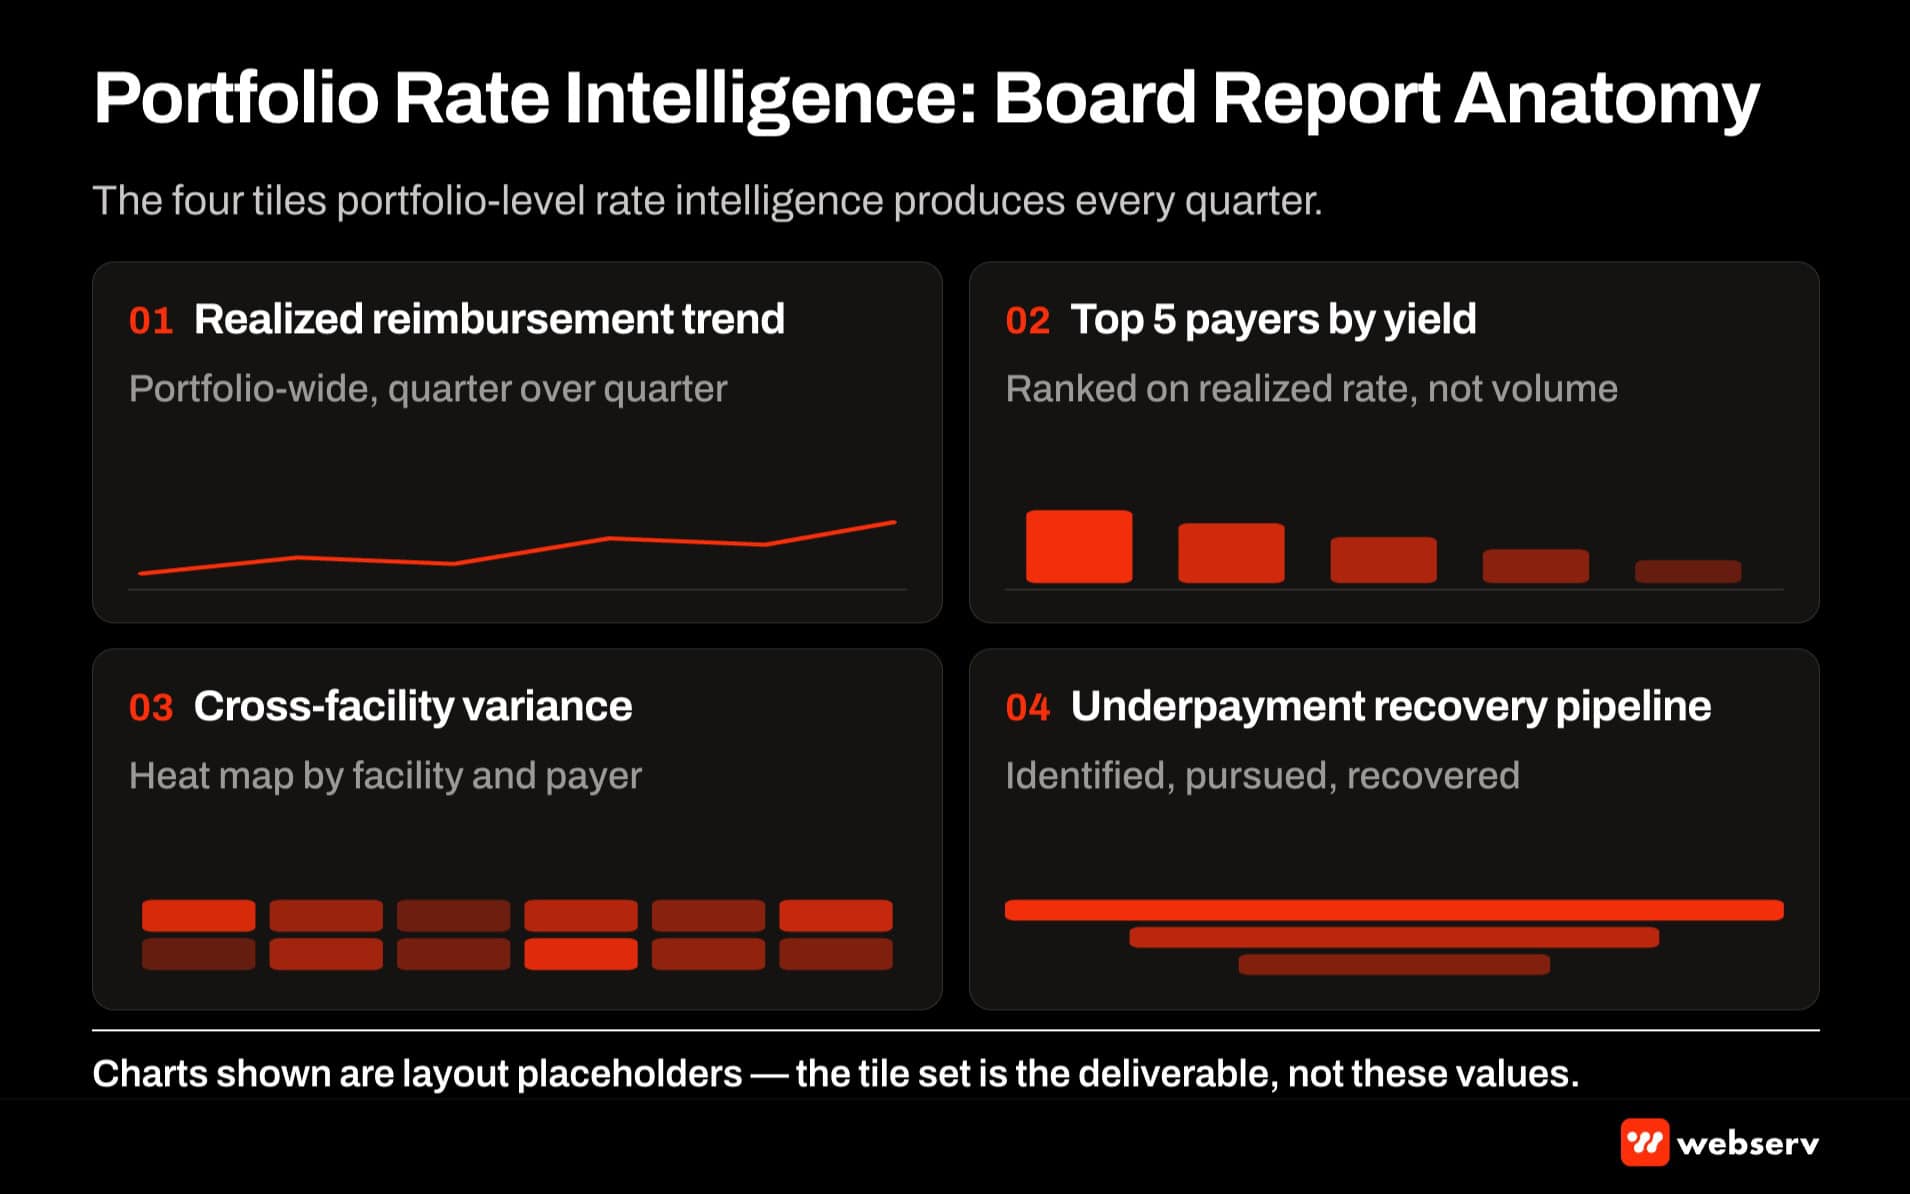
The report is materially different from a standard operating report. It focuses on payer mix quality (weighted by rate intelligence) rather than raw admit volume. It surfaces variance across facilities as a management issue rather than hiding it in the consolidated numbers. And it makes strategic payer decisions defensible against real data rather than executive-team assertions.
Our marketing and admissions QBR playbook covers the reporting shape at the single-facility level. Portfolio operators need to adapt that framework to the multi-facility view.
Exit-value payer mix optimization (PE-specific)
The fifth capability is specific to PE-backed operators approaching exit. Buyers of behavioral health portfolios increasingly evaluate the payer mix quality alongside admit volume and EBITDA.
A portfolio running high admit volume on low-yielding payer mix is worth materially less at exit than a portfolio running the same volume on high-yielding payer mix. Rate intelligence during the hold period lets the sponsor systematically improve payer mix quality.
The strategy runs across the full portfolio: dropping consistently underperforming OON prefixes, renegotiating in-network contracts where the rate data supports it, steering referral flow toward higher-yielding plans, and tracking the quarter-over-quarter improvement in payer mix concentration on the plans that produce the best economics.
At exit, the improved payer mix supports a materially better valuation multiple than a portfolio that stayed on the payer mix it inherited.
The Centralization Question
The hardest question at portfolio scale is not whether to run rate intelligence at the portfolio level. It is which decisions get made centrally versus at the facility level.
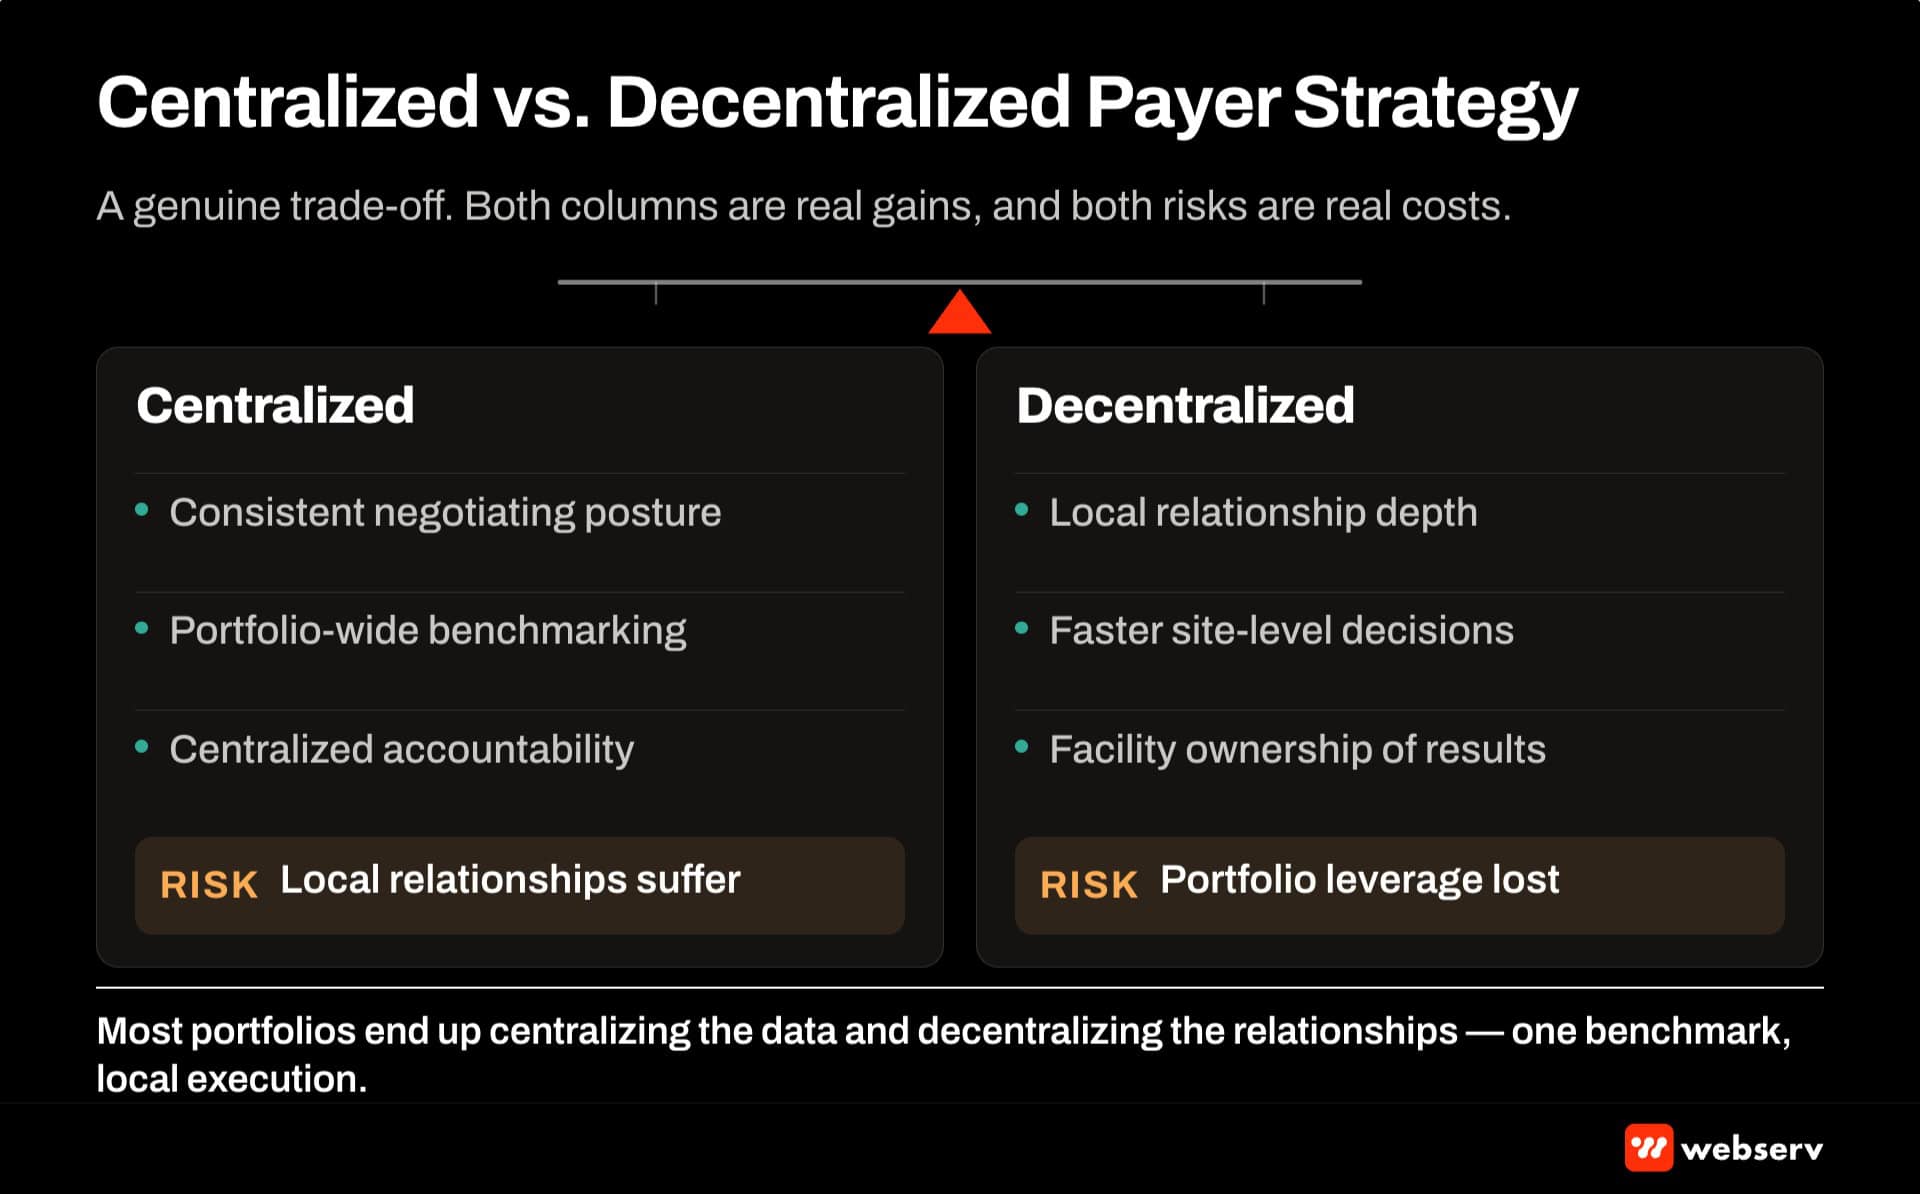
Full centralization captures the volume advantages, the reporting consistency, and the strategic coherence. It also risks losing the local knowledge that keeps individual facilities operationally effective. Facility teams that stop having ownership over payer decisions typically stop investing operational care into the outcomes.
Full decentralization keeps facility-level ownership and local knowledge intact. It also means the platform gives up the volume-based negotiating power, produces inconsistent reporting, and cannot execute portfolio-level referral steering.
The pattern that works across the multi-facility operators we advise is centralized reporting plus centralized contract negotiation plus facility-level admissions ops execution.
The platform owns the payer mix data, runs the coordinated contract negotiations, and produces the quarterly board-facing reporting. The facilities own the day-to-day admissions ops execution, the local referral partner relationships, and the case-level clinical fit judgment.
The bright line between the two is that platform decisions are structural (which payers we work with, on what terms, in what volume) and facility decisions are operational (which specific patients we admit today, from which referral sources, with what clinical fit).
CENTRALIZE
- Payer selection (which payers we work with, on what terms, in what volume).
- Contract negotiation across the multi-facility volume.
- Quarterly board-facing payer mix reporting and cross-facility variance analysis.
- Referral routing rules that steer admits to the facility maximizing case-level economics.
- Portfolio-level payer mix construction and exit-value optimization strategy.
DECENTRALIZE
- Day-to-day admissions ops execution (which specific patients we admit today).
- Local referral partner relationship management and community trust building.
- Case-level clinical fit judgment on individual admissions.
- Facility-specific billing and coding execution, denial management, and VOB workflow.
- Local staff hiring, retention, and program-culture decisions.
Common Failure Modes at Portfolio Scale
Three failure modes show up repeatedly at multi-facility operators trying to run rate intelligence at the portfolio level.
Treating the portfolio as a set of independent single-facility installations. Each facility gets rate intelligence for its own admissions ops workflow, but nothing runs at the platform level. This captures the single-facility value but leaves the portfolio-level capabilities on the table.
Over-centralizing to the point where facility teams stop feeling ownership. Payer decisions happen at headquarters. Facility teams execute orders without local input. Facility admissions performance typically degrades over 6 to 12 months as the local judgment atrophies.
Running the portfolio-level reporting without acting on it. The comparative rate report gets produced quarterly, shows meaningful variance across facilities, and never generates a specific management intervention at the underperforming facility. Reports without decisions are theater.
The fix in all three cases is the same: define the specific portfolio-level decisions the executive team will make with the data (typically some combination of the five capabilities above), assign owners for each decision, and run a quarterly cadence that turns the data into specific, dated interventions.
Frequently Asked Questions
How large does a platform need to be before portfolio-level rate intelligence justifies the investment?
The threshold typically sits around 3 to 5 facilities offering similar levels of care in overlapping or adjacent markets. Below that scale, the coordination cost outweighs the portfolio-level advantages and single-facility rate intelligence captures most of the achievable value.
Above that scale, the portfolio-level capabilities (referral steering, coordinated contract negotiation, board-facing reporting, cross-facility variance analysis) become materially valuable, and running them as a discipline typically produces a meaningful multiple on the incremental operational effort.
The specific inflection depends on the geographic and clinical overlap across facilities. A 3-facility California residential network has more portfolio opportunity than a 5-state platform with one facility per state, because the steering rules require overlapping clinical fit and geographic proximity to work operationally.
How do we handle facilities that resist the shift to centralized payer strategy?
Resistance typically comes from facility executive teams that feel the shift undermines their local authority. The framing that resolves the resistance is that centralization is happening at the structural layer (payer selection, contract terms, portfolio-level reporting) while facility teams retain ownership of operational execution (day-to-day admissions ops, local referral relationships, clinical fit judgment).
The bright-line separation of platform decisions and facility decisions is what preserves the local ownership. When facility teams see that they still make the day-to-day operating calls, and the platform is taking on structural work that individual facilities could not execute alone, resistance typically shifts to engagement.
The transition takes 6 to 12 months in practice. The first quarterly review after the shift is the moment that determines whether the discipline sticks or reverts.
What data does rate intelligence produce specifically for a PE-backed operator?
Three data outputs sit at the top of the PE-facing utility stack. First, quarterly payer mix quality reporting for the LP-facing investor updates. Second, portfolio-level realized reimbursement per admit as a first-class metric alongside admit volume and EBITDA. Third, exit-value payer mix improvement tracking over the hold period.
At exit, the accumulated payer mix improvement is documented in the deal materials as evidence of platform-level operational discipline. Buyers looking at behavioral health portfolios in 2026 increasingly ask about payer mix quality in addition to EBITDA multiples, because payer mix concentration on high-yielding plans is what supports future revenue durability.
The strategy runs across the full portfolio: dropping consistently underperforming OON prefixes, renegotiating in-network contracts where the rate data supports it, steering referral flow toward higher-yielding plans, and tracking the quarter-over-quarter improvement.
How does portfolio-level referral steering interact with existing referral partner relationships?
The steering rules operate within the constraints of existing referral partner relationships rather than replacing them. A referral partner that has historically routed to a specific facility keeps that relationship, but the platform can influence which admits within that partner’s stream get routed to which facility based on plan-level economics.
The productive framing for referral partners is that steering rules improve the mutual value of the relationship. Partners routing patients to the facility that produces the best case-level outcomes get better admission conversion rates, which strengthens the partnership over time.
Partners that resist steering typically self-select out of the top-tier referral partner mix over time, which is not a bad outcome because those partners were producing marginal value anyway.
How do we set up the cross-facility variance analysis at the operational level?
The specific reporting infrastructure is a weekly variance report that groups paid claims by payer, plan, level of care, and network status, then compares facility-level paid amounts on the same cell. The report highlights cells where facility-level variance exceeds a defined threshold.
Each variance flag triggers an operational review. Sometimes the answer is a billing discipline gap at the underperforming facility. Sometimes it is a coding practice difference. Sometimes it is a payer routing quirk that requires escalation through the platform-level payer relationship. The review pattern is more important than the specific findings because it turns the variance from a reporting artifact into a management issue.
Portfolio operators running this discipline weekly typically see the aggregate variance narrow meaningfully over 2 to 3 quarters as the operational fixes accumulate.
What happens to portfolio-level rate intelligence if we acquire a new facility?
New facility integration into the portfolio-level rate intelligence system takes 90 to 180 days of claims history accumulation before the new facility appears in the cross-facility comparative reports with meaningful confidence. During the ramp period, the new facility uses the existing PayerLenz single-facility workflow while the pool accumulates data on the facility’s specific rate cells.
The specific integration steps are: contract the new facility into the PayerLenz contributor pool, configure the CRM integration for admissions-ops rate lookups, accumulate 90 days of claims history to establish baseline rate cells for the new facility, then include the facility in the cross-facility comparative reporting once confidence coverage supports it.
M&A-heavy portfolios often run this integration as a standard piece of the post-close integration playbook, alongside financial systems consolidation and operational integration.
Preston Powell is CEO of Webserv, a behavioral health marketing agency and admissions operations platform working with residential, outpatient, and telehealth treatment providers across the United States. He founded Webserv in 2015 and co-founded the PayerLenz reimbursement intelligence product alongside Kyle McHenry. He works directly with multi-facility platform operators and PE-backed behavioral health sponsors on portfolio-level payer strategy.