A former client called me last quarter. They were in network with Kaiser. Their entire admit pipeline ran on referrals from a single contract.
Two years ago, when that pipeline filled up, they stopped paying for marketing. The math was simple from where they were standing. Beds were full. Why pay for ads?
Then they lost the network status, almost had to close the doors, and started doing their own billing in a panic. The marketing program they had cut nine months earlier was the only safety net that could have caught them. It was already gone.
I think about that call when operators ask me how to read their cost per admit number. Cost per admit is a useful metric. It is also a metric that misses the most expensive failures in the funnel.
Inside Webserv’s paid media program for treatment centers, the dollar an operator spends on a Google ad does not actually convert until the claim collects. Every billing failure between admit and collection is a marketing failure that never gets attributed to marketing.
This article is about why that gap exists, what it costs you, and how marketing teams should be looking at billing data if they want their actual return on ad spend to match what their dashboard says.
Key Takeaways
- Cost per admit is the wrong primary KPI for behavioral health paid media. Cost per collected dollar is the one that actually answers whether a channel is working.
- ROAS was built for ecommerce, where revenue lands in the bank within five days of the click. In rehab, the lag between click and collected dollar runs 90 to 180 days, and the variance per admit is enormous.
- Three patterns show up over and over: cost per admit is stable but collected revenue per admit drops, a specific channel produces admits that under-collect, and the slow VOB silently loses admits before either system records them.
- The fix is not a new dashboard. It is one recurring meeting where the marketing lead, admissions director, and billing partner sit with the same numbers and see channel performance against payer mix and collection lag.
- Treatment centers that run this loop for 90 days routinely find one paid channel that looked great on cost per admit but was subsidizing the rest of the program. Cutting it would have cost six figures in collected revenue.
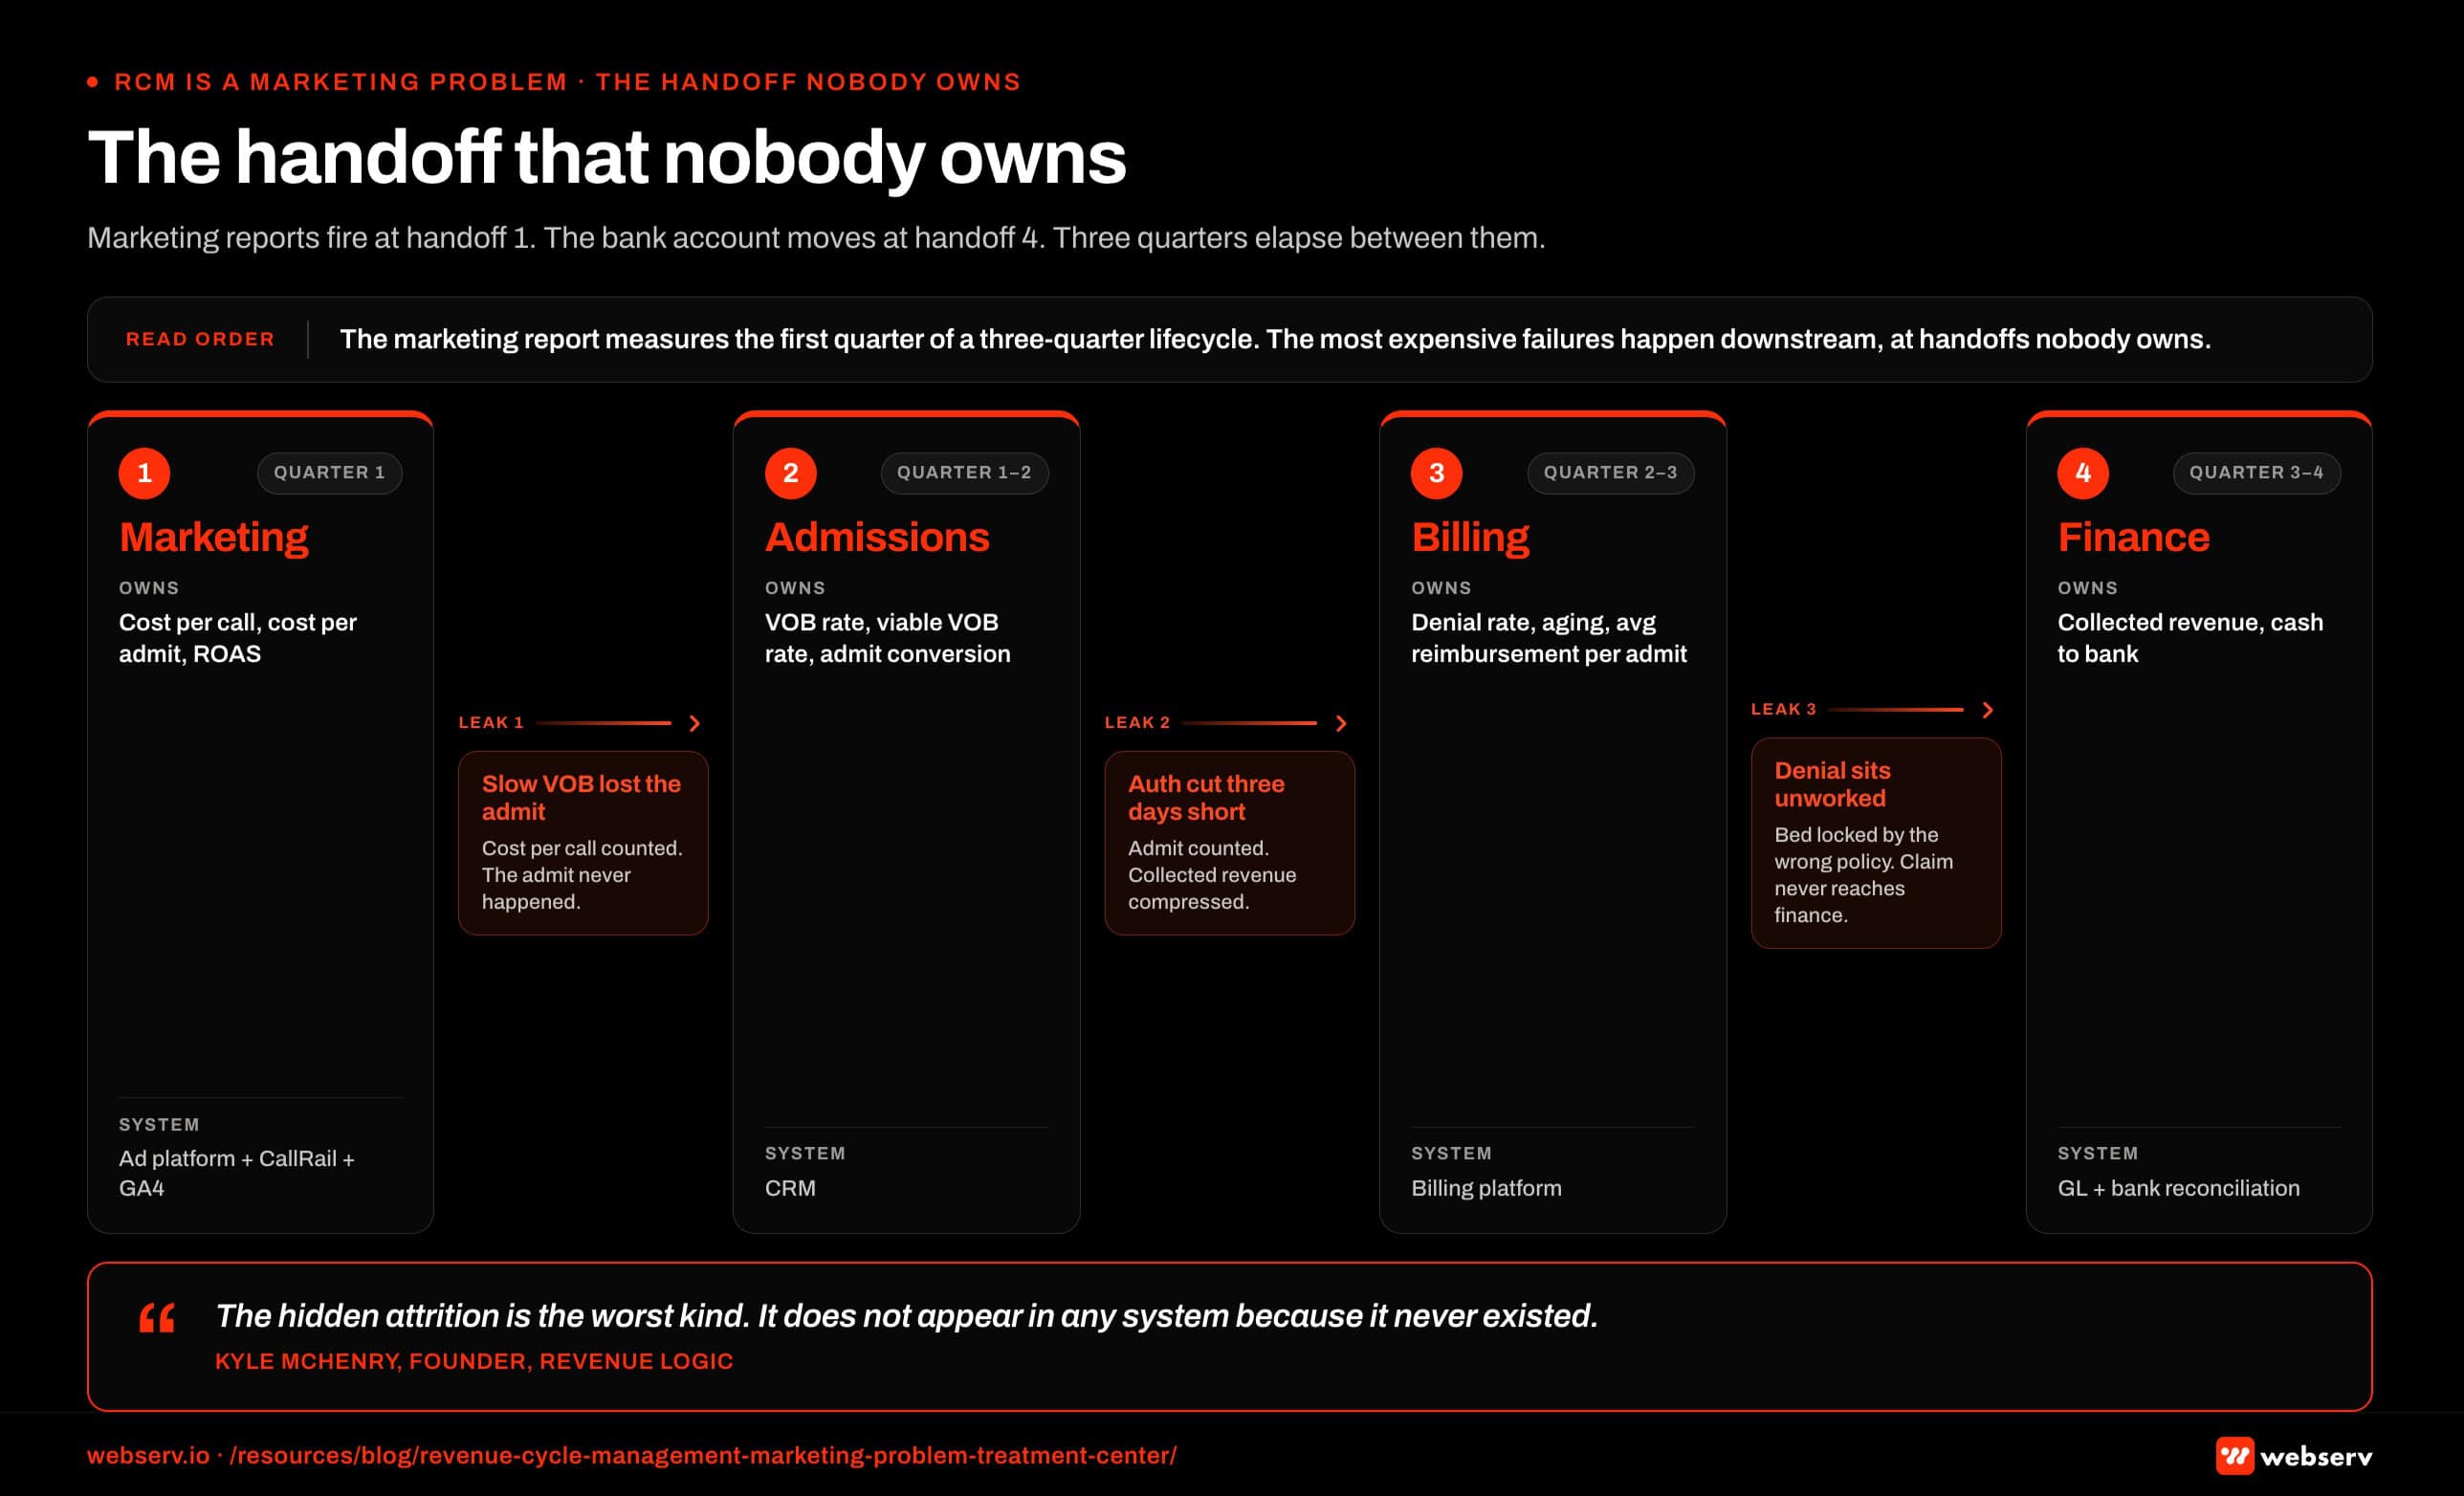
The handoff that nobody owns
Marketing teams hand the inquiry call to the admissions team. The admissions team hands the patient to billing. Billing hands the paid claim back to finance.
By the time anyone has a number that captures the full lifecycle of an admit, three quarters have passed and the marketing dashboard has already been used to make six channel decisions.
That gap is structural, not lazy. Marketing tools are designed to measure attribution at the form-fill or call. The downstream conversion to collected revenue happens in a billing system the marketing team does not have a login for.
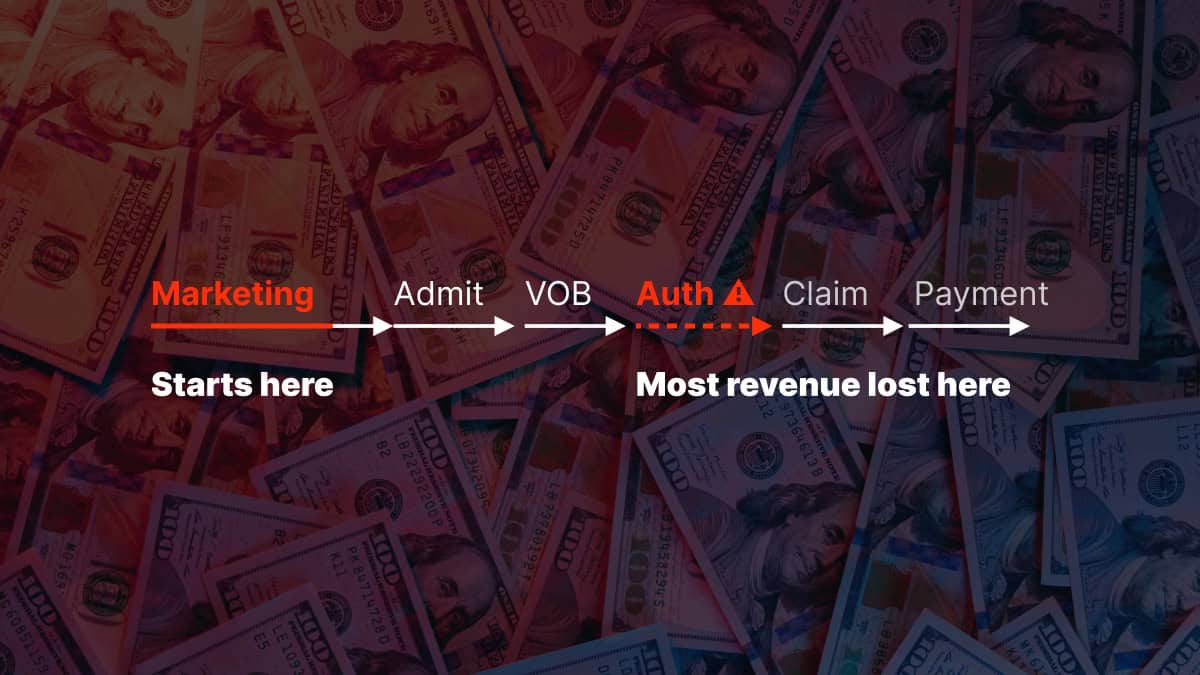
So we measure what we can see. Cost per call. Cost per admit. Sometimes cost per VOB. Almost never cost per collected dollar.
The problem with measuring what we can see is that the most expensive failures happen on the other side of that wall.
“The hidden attrition is the worst kind. It does not appear in any system because it never existed.”
Kyle McHenry, Founder, Revenue Logic
That is the part most marketing reports miss: the slow VOB that lost the admit, the auth cut three days short, a denial sitting unworked, a bed locked up by the wrong policy. The ROAS calculation shows none of it, and neither does the campaign report.
ROAS treats every admit as equal value
Every paid media platform measures return on ad spend by counting conversions. A conversion fires when a form is submitted, a call connects, or a patient is marked admitted in the CRM.
The platform does not know whether that admit came in on a Cigna MRC1, a Maine BCBS that is about to be deleted from the database, or a self-pay patient who will not finish detox.
A $4,000 cost per admit looks identical for all three of those patients in the dashboard. Their actual revenue contribution ranges from roughly zero to $70,000.
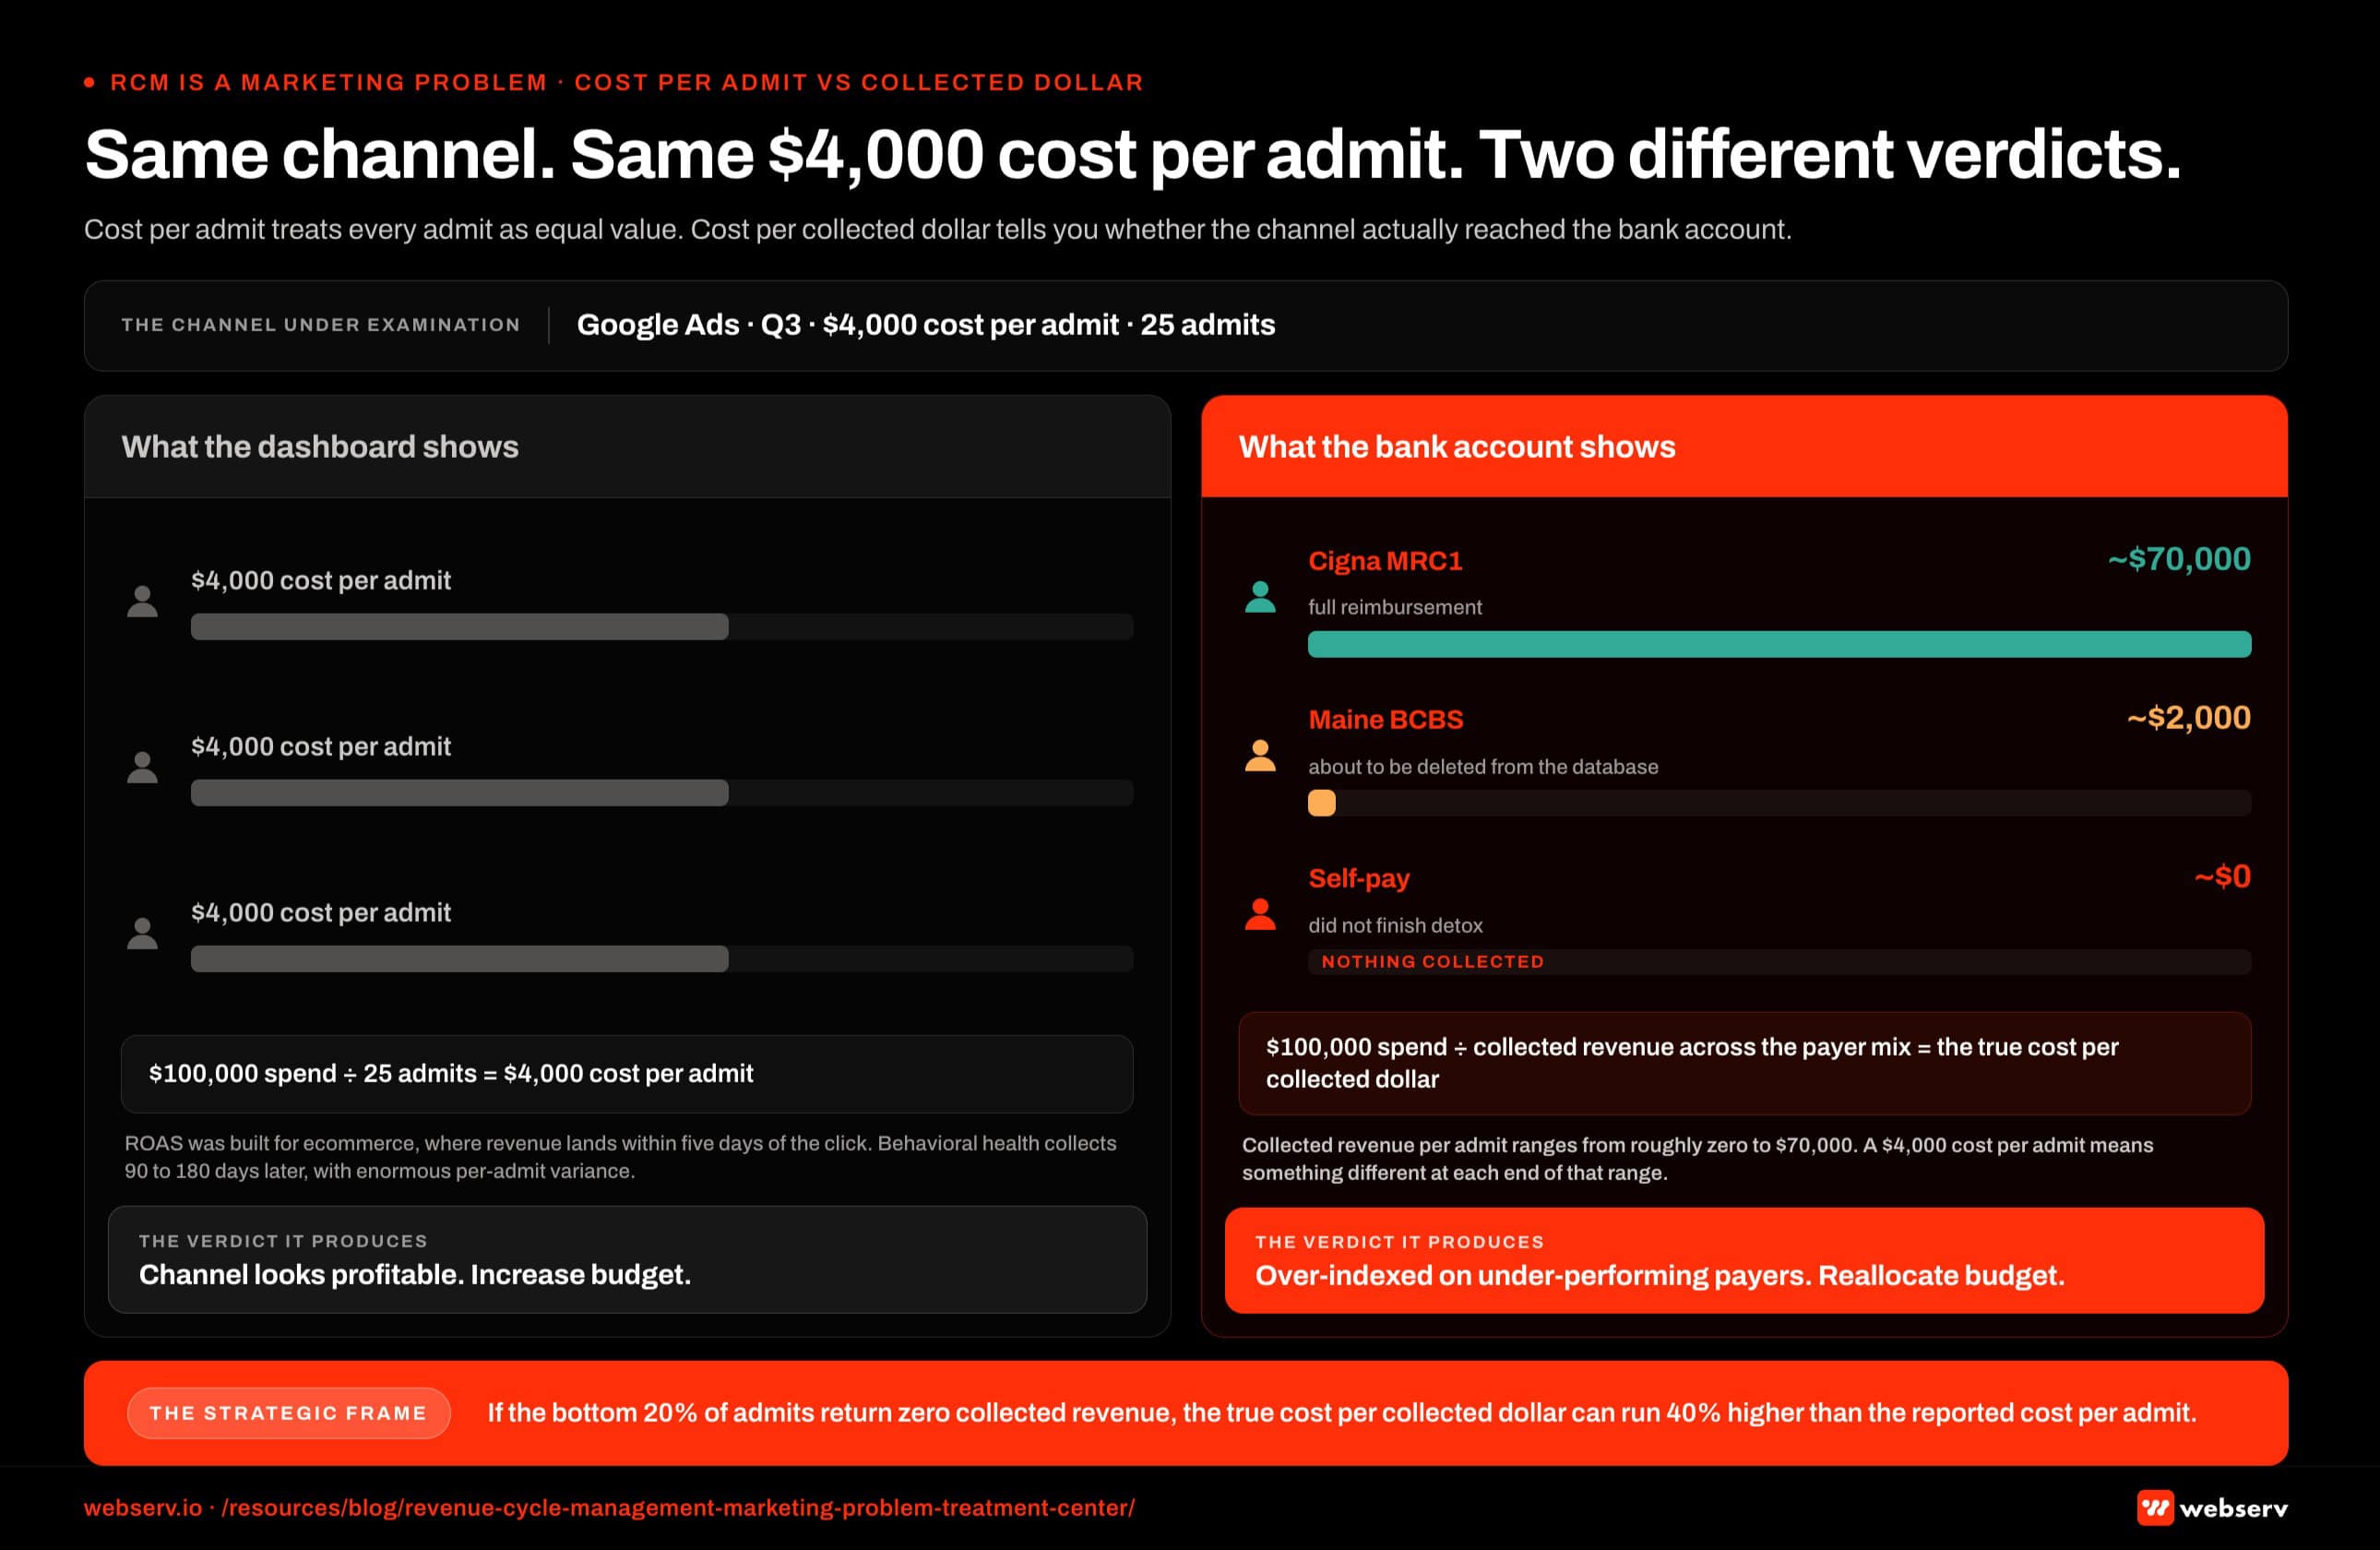
If the bottom 20 percent of your admits return zero collected revenue, your true cost per collected dollar can run 40 percent higher than your reported cost per admit.
The part of the funnel that determines which admits are which is mostly handled by people who never see the ad spend report.
This is not a marketing operations failure. It is a metric design failure. ROAS was built for ecommerce, where revenue lands in the bank within five days of the click.
The American Hospital Association’s Costs of Caring report documents how administrative costs keep climbing as a share of hospital and treatment center expenses.
Denials, prior authorizations, and revenue cycle work are the bulk of that load. In behavioral health, the same dynamic plays out at the per-admit level: every additional friction point compounds against the collected revenue side of the ledger.
In behavioral health, the lag between click and collected dollar runs 90 to 180 days, and the variance per admit is enormous.
Where billing failures hide in the marketing report
MOST COMMON MISUNDERSTANDING
Cost per admit looks stable in the marketing dashboard while collected revenue per admit is quietly compressing 20%. The marketing team reports the campaign is healthy. The CFO asks why revenue is soft. What actually happened: authorization rates dropped, lengths of stay shortened, per-admit value collapsed — but the marketing report treats every admit as equal value, so nothing lit up. If marketing and billing are not looking at the same weekly number, this pattern runs for a full quarter before anyone catches it.
Three patterns show up over and over when we look at client data side by side.
Pattern 1: Cost per admit is stable, but average collected revenue per admit is dropping.
The marketing dashboard says nothing changed. The CFO is asking why revenue is soft. What actually happened is that the billing partner’s authorization rates dropped, lengths of stay shortened, and the per-admit value compressed by 20 percent while the admit count held steady.
This pattern is one of the seven billing mistakes that quietly kill a treatment center’s census without ever showing up in the marketing report.
The Healthcare Financial Management Association’s 2026 reporting frames prior authorization automation as a strategic imperative for revenue cycle teams. Every prior auth that takes a day too long compresses the collected revenue side of the ledger in ways the marketing dashboard never sees.
Pattern 2: A specific channel produces admits that under-collect.
Sometimes a paid social campaign tunes toward an audience whose payer mix is heavier on out-of-state exchange plans. The admits look good on the surface. The collected revenue per admit on that channel is half what your branded search produces.
The campaign keeps running because the cost per admit looks fine. I have seen operators cut their best-performing channel based on cost per admit alone. The channel was actually subsidizing the rest of the program.
Pattern 3: The slow VOB no-show.
This one is invisible to almost every marketing report I have seen. A patient calls, the VOB takes six hours, they admit somewhere else.
There is no record of it on the marketing side because the conversion never fired. The billing side has no record either, because the patient was never theirs.
The ad spend that produced that call is just gone. It looks identical in your dashboard to the ad spend that produced an admit who completed a 60-day continuum.
What marketing teams should be looking at instead
THIS THESIS, PRODUCTIZED
The productized version of this argument is PayerLenz, built by Revenue Logic founder Kyle McHenry: a reimbursement intelligence platform that pushes what-the-payer-actually-pays data upstream into the eligibility and admissions decision. If RCM is a marketing problem, then the fix is putting rate data in the hands of the intake team before the bed is offered, not the billing team after the EOB posts. Disclosure: Webserv CEO Preston Powell is a co-founder of PayerLenz.
The shift here is not complicated. It is mostly a willingness to add a few columns to a report that already exists.
For every paid channel, marketing should be looking at three numbers in the same row. Cost per admit. Average collected revenue per admit, lagged 120 days. Cost per collected dollar.
 .077 cost per collected dollar. The Meta row shows ,200 cost per admit, ,000 average collected revenue per admit, and .178 cost per collected dollar. The Google Business Profile row shows ,100 cost per admit, ,000 average collected revenue per admit, and .018 cost per collected dollar. The Recovery.com row shows ,800 cost per admit, ,000 average collected revenue per admit, and .064 cost per collected dollar. The Psychology Today row shows ,900 cost per admit, ,000 average collected revenue per admit, and .211 cost per collected dollar. The cost-per-collected-dollar column is tinted brand red to mark it as the decision column. A top strip notes that most paid channel reports answer which channel produced calls, while the three-column report answers which channel produced collected revenue. A top-table callout notes that cost per admit only answers which channel produced admits and does not answer whether those admits reached the bank account. A bottom-table callout on the cost-per-collected-dollar column notes that this is the column that drives the budget decision and that a channel with a low cost per admit and a high cost per collected dollar is the channel marketing has been over-funding. A bottom strip carries the operational requirement: the data has to come from the billing system rather than the ad platform, which requires the marketing team to have a working relationship with whoever runs the revenue cycle management program inside the operator, whether that is an internal team or an external partner for rehabs and treatment centers.” class=”wp-image-25230″/>
The third number is the one that actually answers whether the channel is working. A channel can have a low cost per admit and a poor cost per collected dollar if the admits it produces are concentrated in payer types that under-perform.
A channel can also have a high cost per admit and an excellent cost per collected dollar if the admits it produces lean toward high-LTV policies and full continuums.
The data has to come from the billing system, not the ad platform. That requires the marketing team to have a working relationship with whoever runs the revenue cycle management program inside the operator, whether that is an internal team or one of the top behavioral health RCM partners.
The case for one weekly meeting
The fix is not a new dashboard. It is one recurring meeting where the marketing lead, the admissions director, and the billing partner sit in the same room with the same set of numbers in front of them.
Look at admissions count, average reimbursement per admit, length of stay, denial rate, and aging together. The patterns surface within two cycles.
Marketing finds out which channels are producing high-LTV admits. Admissions finds out which lead sources need a different qualification step before VOB. Billing finds out which payer mix shifts to flag back to marketing.
The cycle compounds. After three months of this meeting, the cost per admit number stops being the primary KPI. The cost per collected dollar takes its place. The channel mix shifts toward whatever is actually producing return, not whatever is producing volume.
This is the operating model behind Webserv’s billing capability and the reason we built the partnership across paid media, admissions ops, and RCM in the first place. The billing operations checklist covers the data layer that makes the meeting actionable.
The metric that actually matters
Cost per admit is the wrong number to improve against in this industry. Cost per collected dollar is the right one.
A $4,000 cost per admit on a $50,000 lifetime collected revenue is a great marketing program. A $3,500 cost per admit on a $32,000 lifetime collected revenue looks better in the report and is actually a worse program.
The first one wins on every metric that touches the bank account. Including yours. The second one wins every channel-cutting meeting that uses cost per admit as the headline number.
If your marketing reporting cannot tell those two scenarios apart, your marketing reporting cannot tell you what is actually working.
That is the part of revenue cycle management that lives in the marketing budget, not the billing budget. It is the part that determines whether a treatment center can keep paying for the things that fill its beds.
Frequently Asked Questions
Why should a marketing team care about revenue cycle management?
Marketing spend at a treatment center does not convert until the claim collects. Every billing failure between admit and collection (a denial, a short authorization, a missed VOB window) compresses the actual return on that ad spend without ever appearing in the marketing dashboard.
A channel that looks profitable on cost per admit can be losing money on cost per collected dollar if the admits it produces under-collect at the billing stage. The marketing team is the only group with the standing to shift the channel mix toward higher-collection patient types, but only if they can see the collection data.
In behavioral health, this gap between reported ROAS and collected ROAS routinely runs 30 to 50 percent. Marketing teams that operate blind to it are making channel decisions on numbers that have already failed.
What’s the right KPI for treatment center marketing if not cost per admit?
Cost per collected dollar. The denominator changes from “admits” to “actual collected revenue 120 days after admission” and forces the metric to absorb all the billing-stage attrition that cost per admit hides.
The number is lagged, which is the friction point most operators stumble on. A Q1 paid media decision based on cost per collected dollar means using Q4 of the prior year’s collection data, which feels uncomfortable until the operator realizes that cost per admit was always lagged too, just in a way that wasn’t visible.
Pair cost per collected dollar with cost per admit as a complementary metric. The two together tell the story neither one tells alone.
How do treatment center marketing teams get access to the collection data they need?
The data lives in the billing system, not the ad platform. The marketing lead needs a working relationship with the RCM team (internal or external) to pull collected revenue by patient, then map it back to lead source through the CRM.
The technical setup is straightforward once the access is granted. The harder part is the organizational shift. Marketing leads who have never sat in a billing meeting need to be in those meetings. Billing partners who have never thought of marketing as a partner need to start treating channel data as something they can act on.
The billing operations checklist for growing treatment centers covers the data foundation that makes this kind of cross-team reporting possible.
What’s the relationship between payer mix and marketing channel selection?
Different paid media channels produce different payer mixes by default. Branded search tends to produce higher-collection patients because the searcher is closer to ready and often has a specific facility in mind. Cold paid social and broad PMax campaigns tend to produce lower-collection patients because the audience is wider and less self-selected.
Marketing teams that ignore payer mix at the channel level end up tuning toward the wrong channels. The campaign with the lowest cost per admit can simultaneously be the campaign with the lowest cost per collected dollar (a great result) or the highest cost per collected dollar (a disaster), depending on which payers it pulls in.
The only way to know which is which is to look at collected revenue by channel, lagged 90 to 120 days. That comparison is the most actionable single report a treatment center marketing team can build.
How long does it take to see results from a marketing + RCM operating model?
The first patterns surface within two billing cycles, which usually means 60 to 90 days. The full operating model takes a quarter to install and a quarter to validate, so most operators see meaningful channel-mix shifts in months four through six.
The compounding part is what surprises most operators. After three quarters of running cost per collected dollar as the primary KPI, the channel mix has typically shifted enough that overall cost per collected dollar has dropped 20 to 35 percent, even though the cost per admit number may have climbed slightly.
The shift is uncomfortable in month one because the new KPI doesn’t match the old one. By month nine, the new KPI is the only one anyone trusts.
The marketing team is the only group with the standing to shift the channel mix toward higher-collection patient types, but only if they can see the collection data.
In behavioral health, this gap between reported ROAS and collected ROAS routinely runs 30 to 50 percent. Marketing teams that operate blind to it are making channel decisions on numbers that have already failed.