A treatment center we audited last quarter walked us through their Q1 panic move. The CFO had told the marketing team to cut paid social spend 30 percent because cost per admit had climbed from $3,400 to $4,800 over the prior two months.
The marketing team cut the spend on day one of Q2. The cost per admit climbed to $5,900 by mid-quarter. Admit volume dropped 47 percent. The CFO told the marketing team to cut another 20 percent.
We came in at the bottom of that spiral. The cost per admit was not a spend problem. It was a tracking and conversion path problem with a slow VOB workflow underneath it.
The fixes ran through nine specific levers across attribution, landing page, audience, creative, VOB speed, and the operating model between marketing and admissions. Six months later, cost per admit was at $2,900 with paid spend back at the original level.
Inside Webserv’s paid CRO program for treatment centers, we run this same nine-lever playbook with operators who are losing cost per admit ground without understanding why. A recent multi-brand portfolio engagement delivered a 35 percent cost-per-admit reduction on the flagship brand using the same nine moves.
This article walks through the nine moves in the order they actually matter. Most operators produce 20 to 40 percent reductions in cost per admit over 90 to 180 days by working through them systematically.
Key Takeaways
- Cutting paid spend rarely lowers cost per admit. It usually compresses admit volume faster than it cuts cost, which raises cost per admit further. The actual levers sit upstream in the conversion path and downstream in the operations.
- The nine moves below cluster into three areas: attribution and measurement fixes (Ways 1-2), conversion path optimization (Ways 3-6), and operational improvements between marketing and admissions/billing (Ways 7-9). The order matters because each move reinforces the next.
- Most operators producing high cost per admit have attribution leakage of 15 to 30 percent. The reported cost per admit number is wrong before any optimization work begins, which means optimization work targets the wrong levers.
- Heatmap-driven landing page structural fixes typically produce 20 to 60 percent conversion rate lift in behavioral health. The phone CTA invisible above the mobile fold is the single most common behavioral health landing page failure across the operators we audit.
- The marketing + admissions + billing weekly meeting is the operating model that compounds the other eight moves. Operators who skip the operating model rarely sustain the gains from any single tactical lever.
Why Cutting Spend Almost Never Lowers Cost Per Admit
$2,025
Cost per admit floor a small-budget Colorado paid media program hit in April 2026 — down 60.5% from $5,131 in March. Case study: NRT Behavioral.
<4 hours
Target VOB confirmation window that keeps admissions warm. Every hour past this drops close rate on OON residential leads by measurable percentage points.
15–30
Net-new creative concepts per month required to keep Meta and Google performance from decaying. Below this floor, cost per admit drifts up by default.
Cost per admit math has a denominator problem and a numerator problem. The denominator (admits) shrinks faster than spend when you cut paid budget because conversion paths have minimum efficient scale.
The numerator (cost) shrinks only by the dollar amount you cut, which is usually a small percentage of the total cost-per-admit picture once you include the lost admits that should have been free.
The math gets worse when there is attribution leakage in the funnel. If 20 percent of your admits are not being attributed to paid, cutting spend cuts the attributed admits but leaves the un-attributed admit volume invisible.
That makes the reported cost per admit look even worse than before, even though the underlying performance is the same.
The path out of the spiral is to fix the conversion path and the attribution layer first, then work the operational improvements that compound across both. The nine moves below walk through that path in the order that produces the most predictable returns.
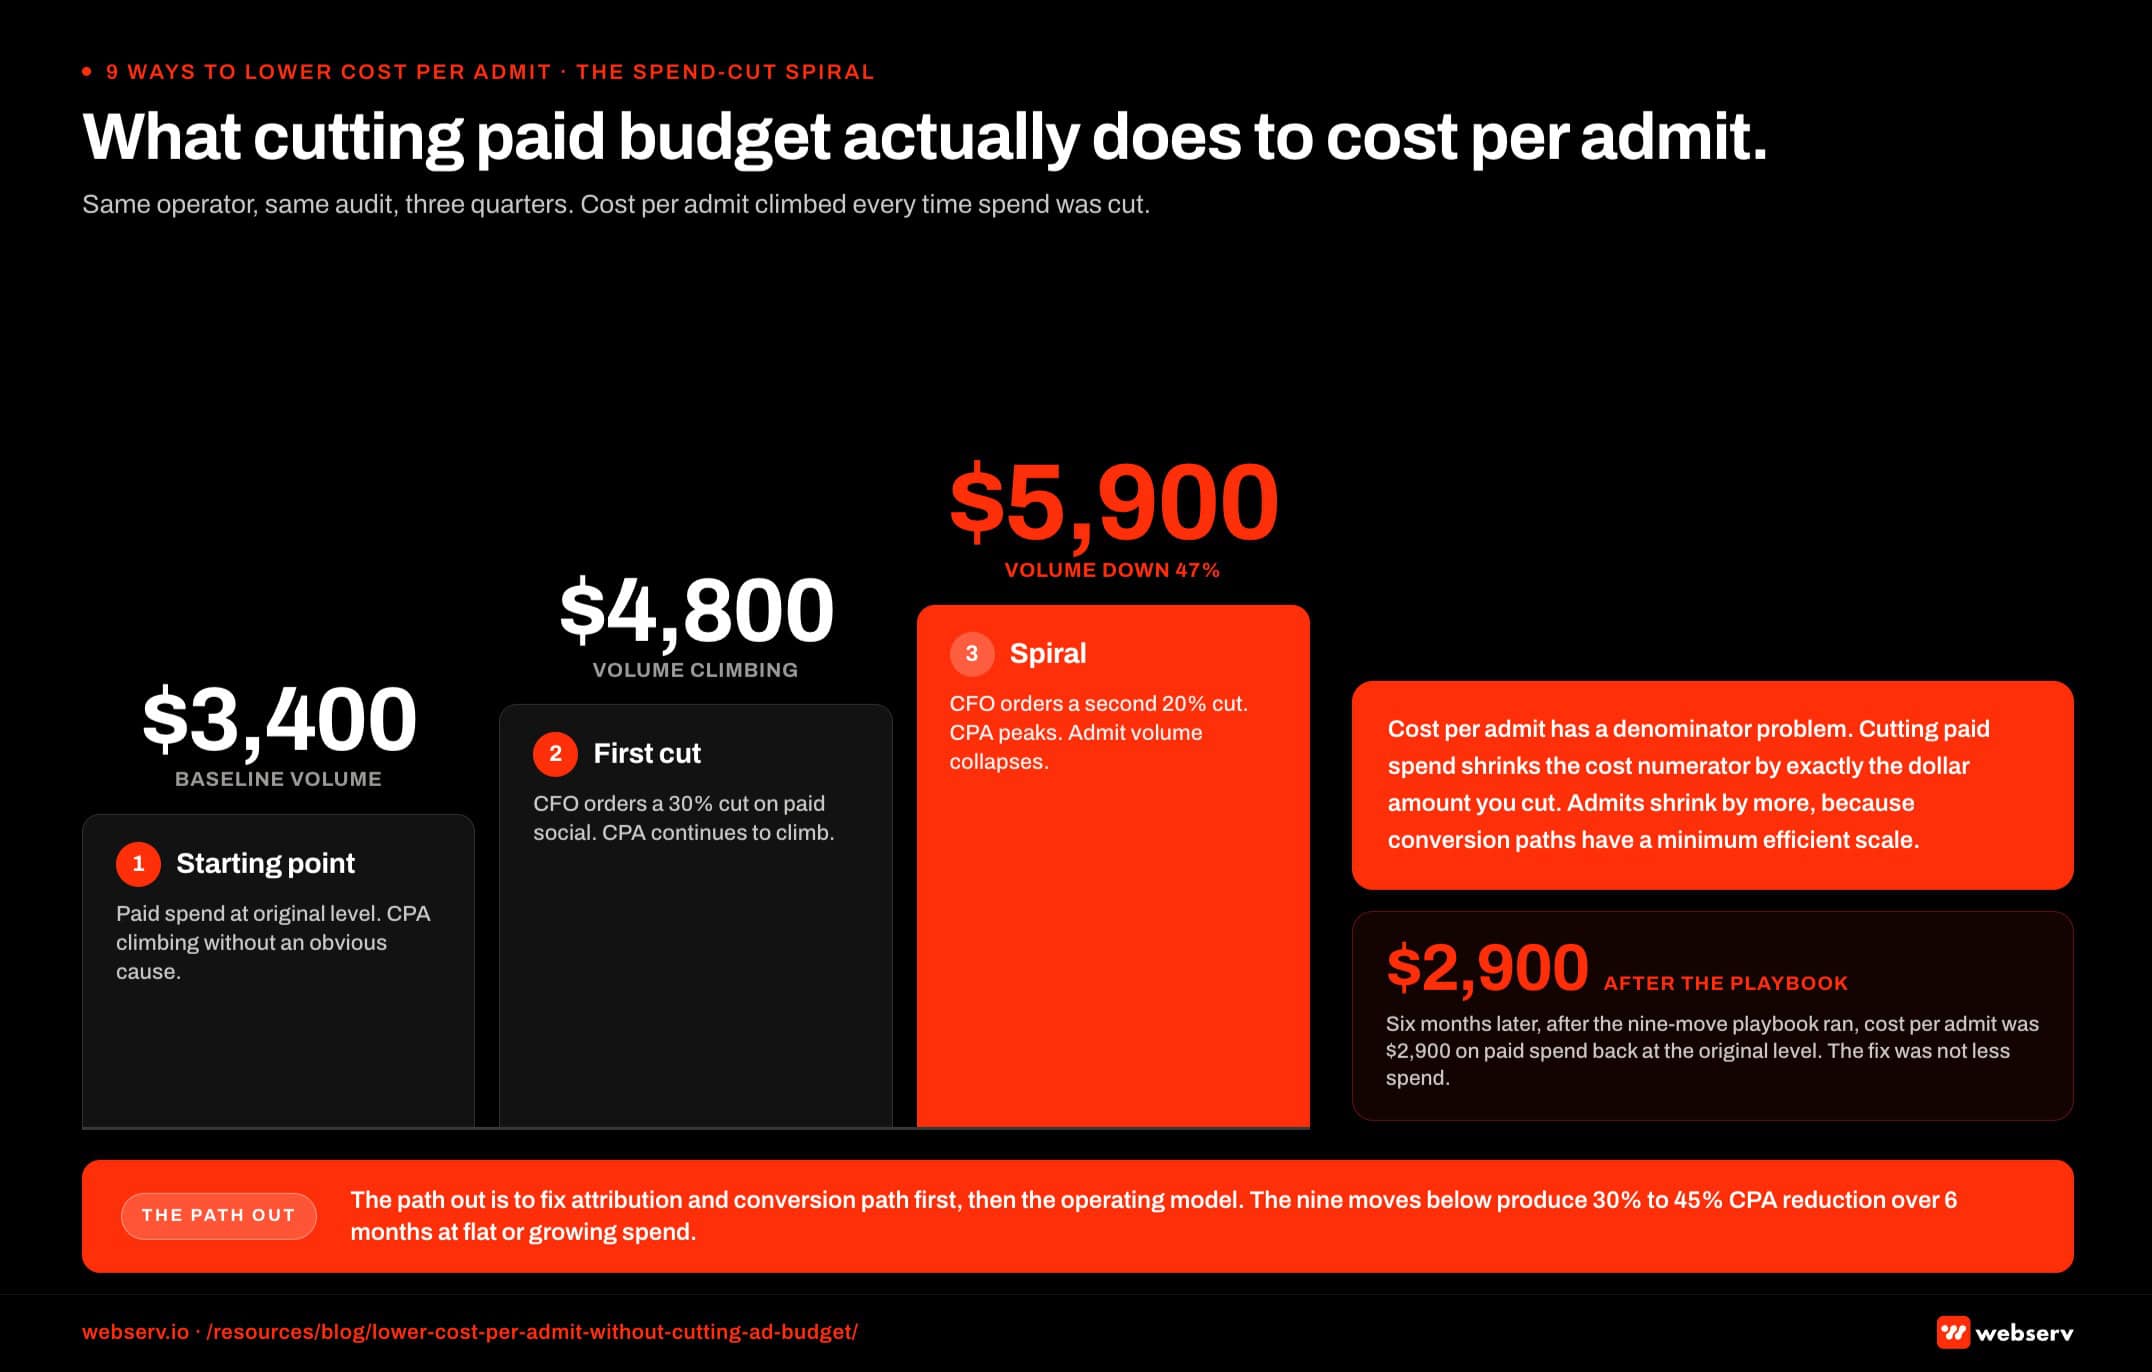 Three-step horizontal flow infographic titled ‘What cutting paid budget actually does to cost per admit.’ Starting state shows a treatment center with a $3,400 cost per admit at full spend. Step 2 shows the same center after a 30 percent spend cut: cost per admit rises to $4,800 with admit volume down 47 percent. Step 3 shows the same center 90 days later: cost per admit at $5,900 with admit volume down 62 percent. A footer band shows the playbook reset to a $2,900 cost per admit at the original spend level, illustrating that the denominator (admit volume) compresses faster than the numerator (spend) when budgets get cut.
1. Fix the Conversion Event Definition
Most operators count form fills as conversions. Form fills are not admits.
The cost per admit number that pulls from form-fill events is wrong by the gap between form-fill and admit conversion rate, which in behavioral health typically runs 8 to 20 percent (i.e., 5 to 12 form fills produce one admit).
The fix is to push admit events back to the ad platforms through Meta Conversions API and Google offline conversion uploads. Admit events fire when the patient is actually admitted in the CRM, not when the form is submitted.
The ad platforms then optimize against admits rather than form fills, which shifts spend toward the audiences that produce admits over 60 to 90 days.
This work has to respect 42 CFR Part 2 patient confidentiality rules for SUD treatment data.
Operators who make this single change typically see reported cost per admit drop 15 to 25 percent over 90 days even with no spend or creative changes. The reduction is partly real (algorithm optimization shifts spend better) and partly measurement honesty (the metric was wrong before).
This is the foundational move. The other eight do not work without this one in place first.
2. Plug the Form-to-CRM Attribution Leakage
Even after the conversion event is fixed, attribution typically leaks 15 to 30 percent of admits in behavioral health.
The leakage comes from broken UTM parameters, CRM fields that don’t capture lead source consistently, multi-touch journeys that lose the original attribution credit, and call-tracking integrations that don’t backfill into the ad platform.
The fix is a structured attribution audit. Map every conversion path from ad-click to form-submit to CRM-entry to admission. Identify where attribution drops and fix each gap.
CallRail-integrated call attribution plus Meta CAPI server-side events plus Google offline conversion uploads typically close the attribution gap from 15 to 30 percent leakage down to 5 to 8 percent.
The visible result is a cost per admit number that drops 10 to 20 percent on the same admit volume, because the attributed admit count climbs as the previously-invisible admits start showing up in the reporting.
Operators who run paid social or paid search without auditing attribution every 90 days are operating on a metric that is wrong by an unknown amount.
3. Restructure the Landing Page Around the Question-Shaped First Paragraph
The 2026 AI Mode citation pattern (models extract the sentence that most cleanly answers the user’s query) and the behavioral health landing page conversion pattern both point to the same structural change: the page’s opening 60 words should answer the implicit query directly.
For a treatment center landing page, this means the headline and first 40 to 60 words should name the service, the population, the modality, the location, and the unique angle.
Not in marketing copy. In direct, answer-shaped prose that a family member in crisis can read and immediately know whether this facility is right for them.
The lift from this single change runs 15 to 35 percent on conversion rate across the behavioral health operators we have implemented it with.
The reason is that family-member traffic to behavioral health landing pages is typically in a time-pressured, decision-making state. Pages that take 200 words to get to the answer lose that user to the page that answers in 50.
Our landing page optimization playbook for addiction treatment covers the structural rebuild in detail.
4. Heatmap-Driven CTA Visibility Fix
The phone CTA invisible above the mobile fold is the most common behavioral health landing page failure across the operators we audit.
Most behavioral health traffic is mobile, in crisis, time-pressured. If the phone CTA does not appear in the first viewport on a phone, the user scrolls past it or bounces.
The fix is heatmap work to identify where the CTA actually sits on mobile devices, then a structural redesign that puts the phone CTA in the top 200 pixels of the page above all secondary content.
Many operators want to lead with trust badges, accreditation logos, or testimonials. Those elements belong on the page but not in the first 200 pixels on mobile.
Operators who implement this fix typically see mobile conversion rate climb 20 to 60 percent within 30 days of the change going live.
The phone call volume increases first, the form submission volume increases more slowly, and the cost per admit drops as soon as the attribution layer (Way 2) catches up.
The Webserv approach to heatmap-driven CRO for rehab treats the heatmap data as the audit input that drives the structural redesign, not as a measurement artifact.
5. Audience Refinement Based on Actual Admit Data
Once Ways 1 and 2 are in place, the audience data flowing back to the ad platforms is actual admit data, not form-fill proxy data.
This opens up audience refinement that produces real cost-per-admit reductions.
The specific work involves three loops. First, identify which audience segments produce admits at above-average conversion rates and increase spend toward those segments.
Second, identify which audience segments produce form-fills but no admits and exclude them. Third, build lookalike audiences based on actual admit data rather than form-fill data, which produces lookalike seed quality materially better than the default.
The cost-per-admit reduction from disciplined audience refinement over 60 to 90 days typically runs 10 to 25 percent on the channels where the refinement is applied. The work compounds because every 30-day cycle produces a tighter audience signal than the prior cycle.
This work requires the conversion event fix in Way 1. Audience refinement on form-fill data optimizes toward the wrong outcome.
6. Creative Iteration at 15 to 30 Net-New Concepts Per Month
Creative fatigue is the silent cost-per-admit killer. The same ad set with the same creative produces declining performance after 4 to 6 weeks in market because the same audience sees the same creative multiple times and stops responding.
The fix is a sustained creative cadence at 15 to 30 net-new concepts per month for active behavioral health paid social programs. The cadence is not just volume.
It is structured testing: 2 to 3 concept families per month, 4 to 6 variations within each family, statistical evaluation at the family level rather than the individual creative level.
Operators who hit this cadence consistently see cost per admit stay flat or improve over 12 months. Operators who run 2 to 3 creative concepts per month total see cost per admit climb 5 to 10 percent quarter over quarter as the creative library ages out.
The compounding effect is real and most operators underestimate how much sustained creative investment matters.
The Meta ad formats that work for behavioral health in 2026 shifted enough in the last year that creative-library refresh has become a higher-priority investment than it was 24 months ago.
7. VOB Speed-to-Confirmation Under 4 Hours
The slow VOB no-show is the most expensive failure in behavioral health paid cost-per-admit that nobody attributes to marketing. A patient calls, the VOB takes 6 to 24 hours, the patient admits somewhere else.
The ad spend that produced the call counts against the marketing budget. The admit that didn’t happen doesn’t.
Industry observation suggests 15 to 25 percent of inquiry calls drop off when VOB takes longer than 4 hours.
Cutting VOB turnaround time to under 4 hours typically recovers 10 to 20 percent of previously-lost admits, which reduces cost per admit by the same percentage on the same paid spend.
The work to fix VOB speed sits in admissions, not marketing. But marketing should be measuring it and surfacing it to leadership when it’s not under control. The billing operations checklist for treatment centers treats VOB turnaround time as a marketing-attributable metric, not just a billing metric.
This is one of the moves where the operating model (Way 9) becomes load-bearing. Marketing teams that don’t have a standing relationship with admissions and billing don’t see this lever, much less pull it.
8. Payer-Mix-Aware Bidding
Not all admits produce equal collected revenue. A Cigna MRC1 admit produces materially different collected revenue than a Maine BCBS admit or a self-pay patient. Bidding the same on both produces a cost per admit number that does not reflect collected revenue.
Payer-mix-aware bidding pushes spend toward the audiences and channels that produce higher-collected-revenue admits. The implementation is not trivial. It requires CRM integration that feeds collected revenue back into the ad platform conversion value field, then bid strategies that optimize against value rather than admit count.
Operators who implement value-based bidding correctly see cost per collected dollar drop 15 to 30 percent over 90 to 180 days, even when cost per admit looks flat or slightly worse.
The metric that pays the bills is cost per collected dollar, not cost per admit. The American Hospital Association’s Costs of Caring research documents this gap at the broader healthcare administrative cost level.
It’s why the marketing-RCM operating model is central to this work.
9. The Marketing + Admissions + Billing Weekly Meeting
The single highest-impact move on this list is not a tactical move. It is the operating model that compounds the other eight.
A standing weekly meeting between the marketing lead, the admissions director, and the billing partner (with the same numbers in front of all three) surfaces the patterns that no single function can see alone.
Marketing sees which channels are producing high-LTV admits. Admissions sees which lead sources need a different qualification step before VOB. Billing sees which payer mix shifts to flag back to marketing.
Operators who run this meeting consistently for 90 days see two specific things happen. The cost per admit number stops being the primary KPI and cost per collected dollar takes its place. And the channel mix shifts toward whatever is actually producing return rather than whatever is producing volume.
The operating model is the part most operators skip because it doesn’t feel like a marketing move. It is the marketing move that compounds every other lever on this list.
The single biggest predictor of whether a treatment center can sustainably lower cost per admit is not which tactical lever they pull first. It is whether they install a marketing + admissions + billing operating cadence that surfaces the patterns no single function can see alone. The tactical moves matter. The operating model is what makes them stick.
Preston Powell, CEO of Webserv
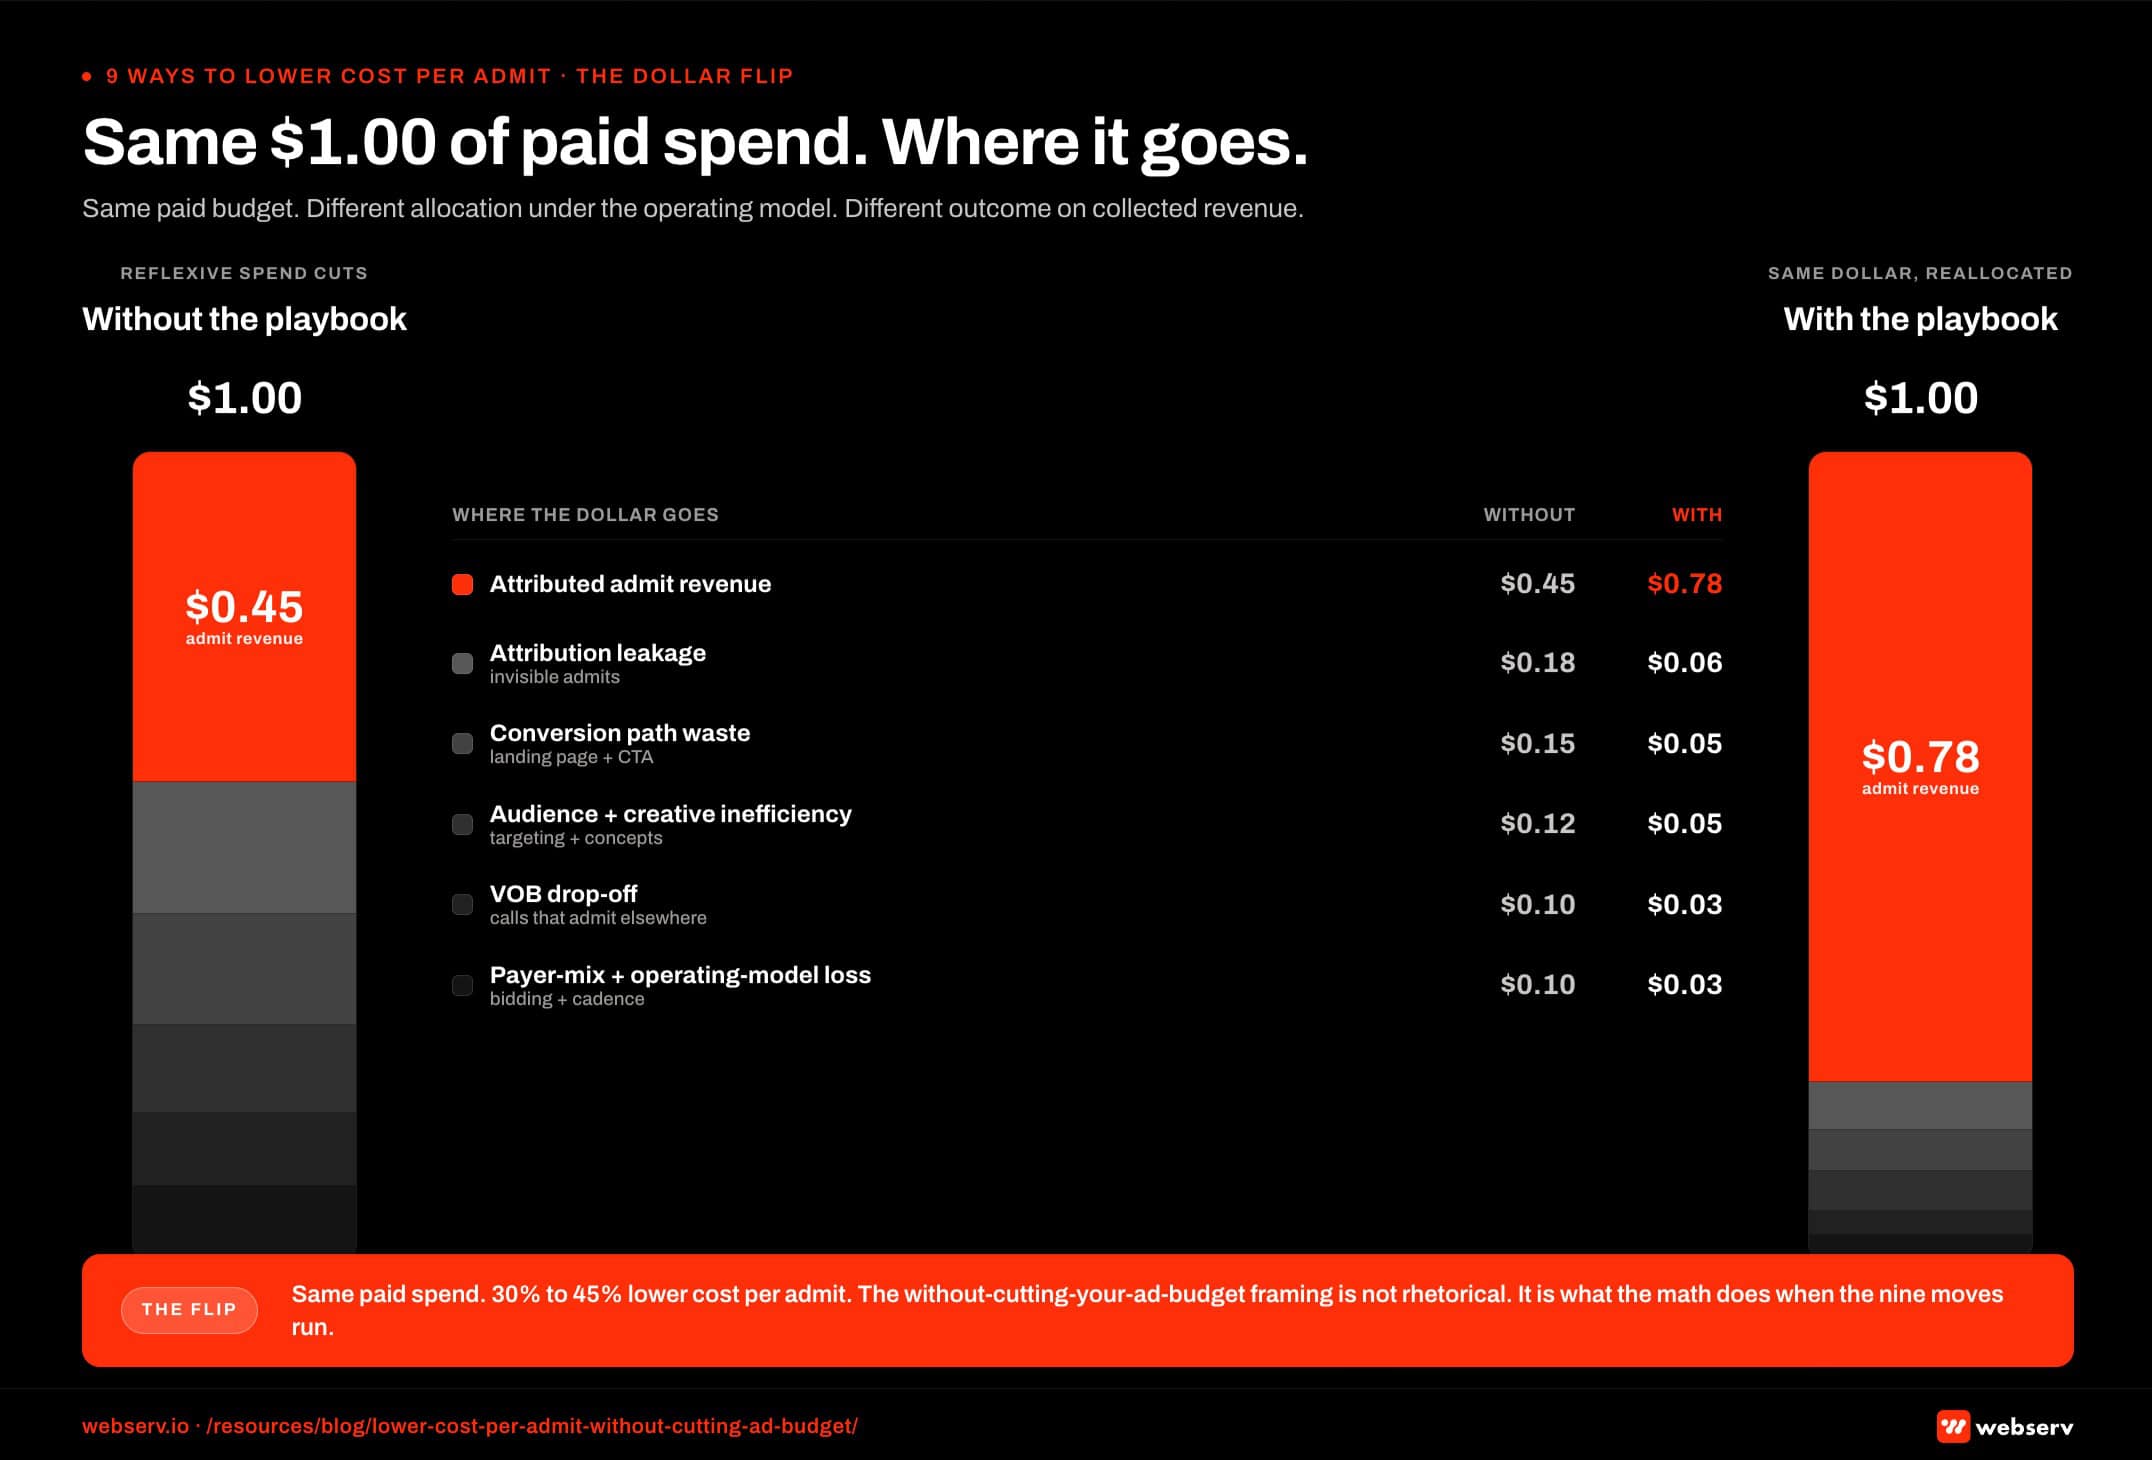 Side-by-side dollar-allocation infographic titled ‘Same $1 of paid spend, where it goes.’ Left column shows the current state: of every $1 spent, $0.45 reaches attributed admit revenue. Leakage breakdown: $0.18 lost to conversion-path waste, $0.15 lost to VOB drop, $0.12 lost to payer-mix loss, $0.10 lost to attribution gaps. Right column shows the optimized state after the nine-move playbook: $0.78 of every $1 reaches admit revenue, with leakage compressed to $0.08 conversion path, $0.06 VOB, $0.04 payer mix, and $0.04 attribution. The $0.33 net delta is achieved at the same paid spend level, illustrating the ‘without cutting your ad budget’ framing.
How to Sequence the Nine
The nine moves are not parallel work streams. They sequence in three phases over 90 to 180 days.
Days 1-30: Attribution and measurement foundation. Way 1 (conversion event definition) and Way 2 (attribution leakage audit) go first.
These are short-cycle wins that produce 15 to 30 percent reported cost-per-admit reduction within 30 days because the metric was wrong before. Without this foundation, the other seven moves optimize against the wrong number.
Days 30-90: Conversion path optimization. Way 3 (landing page restructure), Way 4 (heatmap-driven CTA visibility fix), Way 5 (audience refinement based on admit data), and Way 6 (creative iteration cadence) run in parallel during this phase.
The four moves compound on each other, with landing page work feeding back into audience and creative work as conversion data improves.
Days 60-180: Operational improvements. Way 7 (VOB speed), Way 8 (payer-mix-aware bidding), and Way 9 (weekly operating cadence) require cross-functional alignment that takes longer to establish.
These moves produce the durable, compounding cost-per-admit improvements over 12 to 24 months that the first two phases set the foundation for.
Operators who try to sequence in reverse (operating model first, then conversion path, then attribution) usually fail at the operating model because the data they bring to the weekly meeting is wrong. The data has to be right before the operating model has anything useful to surface.
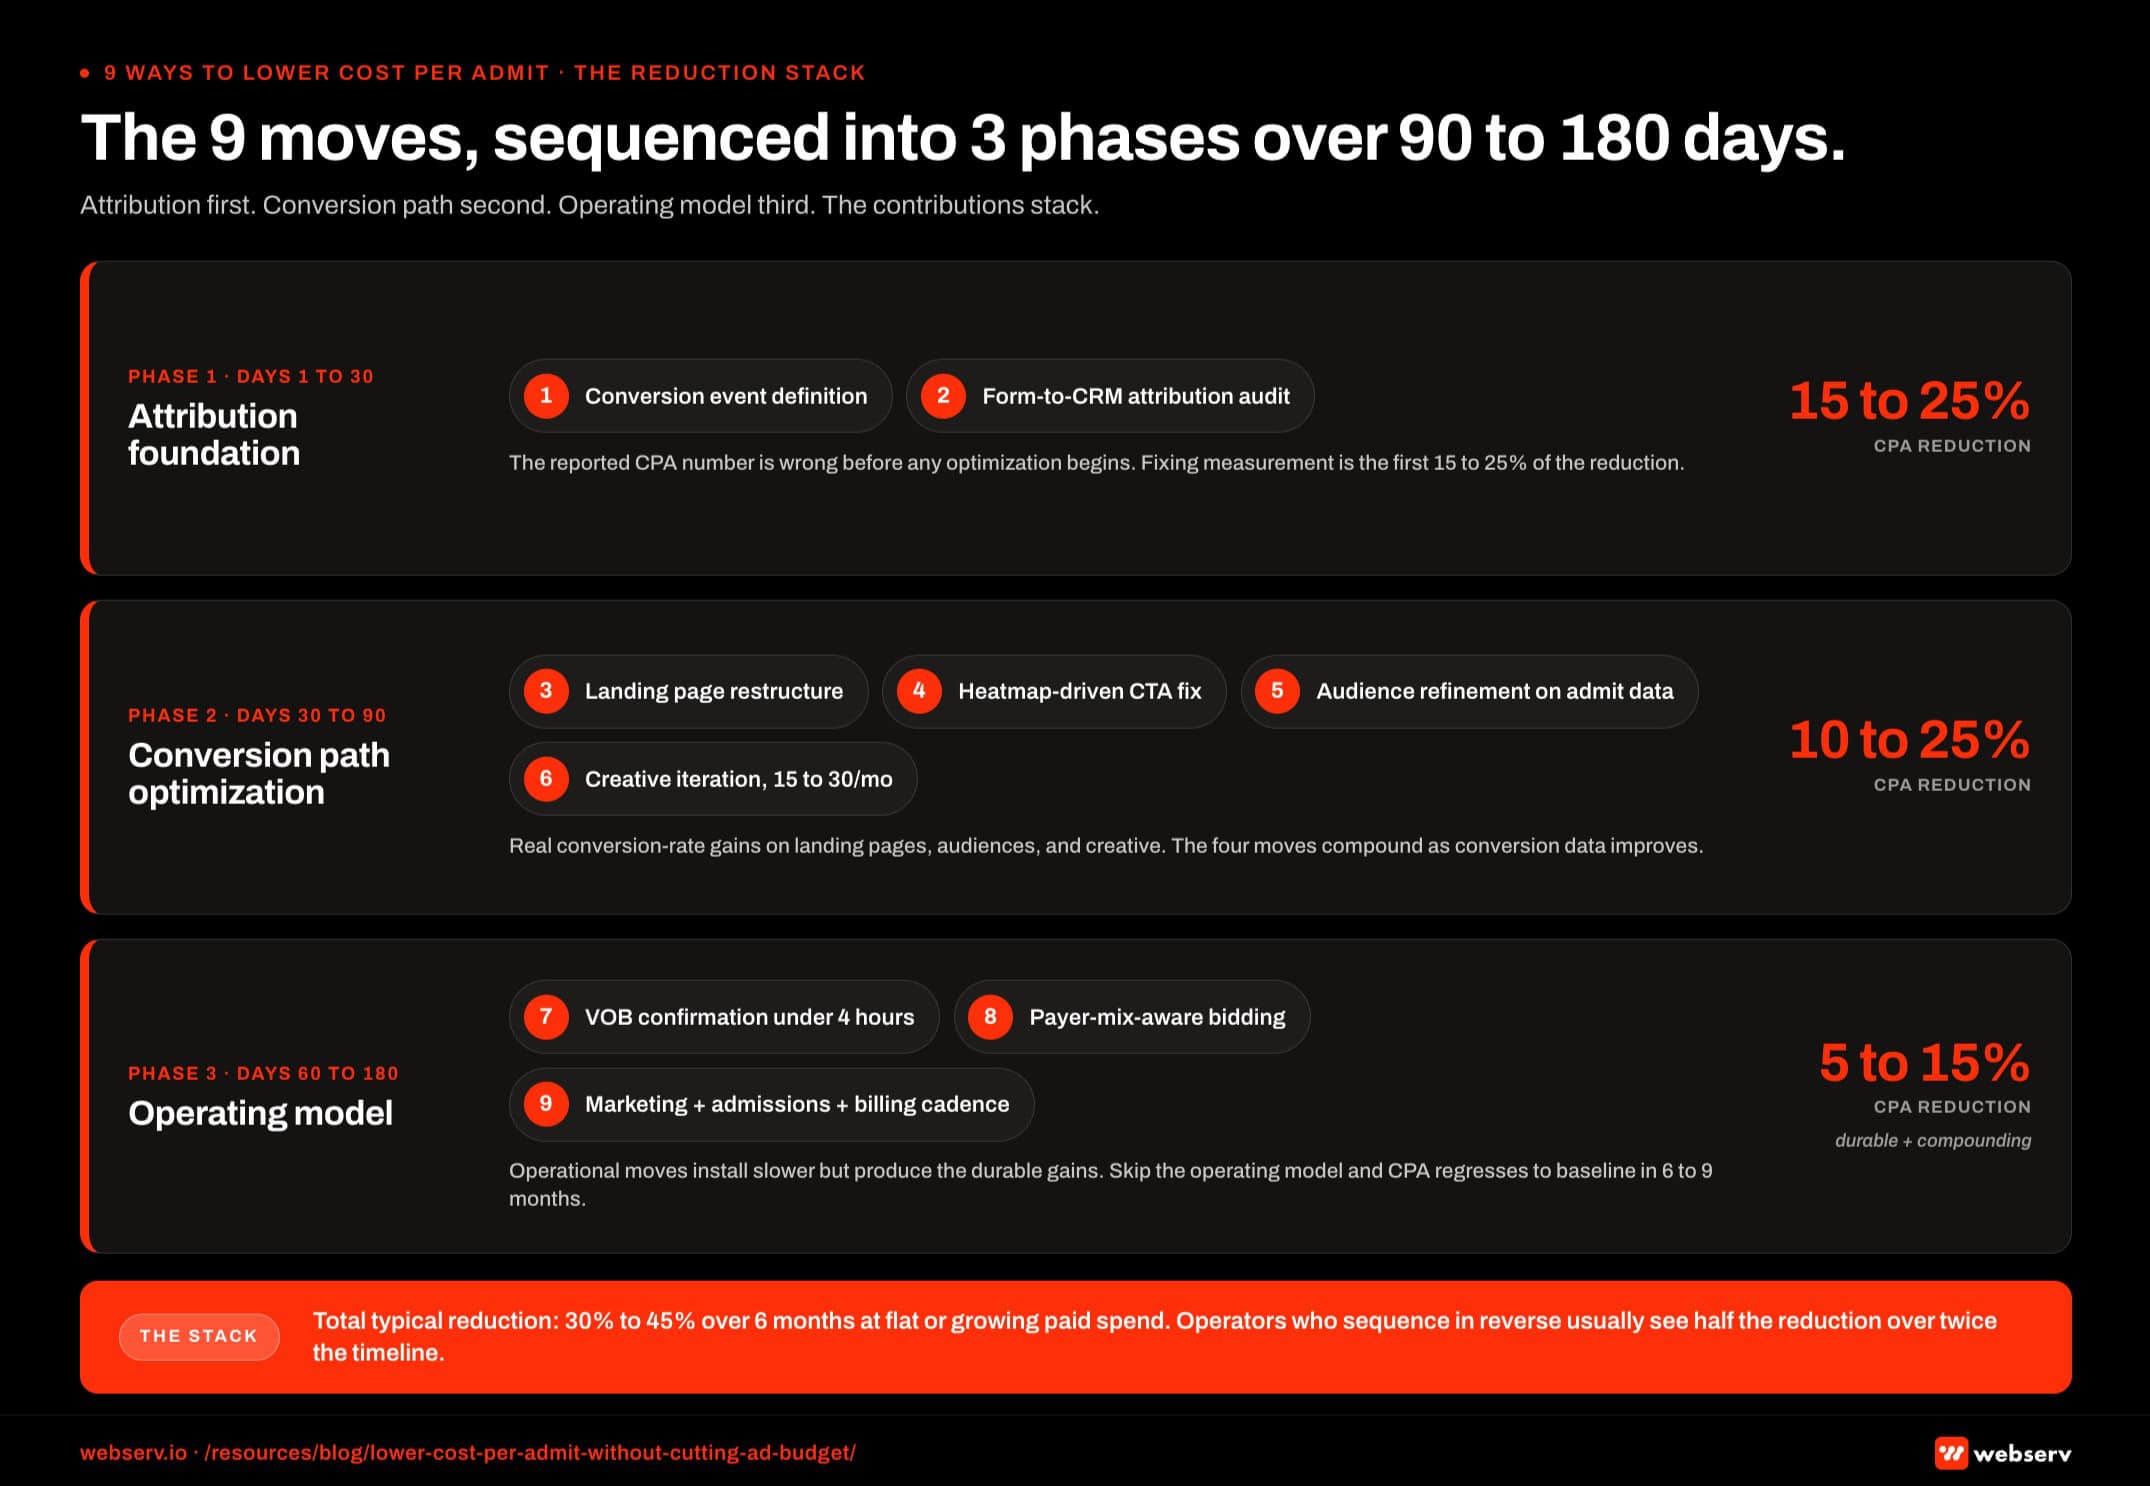 Three-band phased timeline titled ‘The nine moves sequenced into three phases.’ Phase 1 (days 0 to 30) covers moves 1 and 2 (conversion event definition and form-to-CRM attribution), with a typical 15 to 25 percent cost per admit reduction at flat spend. Phase 2 (days 30 to 90) covers moves 3 through 6 (landing page restructure, heatmap-driven CTA fix, audience refinement, and creative iteration), adding another 10 to 25 percent reduction. Phase 3 (days 90 to 180) covers moves 7 through 9 (VOB speed-to-confirmation, payer-mix-aware bidding, and the marketing-admissions-billing weekly meeting), adding 5 to 15 percent durable reduction. Total compounding reduction: 30 to 45 percent at the original spend level.
Frequently Asked Questions
Why does cutting paid spend usually make cost per admit worse, not better?
Cost per admit is a ratio of total cost to total admits. Cutting spend reduces the numerator by exactly the dollar amount you cut. The denominator (admits) reduces by more than that because paid social and paid search have minimum efficient scale: below a certain spend level, the algorithms produce less efficient audience targeting and the cost per admit goes up rather than down.
Most behavioral health paid social channels show this pattern in the $5,000 to $15,000 monthly spend range. Cutting from $20,000 to $14,000 monthly typically produces a 35 to 50 percent admit volume drop, not the 30 percent you cut. Cost per admit climbs 20 to 35 percent on the residual admits.
The path to lower cost per admit runs through optimization, not contraction. The nine moves in this article are the optimization work.
What’s the realistic timeline to see cost per admit drop after the optimization work starts?
Days 1-30: 15 to 25 percent reported cost-per-admit drop from attribution fixes (Ways 1-2). This is partly real and partly measurement honesty. Days 30-90: additional 10 to 25 percent reduction from conversion path optimization (Ways 3-6). This is mostly real conversion-rate improvement.
Days 90-180: final 5 to 15 percent reduction from operational improvements (Ways 7-9). This is durable, compounding cost-per-admit improvement.
Total typical reduction: 30 to 45 percent over 6 months. Some operators see larger reductions when the starting baseline has significant attribution leakage or landing-page structural issues. Operators who skip phases or sequence them out of order typically see half the reduction over twice the timeline.
What’s the cost to implement these nine moves?
The attribution work (Ways 1-2) typically costs $5,000 to $15,000 in setup work plus ongoing analytics maintenance. The landing page work (Ways 3-4) typically costs $8,000 to $25,000 for the structural rebuild plus heatmap tooling. The audience and creative work (Ways 5-6) is part of standard paid social agency retainer scope.
The operational work (Ways 7-9) is internal change-management work, not vendor spend. The cost is the leadership bandwidth required to install the weekly cross-functional meeting and the cross-functional data sharing that makes it useful.
Total implementation cost: typically $15,000 to $50,000 in setup work plus normal ongoing agency and tooling retainers. Most operators recover the implementation cost within 3 to 6 months through reduced cost per admit alone.
Which of the nine moves has the biggest single impact?
Way 1 (conversion event definition) typically produces the largest single-quarter cost-per-admit improvement (15 to 25 percent) because it fixes a measurement problem and a measurement-driven optimization problem at the same time.
Way 9 (weekly operating cadence) produces the largest 12-month compounding improvement because it sustains every other lever and surfaces new opportunities continuously. Operators who install the operating cadence consistently see cost per admit improve year over year for 24+ months. Operators who don’t install the operating cadence regress to the prior baseline within 6 to 9 months.
The biggest mistake is picking a single move and treating it as the solution. The nine moves work as a sequenced system, not as a tactical menu.
Do these nine moves work for paid search the same way they work for paid social?
Mostly yes, with two exceptions. The audience refinement work in Way 5 is more aggressive on paid social than on paid search because Meta’s audience modeling has more room to optimize than Google Ads keyword-based targeting does.
The creative iteration cadence in Way 6 is much more important for paid social than for paid search. Paid search creative (responsive search ads, expanded text ads, callouts) refreshes on a longer cycle than paid social creative does.
All other moves apply across paid search and paid social with equal weight. The attribution work (Ways 1-2) actually matters more for paid search because the keyword-to-admit conversion path tends to leak attribution at a higher rate than paid social does without explicit conversion tracking work.
How do we know if our cost per admit is actually high or if it’s just normal for our market?
Behavioral health cost per admit ranges in 2026 typically run $1,800 to $5,500 depending on payer mix, length of stay, geography, and platform mix. Within that range: below $2,500 is strong performance (verify the attribution layer is correct because numbers below $2,500 sometimes indicate measurement gaps rather than real efficiency). $2,500 to $4,000 is normal for most multi-facility operators with attribution working correctly.
$4,000 to $5,500 is higher than typical but workable. The nine moves typically produce meaningful reduction within 6 months. Above $5,500 is a diagnostic priority: it almost always indicates attribution leakage, conversion path failure, or operational dysfunction between marketing and admissions.
Cost per admit numbers above $6,000 in 2026 are almost always solvable by working through the nine moves above. The operators who think their cost per admit is “just high for the market” are usually the operators with the largest available improvement.
Run the Nine-Move Playbook Without Cutting Your Ad Budget
Cost per admit is one of the most misunderstood metrics in behavioral health paid media. Operators cut spend trying to lower it and usually make it worse. The actual levers sit upstream in attribution and conversion path, and downstream in the marketing-to-admissions operating model.
We run this nine-move playbook with treatment center operators who are losing cost per admit ground and want to fix it without burning admit volume. The work runs over 90 to 180 days and typically produces 30 to 45 percent cost-per-admit reduction at flat or growing spend.
Book an intro meeting to walk through your current cost per admit, where the attribution and conversion path leakage likely sits, and what the 90-day playbook would produce for your facility.
For the broader picture of how paid CRO fits inside a full treatment center marketing program, see our ultimate guide to behavioral health marketing.
Mitch Marowitz is Director of Paid Media at Webserv, where he leads paid search, paid social, and CRO programs for behavioral health and addiction treatment centers across the U.S. He writes about treatment-center paid media performance, creative testing, and the operational realities of running high-acuity healthcare campaigns.