Revenue cycle KPIs are the specific measurements that determine whether treatment center operations produce collected revenue at rates that support facility economics or leak revenue through gaps that never surface until year-end financial reporting. They sit inside our eligibility and reimbursement capability as the instrumentation layer that keeps the rest of the revenue cycle honest.
Facilities that measure the right revenue cycle KPIs on the right cadence typically identify and remediate revenue leakage within 30 to 60 days of onset. Facilities that measure only summary-level revenue typically discover leakage 90 to 180 days after it starts producing revenue impact.
The eligibility and reimbursement capability at Webserv operates against a specific KPI framework that surfaces the operational and financial signals that separate well-managed revenue cycles from underperforming ones. That framework sits alongside the broader revenue cycle management reference for rehab centers, which walks the workflow patterns the KPIs measure against.
The pattern I see across treatment center billing operations: the executive team tracks total collected revenue and days sales outstanding at a summary level, but the operational team does not have the specific KPI visibility that would surface upstream leakage before it hits the summary numbers.
The gap produces late detection of revenue cycle issues that could have been prevented with better upstream measurement.
This piece walks the specific revenue cycle KPIs treatment center operators need. The eight KPIs across four categories that cover the full revenue cycle, the measurement cadence that matches KPI type, and the benchmark values that separate well-managed from underperforming operations. Pairs with our denial management piece on the quality side and our OON reimbursement math piece on the financial side.
It also covers the specific dashboards that make KPIs visible to the right operational team members, and the common failure modes that produce KPI reporting without corresponding operational improvement. Full picture in our ultimate guide to behavioral health marketing.
Key Takeaways
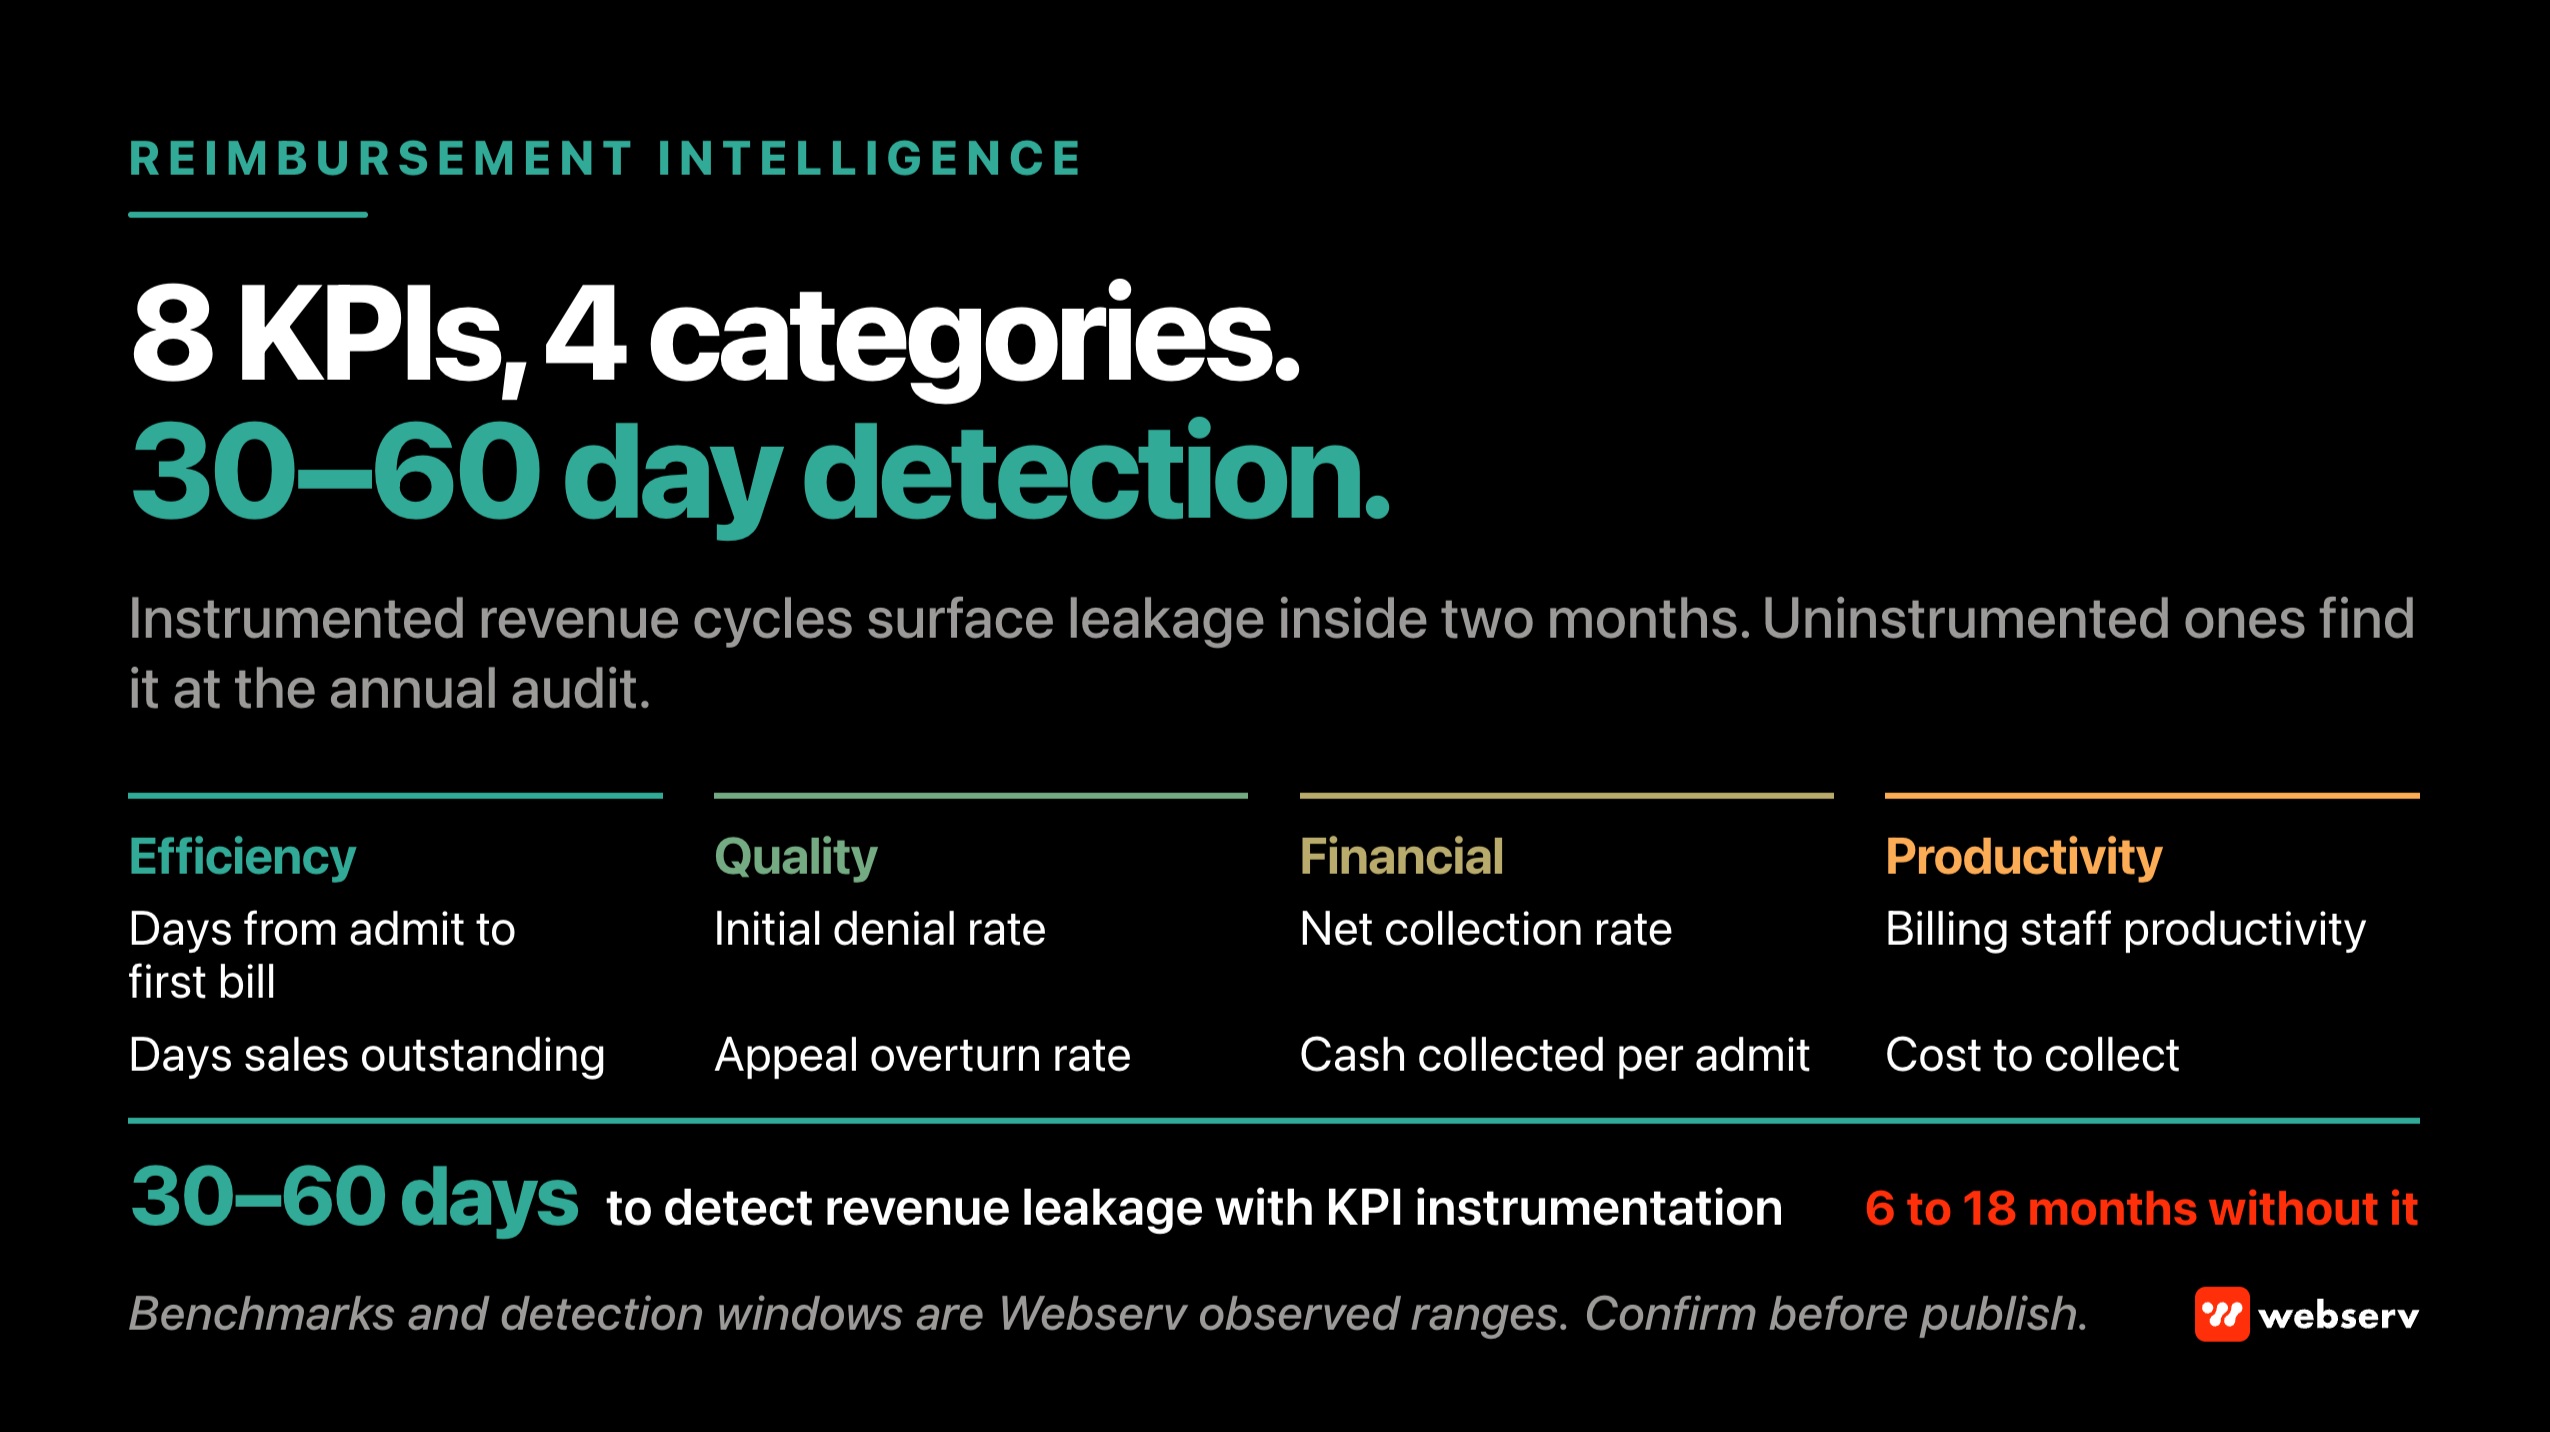
- Revenue cycle KPIs determine whether operational leakage gets detected and remediated within 30 to 60 days or accumulates until year-end financial reporting exposes it. Facilities without operational KPI visibility typically discover revenue cycle issues 6 to 18 months after they start producing revenue impact.
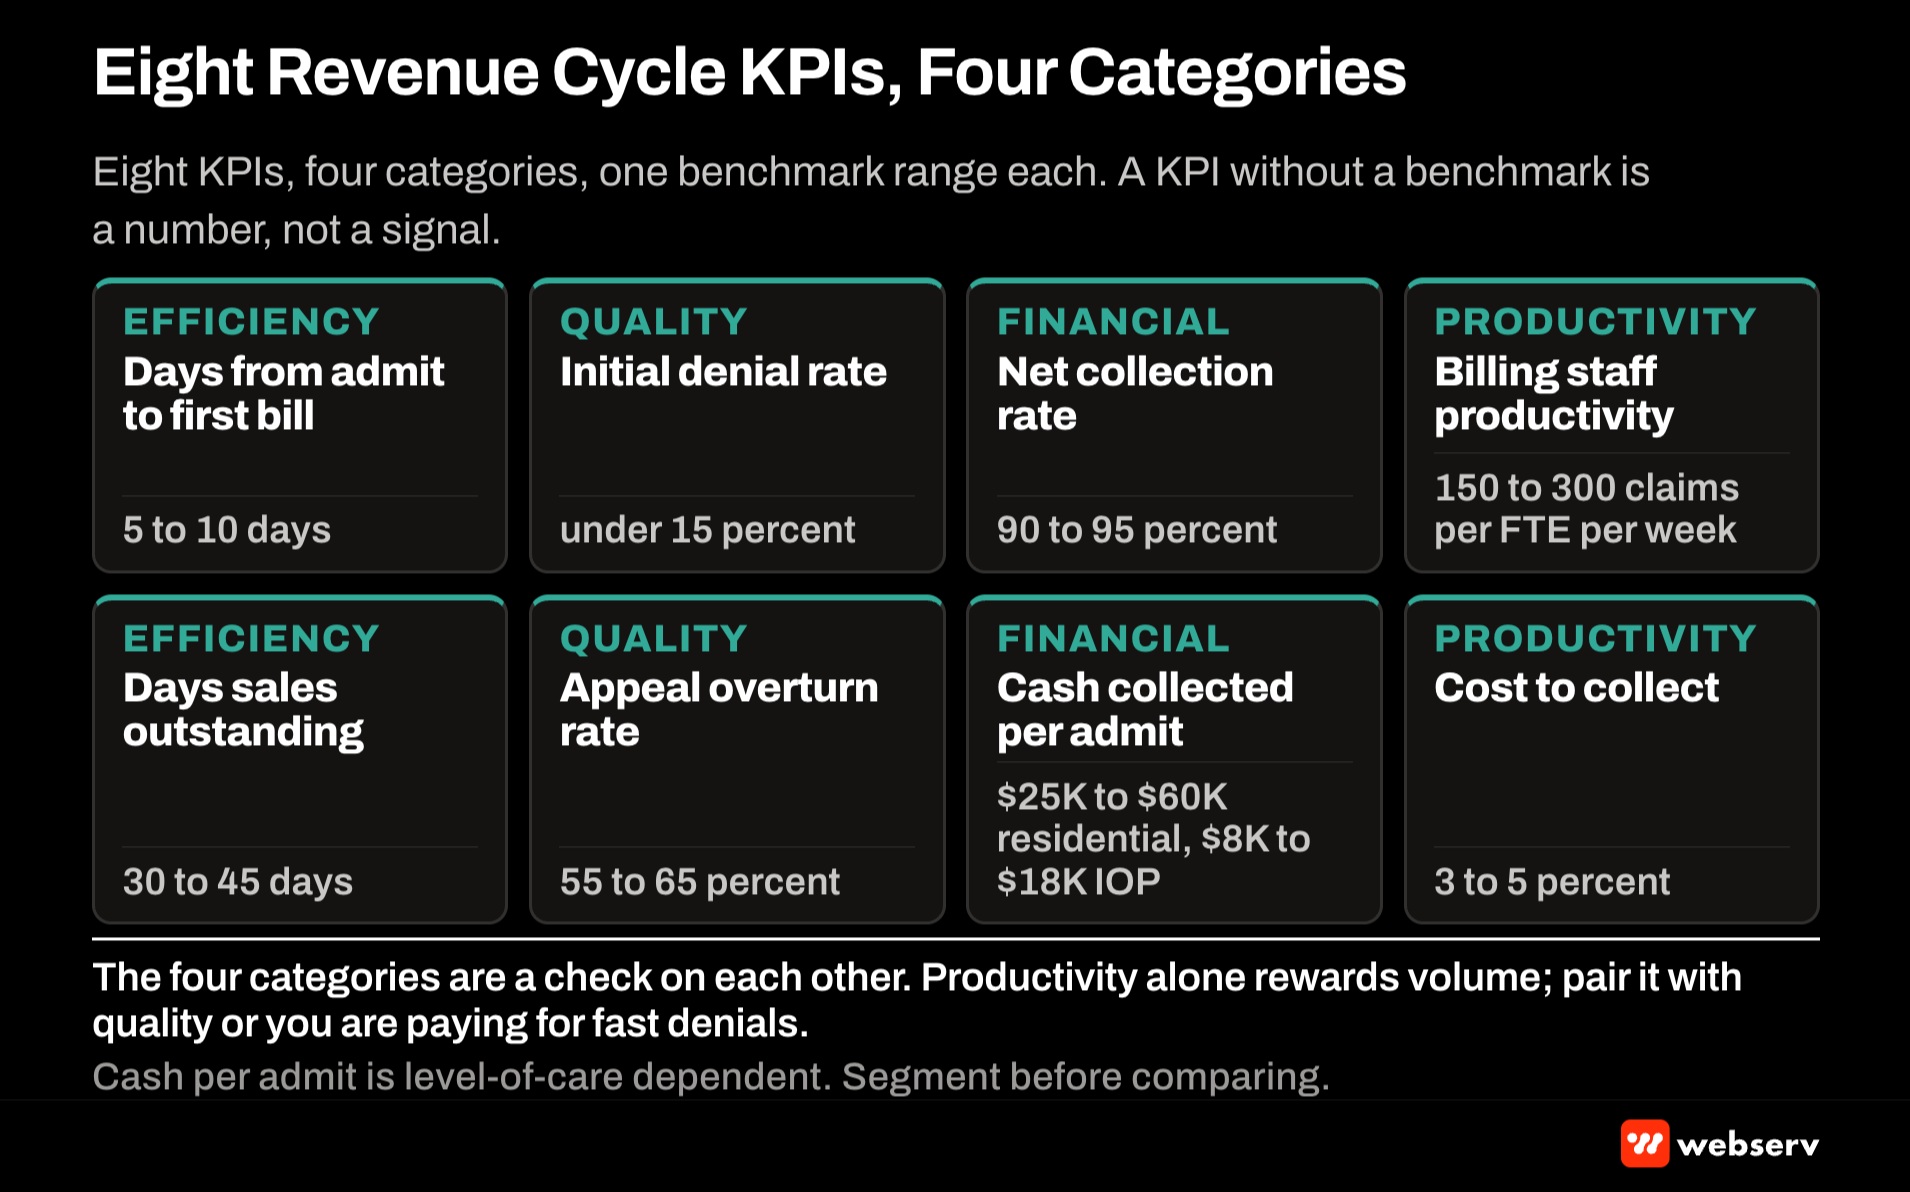
- The eight KPIs across four categories: efficiency (days from admit to first bill submission, days sales outstanding), quality (initial denial rate, appeal overturn rate), financial (net collection rate, cash collection per admit), and productivity (billing staff productivity, cost to collect).
- Measurement cadence matters as much as measurement itself. Efficiency KPIs benefit from weekly measurement. Quality KPIs benefit from bi-weekly measurement. Financial KPIs benefit from monthly measurement with quarterly trend analysis. Productivity KPIs benefit from monthly measurement.
- Benchmark values separate well-managed from underperforming operations. Net collection rate above 90 percent, initial denial rate below 15 percent, appeal overturn above 55 percent, days sales outstanding under 45 days, and cost to collect under 5 percent typically indicate well-managed operations.
- Common failure modes: KPI reporting without operational feedback (numbers get reported but do not drive improvement), too many KPIs (reporting overhead exceeds decision value), and wrong measurement cadence (weekly reporting on quarterly-cycle KPIs or quarterly reporting on weekly-cycle KPIs).
The eight KPIs across four categories
Eight KPIs cover the operational and financial signals that determine revenue cycle performance. Each KPI has a specific definition, a specific measurement cadence, and a specific benchmark.
Efficiency category
KPI 1: Days from admit to first bill submission. Average days from patient admission to first claim submission to the primary payer. Measures billing workflow efficiency at the front end of the revenue cycle.
Benchmark: 5 to 10 days for well-managed operations. Above 15 days typically signals workflow gaps in clinical documentation completion or coding workflow. Measurement cadence: weekly, rolling 30-day average.
KPI 2: Days sales outstanding (DSO). Average days from claim submission to payment receipt. Measures how long collected revenue takes to convert from billed to received.
Benchmark: 30 to 45 days for well-managed operations. Above 60 days typically signals payer relationship issues, appeal workflow gaps, or claim submission quality issues. Measurement cadence: monthly with rolling 90-day trend.
Quality category
KPI 3: Initial denial rate. Percentage of claims initially denied divided by total claims submitted. Measures upstream workflow quality (clinical documentation, coding, pre-authorization compliance).
Benchmark: under 15 percent for well-managed operations. Above 25 percent typically signals prevention workflow gaps that our denial management piece covers in detail. Measurement cadence: bi-weekly with monthly denial category breakdown.
KPI 4: Appeal overturn rate. Percentage of appealed denials that get overturned. Measures appeal workflow quality.
Benchmark: 55 to 65 percent for well-managed operations. Below 40 percent typically signals appeal preparation or clinical documentation issues. Measurement cadence: monthly with quarterly payer-specific breakdown.
DEFINITION
Revenue cycle KPIs for behavioral health treatment centers. The specific operational and financial measurements that track how well a treatment center converts delivered clinical services into collected cash. Eight KPIs across four categories (efficiency, quality, financial, productivity), each with a specific definition, measurement cadence, and benchmark values matched to facility level-of-care mix and payer mix.
Distinct from summary-level financial reporting (which reports total collected revenue and DSO without the upstream signals that predict them), distinct from ad-hoc denial analysis (which reacts to specific denials without measuring the pattern), and distinct from staff-level productivity tracking (which measures workload without measuring collection outcomes).
Financial category
KPI 5: Net collection rate. Cash collected divided by net expected revenue (billed revenue minus contractual adjustments minus estimated bad debt). Measures overall revenue cycle effectiveness.
Benchmark: 90 to 95 percent for well-managed operations. Below 80 percent typically signals systemic revenue cycle issues requiring comprehensive review. Measurement cadence: monthly with quarterly trend analysis by payer.
KPI 6: Cash collection per admit. Total cash collected divided by admit count. Measures facility economics on a per-admit basis. The OON reimbursement math piece walks the specific per-admit math for out-of-network facilities.
Benchmark: varies meaningfully by facility level of care mix and payer mix. Residential-heavy facilities with commercial-heavy payer mix typically produce $25,000 to $60,000 per admit. IOP-heavy facilities typically produce $8,000 to $18,000 per admit. Measurement cadence: monthly with quarterly LOC and payer segmentation.
Productivity category
KPI 7: Billing staff productivity. Claims processed per billing FTE per period. Measures billing workflow efficiency at the staff level. Persistent low productivity typically maps back to the operational patterns walked in our billing mistakes reference.
Benchmark: 150 to 300 claims per billing FTE per week for well-managed operations. Below 100 claims per FTE per week typically signals workflow inefficiency or staffing gaps. Measurement cadence: monthly with quarterly workflow analysis.
KPI 8: Cost to collect. Total revenue cycle operating cost divided by cash collected. Measures the financial efficiency of the revenue cycle function.
Benchmark: 3 to 5 percent for well-managed operations. Above 7 percent typically signals staffing or vendor cost inefficiency relative to collection outcomes. Measurement cadence: quarterly with annual comprehensive review.
OPERATOR INSIGHT
The pattern I see across treatment center billing operations: the executive team tracks total collected revenue and days sales outstanding at a summary level, but the operational team does not have the specific KPI visibility that would surface upstream leakage. When something breaks, it breaks quietly for months before it shows up in the summary numbers.
The gap produces late detection of revenue cycle issues that could have been prevented with better upstream measurement. Facilities that instrument the eight core KPIs on the right cadence typically catch the same issues in 30 to 60 days rather than 6 to 18 months, and the delta shows up in cash on hand rather than in the quarterly board deck.
Measurement cadence that matches KPI type
Different KPIs benefit from different measurement cadences. Wrong cadence produces either noise (weekly reporting on quarterly-cycle KPIs) or late detection (quarterly reporting on weekly-cycle KPIs).
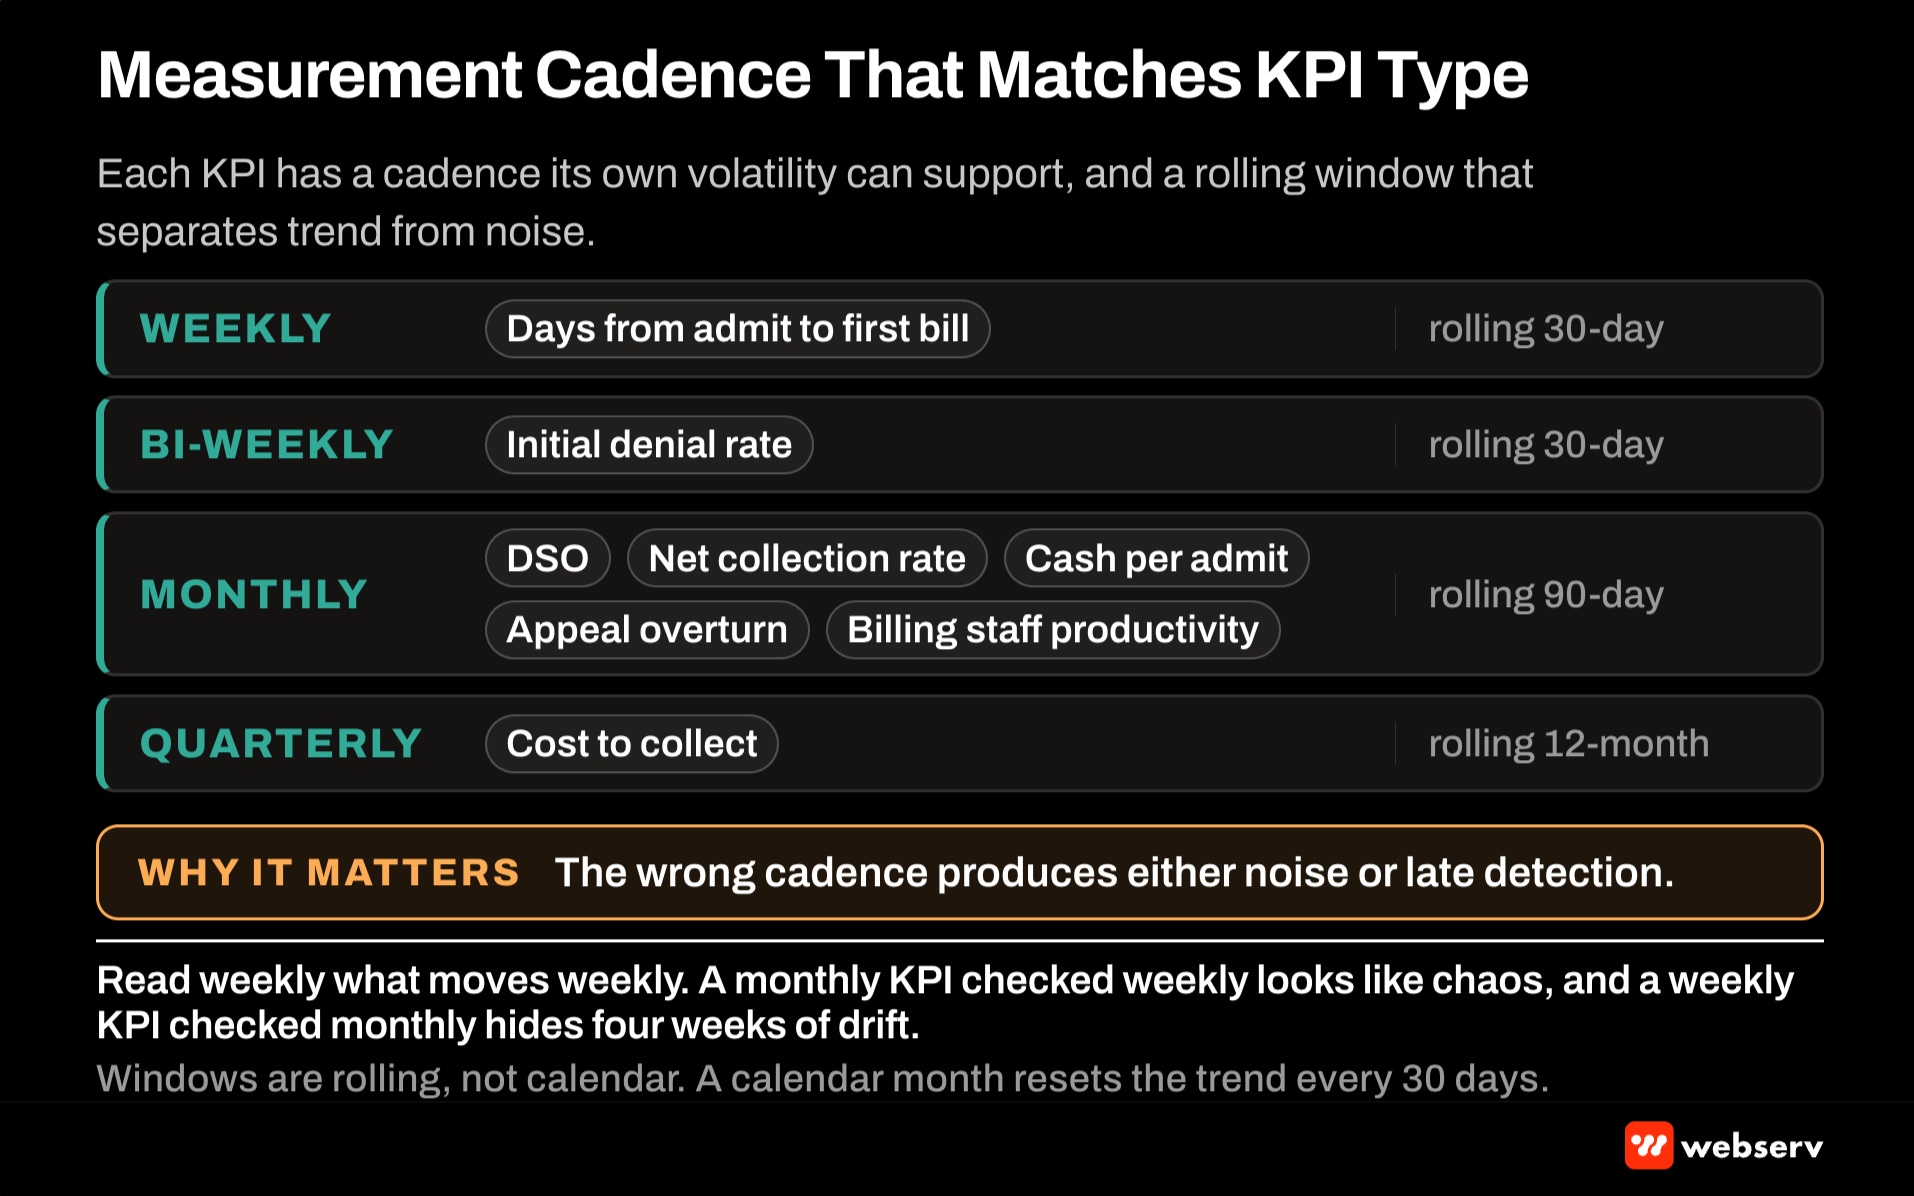
Weekly measurement. Days from admit to first bill submission. Weekly measurement catches submission workflow issues before they accumulate into meaningful backlog.
Bi-weekly measurement. Initial denial rate. Bi-weekly measurement provides enough denial volume for statistical stability while catching pattern shifts within 2 to 4 weeks.
Monthly measurement. DSO, net collection rate, cash collection per admit, appeal overturn rate, billing staff productivity. Monthly measurement matches the natural payment cycle for most payers and produces enough data for meaningful analysis.
Quarterly measurement. Cost to collect. Quarterly measurement matches the operational review cycle for staffing and vendor cost decisions.
Trend analysis windows. Rolling 30-day trends for weekly KPIs. Rolling 90-day trends for monthly KPIs. Rolling 12-month trends for quarterly KPIs. Trend analysis surfaces pattern shifts that single-period measurement misses.
The BH revenue cycle KPI framework at a glance
8 / 4
Core KPIs across efficiency, quality, financial, and productivity categories
30-60d
Detection window for revenue leakage with KPIs vs 6-18 months without
90-95%
Net collection rate benchmark for a well-managed BH revenue cycle
3-5%
Cost-to-collect benchmark for a well-managed BH billing function
Benchmark values by facility characteristics
Benchmark values vary by facility level of care mix, payer mix, and operational maturity.
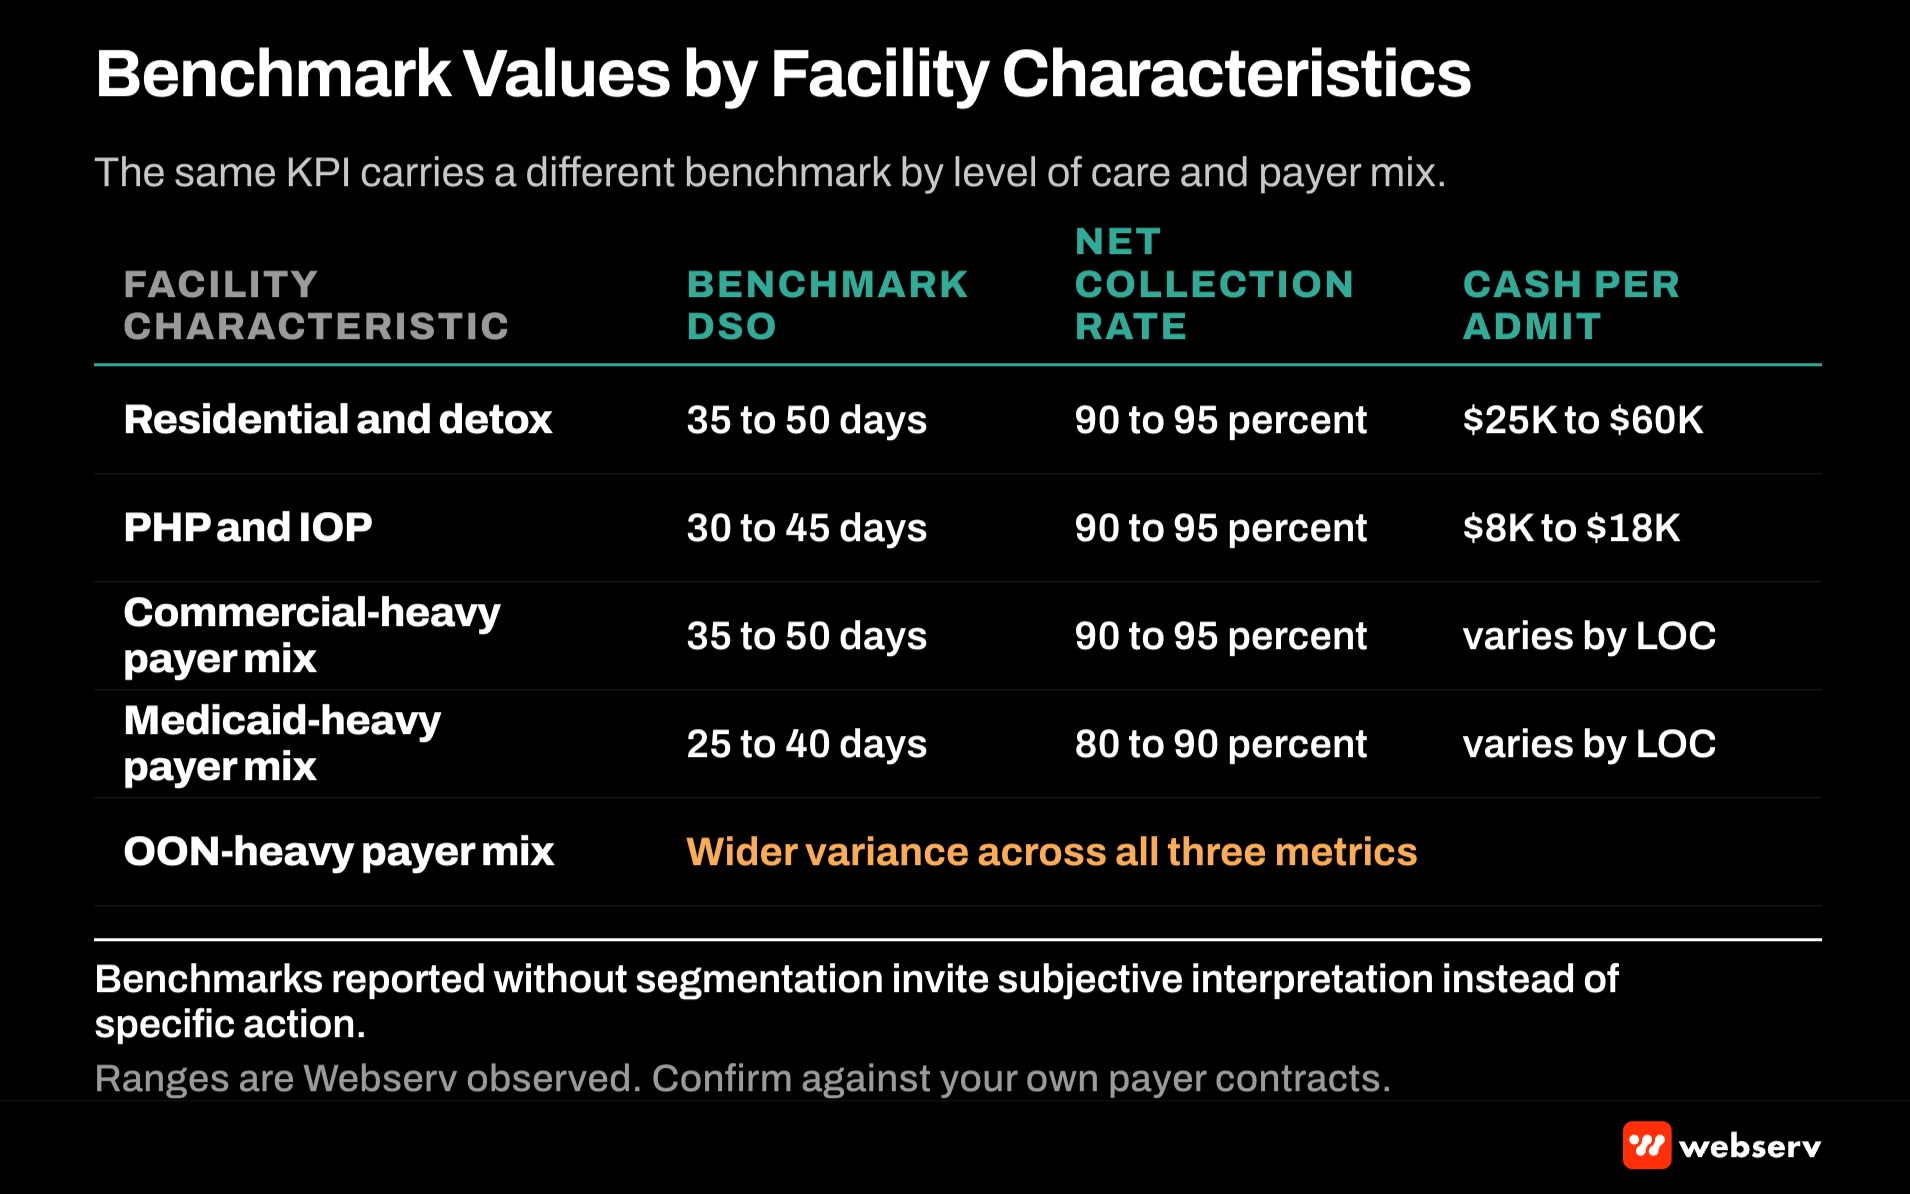
Residential and detox facilities. Higher per-admit revenue but longer DSO because payer processes for residential and detox typically involve concurrent review that extends payment cycles. Benchmark DSO: 35 to 50 days. Benchmark cash per admit: $25,000 to $60,000.
PHP and IOP facilities. Lower per-admit revenue but shorter DSO because outpatient claim processing typically moves faster than residential. Benchmark DSO: 30 to 45 days. Benchmark cash per admit: $8,000 to $18,000.
Commercial-heavy payer mix. Better net collection rate but longer DSO because commercial payers typically process claims more thoroughly than Medicaid. Benchmark net collection: 90 to 95 percent. Benchmark DSO: 35 to 50 days.
Medicaid-heavy payer mix. Faster DSO but lower net collection rate because Medicaid rates are typically lower than commercial and contractual adjustments compress collected revenue. Benchmark net collection: 80 to 90 percent. Benchmark DSO: 25 to 40 days.
OON-heavy payer mix. Higher variance across all KPIs because OON reimbursement depends on specific payer, patient plan, and appeal outcomes. Benchmark ranges wider than in-network-heavy operations. Our OON reimbursement math piece walks the specific variance patterns.
How a Tennessee treatment center tripled its paid media close rate and cut missed calls to 1%
Full CRM configuration, system integrations, and call tracking metrics unified a fragmented admissions process into a single high-converting workflow in two months.
Read the case study →Up from 17% — missed calls cut from 15% to 1%
Dashboards that make KPIs visible
KPI visibility requires dashboards that reach the specific operational team members who can act on the data.
Executive dashboard. Monthly view of financial category KPIs (net collection rate, cash per admit) plus quarterly trends. Executive-appropriate summary that supports strategic decision-making.
Operational dashboard. Weekly and bi-weekly view of efficiency and quality KPIs (days to first bill, initial denial rate, appeal overturn) plus daily submission volume metrics. Supports operational team decision-making.
Billing team dashboard. Weekly view of billing staff productivity plus individual claim status. Supports billing team workflow prioritization.
Payer-specific dashboards. Quarterly view of KPIs segmented by payer to identify payer-specific issues. Supports payer relationship management and contract negotiation.
The specific pattern that works: multi-layer dashboard architecture with role-appropriate KPI visibility at each layer. Facilities without role-appropriate dashboards typically produce KPI reporting overhead without corresponding operational improvement.
DO
- Instrument the eight core KPIs across efficiency, quality, financial, and productivity categories before layering in specialty metrics for specific deep-dives.
- Match measurement cadence to KPI type: weekly for days-to-first-bill, bi-weekly for initial denial rate, monthly for DSO and net collection, quarterly for cost to collect.
- Report every KPI with a benchmark value calibrated to the facility’s LOC mix and payer mix so the number carries context rather than just direction.
- Assign an owner and a threshold-breach action for every KPI so the report drives specific operational moves rather than sitting in a slide deck.
- Build multi-layer dashboards: executive view for financial KPIs, operational view for efficiency and quality KPIs, billing team view for productivity and daily submission.
DON’T
- Report 20+ KPIs; the reporting overhead exceeds decision value and the KPIs stop getting acted on.
- Report weekly on cost-to-collect or quarterly on days-to-first-bill; the cadence mismatch produces either noise or late detection.
- Report summary-level KPIs without payer, LOC, or facility segmentation; the segmented view is where the actionable patterns live.
- Report KPIs without benchmark comparison; a number without context invites subjective interpretation instead of specific action.
- Treat KPI reporting as an executive-only exercise; the operational team needs the same visibility on a different cadence to act on the signals.
Common failure modes
Five patterns produce revenue cycle KPI programs that report numbers without producing operational improvement.
Failure mode 1: KPI reporting without operational feedback loop. Numbers get reported to executives and operational team but do not drive specific workflow changes. Fix: every KPI has an owner, an operational action tied to threshold breach, and a review cadence.
Failure mode 2: Too many KPIs. Reporting 20+ KPIs produces overhead that exceeds decision value. Fix: focus on the eight core KPIs, expand only for specific operational deep-dives.
Failure mode 3: Wrong measurement cadence. Weekly reporting on quarterly-cycle KPIs produces noise. Quarterly reporting on weekly-cycle KPIs produces late detection. Fix: match cadence to KPI type per the framework above.
Failure mode 4: Benchmark ignorance. Reporting KPIs without benchmark comparison produces numbers without context. Fix: every KPI reported with specific benchmark values matched to facility characteristics.
Failure mode 5: Segmentation blindness. Reporting summary KPIs without payer, LOC, or facility segmentation hides patterns that segmentation would surface. Fix: monthly summary reporting plus quarterly segmentation analysis.
Most in-house teams hit a wall not because they lack knowledge, but because they lack bandwidth.
When you are ready to hand it off, Webserv has spent 9 years executing exactly this for treatment centers nationwide.
Frequently Asked Questions
How much does revenue cycle KPI reporting cost to implement?
Between $15,000 and $60,000 for initial implementation, depending on existing dashboard infrastructure and specific KPI segmentation depth.
The specific breakdown: 20 to 40 hours on KPI definition and calculation methodology, 30 to 60 hours on dashboard development, 10 to 20 hours on integration with billing systems and CRM, and 5 to 15 hours on training operational team members on KPI use.
Ongoing costs: dashboard maintenance typically 4 to 8 hours per month plus quarterly KPI review sessions with operational team.
Do we need specialized revenue cycle software for KPI reporting?
Not required but meaningfully helpful. Specialized revenue cycle platforms (Waystar, Change Healthcare, PayerLenz for reimbursement intelligence) typically produce built-in KPI reporting that reduces custom dashboard development.
Facilities using EHR-integrated billing (KIPU, BestNotes, Sunwave) typically have some KPI reporting built into the platform with facility-specific customization needed for comprehensive coverage.
Facilities running billing on general practice management software typically require more custom dashboard development to produce the KPI visibility described in this framework.
How often should operational team members look at revenue cycle KPIs?
Weekly for efficiency and quality KPIs (billing team leads, revenue cycle manager). Monthly for financial and productivity KPIs (revenue cycle manager, CFO, operations leadership).
Executive team typically reviews financial category KPIs monthly and full KPI framework quarterly.
Facilities that review KPIs less frequently typically detect issues later than facilities with weekly operational review cadence.
How do we improve underperforming KPIs?
Depends on which KPI is underperforming. Slow days-to-first-bill typically improves through clinical documentation workflow discipline, coding staff training, and specific SLA tracking on billing workflow steps.
High initial denial rate typically improves through prevention workflow (clinical documentation, pre-authorization, coding accuracy) as covered in our denial management piece and the older claim denial reduction reference.
Low appeal overturn typically improves through appeal preparation training, clinical documentation strengthening, and payer-specific appeal expertise development. Low net collection rate typically requires comprehensive review across all upstream KPIs to identify the specific leakage points.
How does revenue cycle KPI reporting interact with marketing attribution?
Directly. Revenue cycle KPIs measure what happens after admits arrive. Marketing attribution measures what produced the admits. Both together produce the specific cost-per-admit and admit-revenue attribution that supports marketing allocation decisions. Our ultimate guide to behavioral health marketing covers the marketing side of the same equation.
The specific integration pattern: marketing spend produces cost-per-admit at inquiry level. Revenue cycle produces collected revenue at admit level. Cost-per-admit divided by collected revenue per admit produces the specific marketing ROI that supports channel allocation decisions.
Facilities without integrated revenue cycle and marketing KPI reporting typically produce marketing decisions that ignore the specific revenue realities of different admit sources.
What is the specific relationship between KPIs and the pre-admission eligibility workflow?
Direct. Pre-admission eligibility work affects initial denial rate (KPI 3), appeal overturn rate (KPI 4), and net collection rate (KPI 5) through the specific documentation and workflow quality it produces.
The specific pattern: strong pre-admission eligibility workflow reduces initial denial rate, reduces appeal volume, and improves net collection rate. Weak pre-admission eligibility workflow inflates downstream KPI issues that appear in denial and appeal metrics.
Our pre-admission eligibility verification playbook covers the specific workflow that produces the KPI outcomes, and the VOB vs pre-authorization guide covers the front-door decisions that feed into it. KPI measurement then validates whether the workflow is producing intended results.
How does the KPI framework work for portfolio operators with multiple facilities?
Facility-level KPI reporting plus portfolio-level rollup. Each facility runs the full KPI framework with facility-specific dashboards. Portfolio-level rollup produces cross-facility comparison and identifies facility-specific outlier patterns.
The specific integration: portfolio dashboard shows KPI performance across facilities with facility-level drill-down. Facility comparison surfaces best-practice patterns from top-performing facilities that can transfer to underperforming facilities.
Portfolios that run KPI reporting only at facility level miss cross-facility learning opportunities. Portfolios that run KPI reporting only at portfolio level miss facility-specific action patterns.
Kyle McHenry is the founder of Revenue Logic and co-founder of PayerLenz and Webserv. His work focuses on the reimbursement intelligence and eligibility workflows that treatment center admissions and billing teams run.