Admissions is a 24/7 business running on 9-to-5 information. That is the gap PayerLenz was built to close.
When an owner calls me on Sunday night to say three solid referrals came in over the weekend and admissions could not verify anything, that phone call is the whole problem in one scene.
Two of the three went to whoever picked up the phone Monday morning and said yes first. The third got admitted blind under census pressure, and the reimbursement that came back sixty days later did not match anything anyone had expected at the point of admit.
Neither outcome had to happen. Both are what happens when treatment center admissions operations run on eligibility data without rate intelligence attached to it.
The specific claim I make on the rate intelligence layer is one that most rehab operators have never had a defensible number for. PayerLenz’s expected reimbursement estimates land within 10% of what the payer actually pays about nine times out of ten.
That is a defensible accuracy number, backed by adjudicated claims data across more than a million datapoints in the pool.
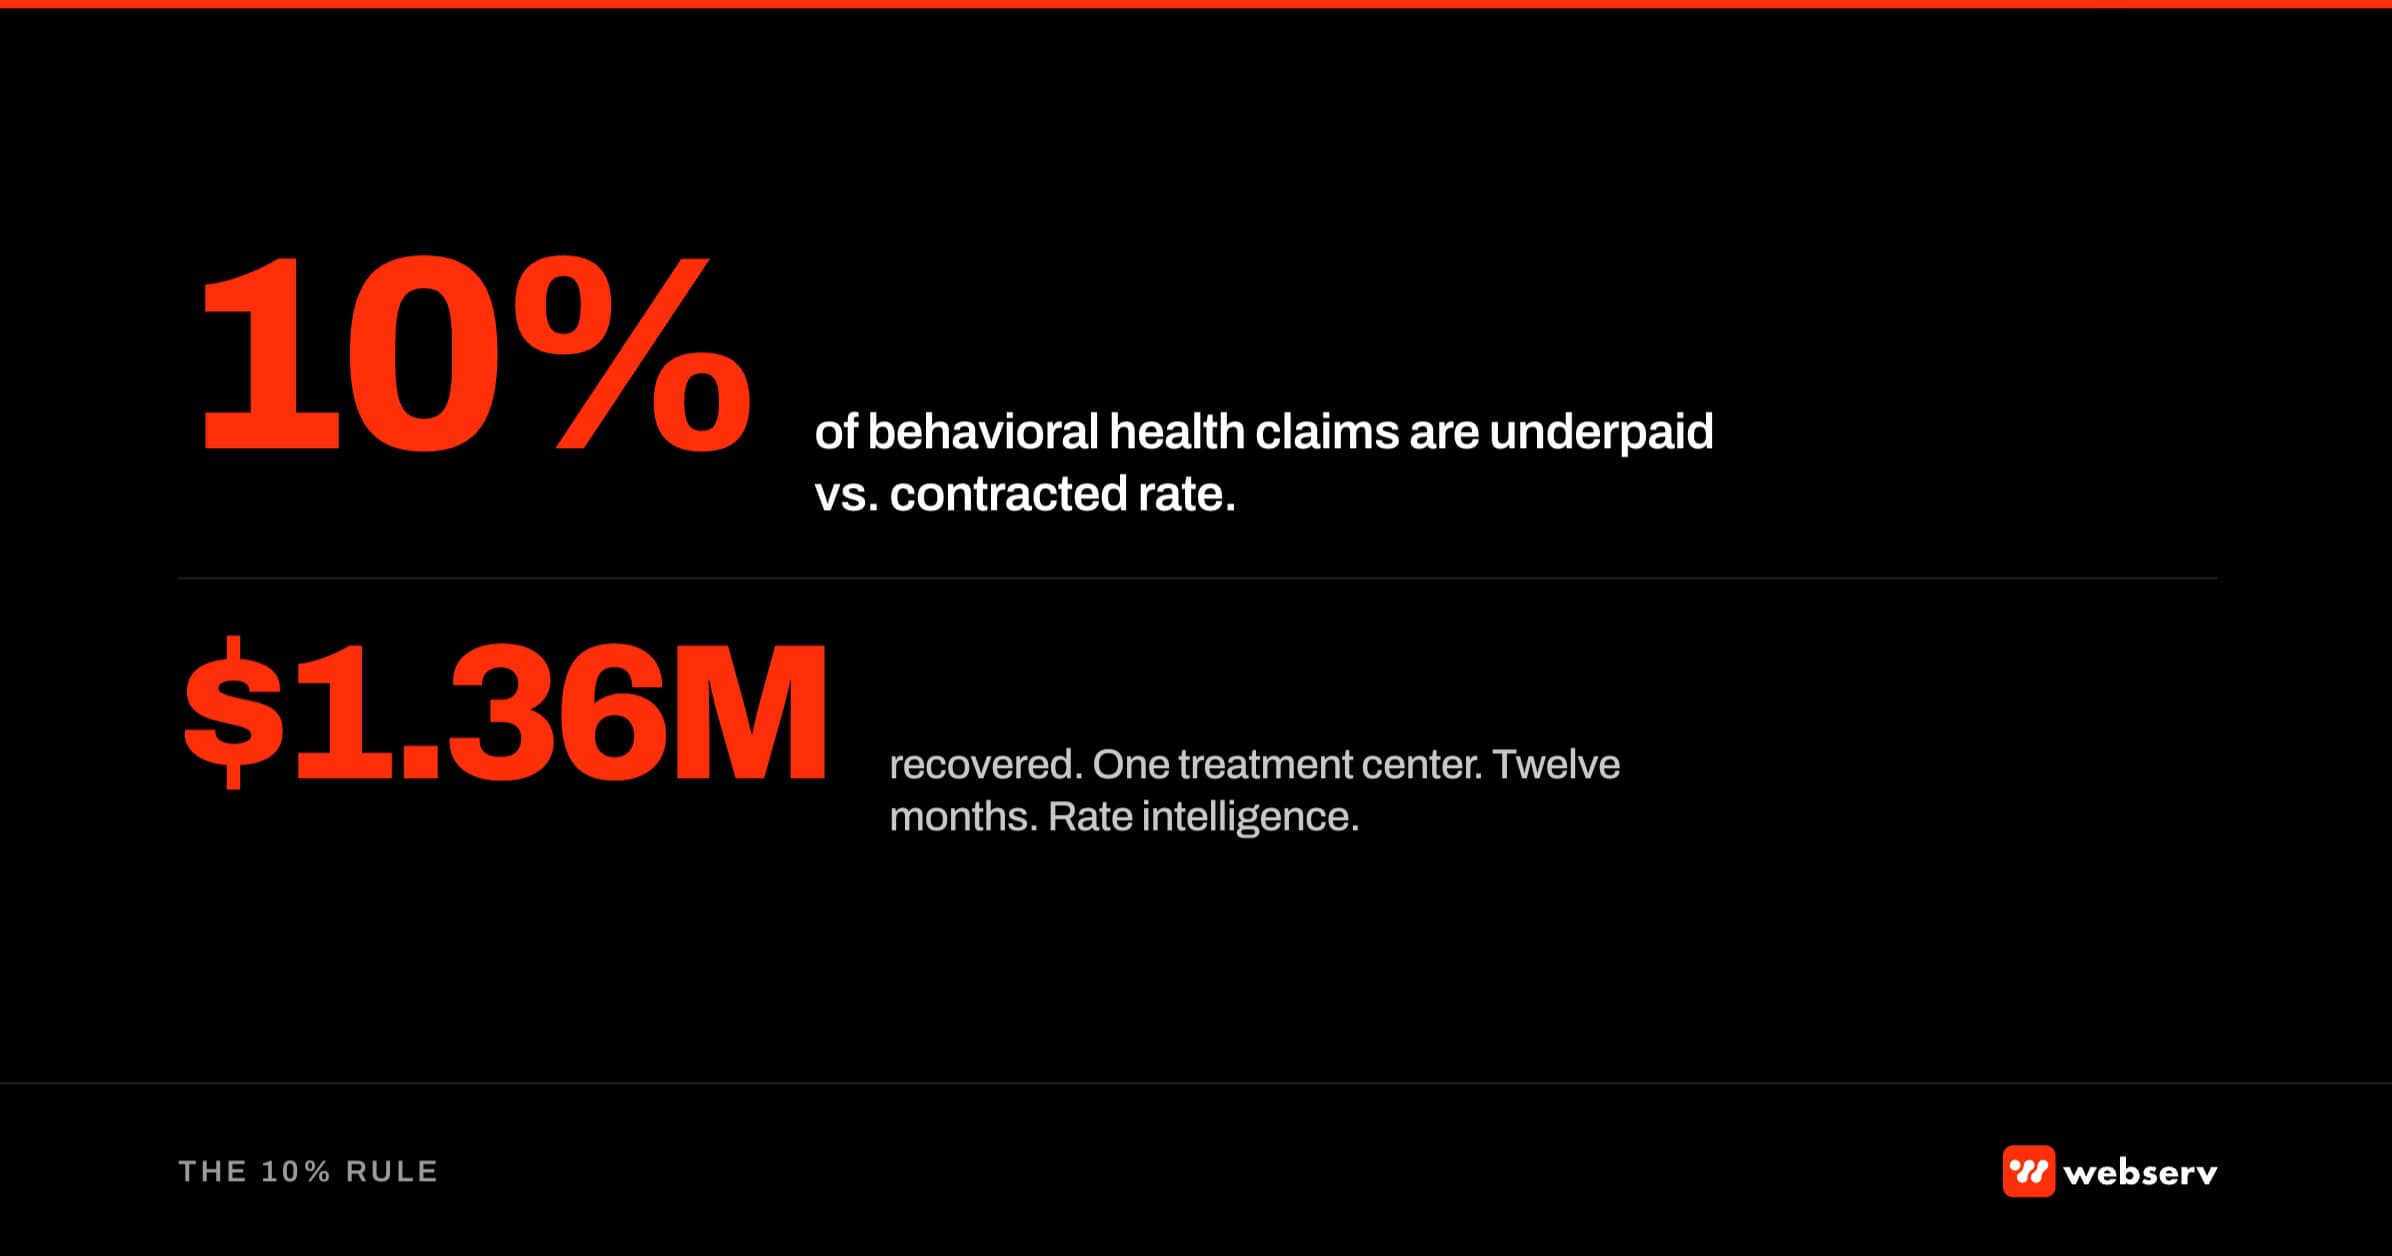
And when we ran a comparison case across roughly 23,000 claims against expected reimbursement, the pool caught $1.36 million in underpayments. Money the treatment centers were owed and never knew to chase, because the baseline for what “correct” should have looked like did not exist inside the billing team.
This piece explains what the 10% rule actually is, why the underpayment story is the natural consequence of it, and what changes for an admissions ops discipline once the rate intelligence layer is running.
Key Takeaways
- PayerLenz’s expected reimbursement estimates are right within 10% of actual paid reimbursement about nine out of ten times, based on adjudicated claims data across more than a million datapoints in the pool.
- In one comparison case across roughly 23,000 claims where we could evaluate paid against expected, the pool identified $1.36 million in underpayments the treatment centers had not previously known to pursue.
- Two patients with identical benefits on paper can produce a 10x difference in what actually gets allowed per day. Eligibility data cannot see that variance. Adjudicated claims data can.
- The three payer strategy mistakes rehab operators make repeatedly, all fixable with better data: running strategy on anecdotes at the carrier level, treating out-of-network as a single rate, and never closing the loop between the VOB and the paid claim.
- The operating decision this changes is not what to admit. It is what rate to expect, and therefore whether the admit produces positive contribution margin at the specific payer, plan, and level of care.
What the 10% rule actually is
The 10% rule is a specific accuracy claim about PayerLenz’s expected reimbursement output.
DEFINITION
The 10% Rule. PayerLenz’s expected reimbursement estimate lands within 10% of what the payer actually pays on adjudicated claims about nine times out of ten, on rate cells where the underlying data supports a high-confidence estimate. It is a confidence-weighted median from a pool of more than a million adjudicated-claim datapoints, keyed to alpha prefix, home plan, state, level of care, and network status — not a static rate card figure.
When PayerLenz returns a rate estimate for a specific patient, at a specific payer and plan, for a specific level of care and network status, that estimate lands within 10% of what the payer actually pays on adjudicated claims about nine times out of ten.
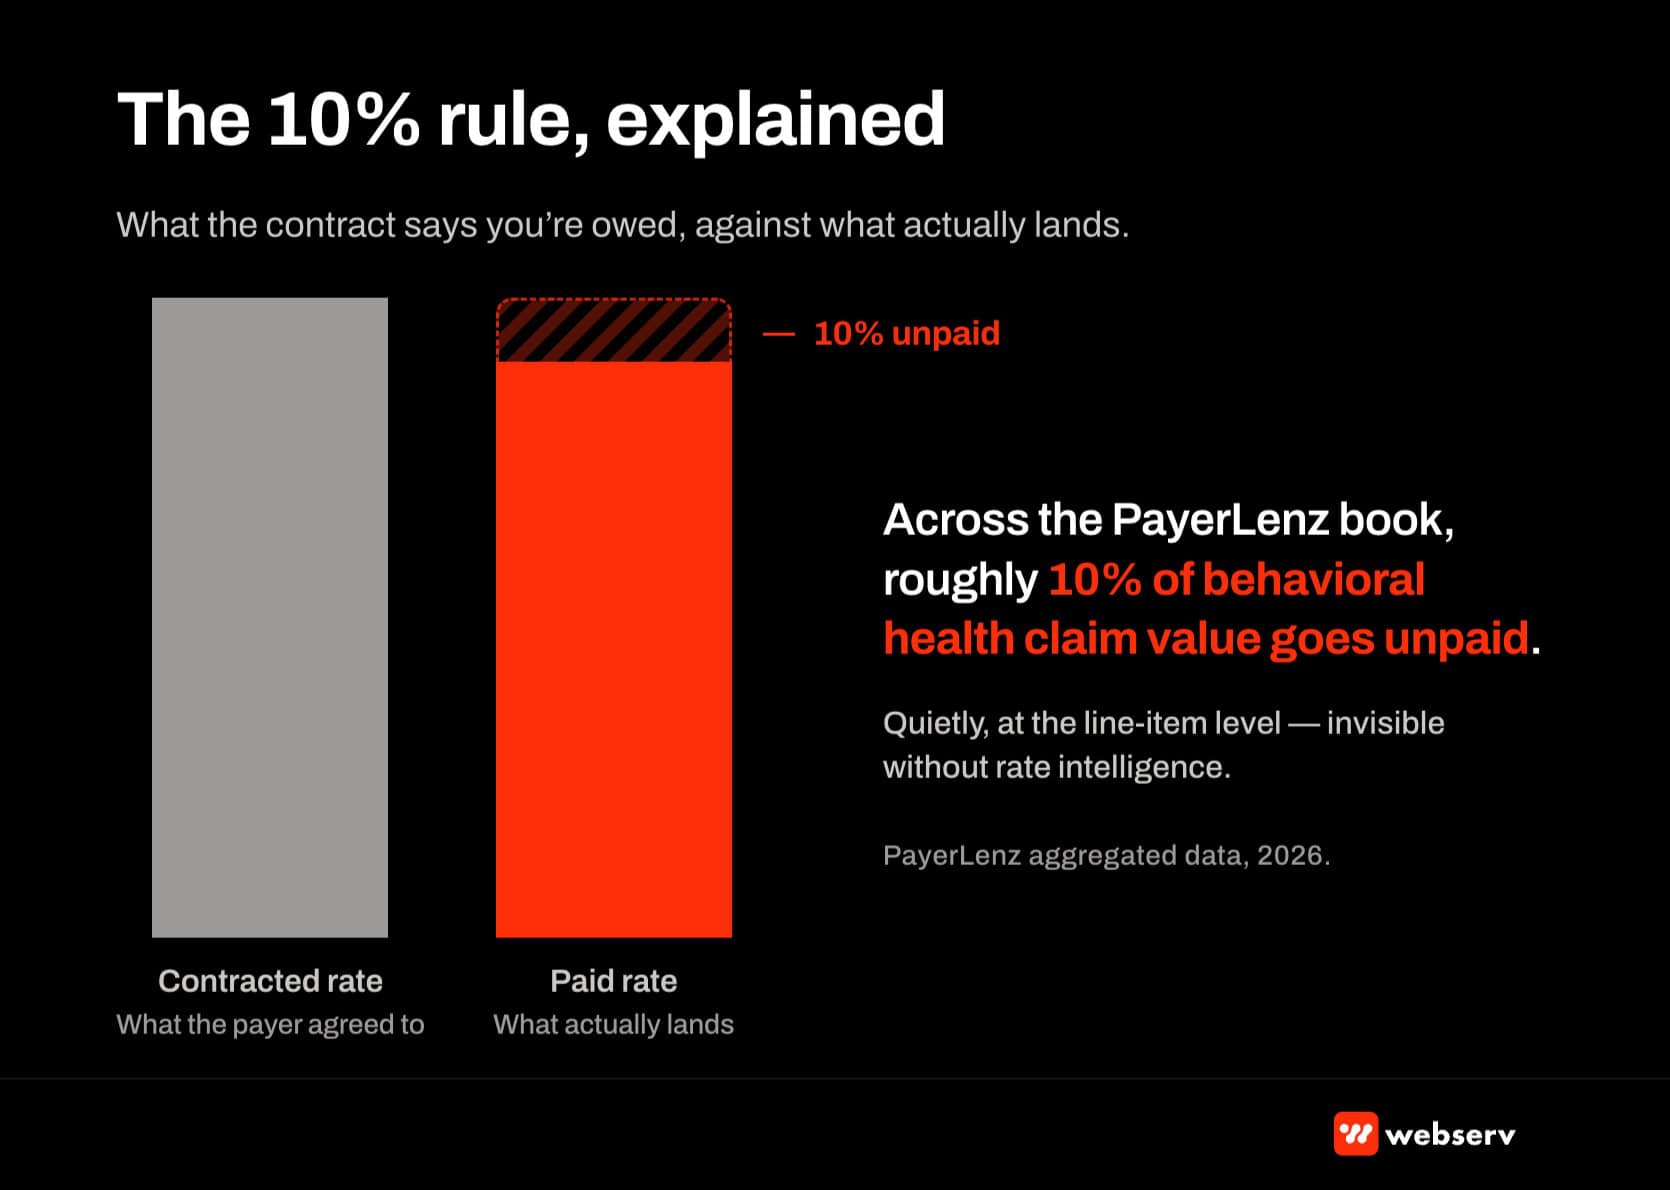
That claim needs to survive scrutiny, which is why I want to be direct about what it does and does not mean. It means that for a rate cell where the confidence is high, the estimate we return is defensible as planning-grade data. Operators can build admissions decisions, contribution margin models, and payer strategy on top of it. Our guide to payer strategy with rate intelligence shows how.
It does not mean every single lookup returns a high-confidence rate. When the underlying data is thin, PayerLenz says so and returns a lower-confidence estimate with the trust score attached. Operators can then decide what weight to give the estimate for a specific admit decision.
Why the accuracy runs where it does comes down to the underlying math. The estimate PayerLenz returns is not a static negotiated rate from a payer’s public rate card.
It is a confidence-weighted median calculated from adjudicated claims contributed to the pool by real treatment centers, keyed to the specific alpha prefix, home plan, state, level of care, and network status.
When confidence is high, the estimate moves toward what the payer is paying right now. When confidence is low, the system falls back toward a longer-run median.
The claims data pool network effect piece walks the mechanic in depth.
The output is a rate estimate an operator can plan around. That is a different product than what any eligibility API tool returns.
Eligibility APIs return what the policy says, not what the payer paid. The gap between those two questions is the rate intelligence category, and the 10% accuracy is what makes the category operationally useful.
The three payer strategy mistakes better data fixes
Three patterns show up in every operator conversation I have on this topic. All three are fixable with rate intelligence in the workflow.
The first is running payer strategy on anecdotes. “Aetna pays great, Cigna is terrible.” Reputations formed off a handful of claims and hallway conversations. The data says the truth lives at the plan and level-of-care resolution, not the carrier resolution. The cost of not knowing is covered in our piece on the most expensive unknown in admissions.
Operators turn away profitable admissions and accept losers based on folklore. The fix is to make the payer decision at the resolution the actual money adjudicates at, which is plan-specific and level-of-care-specific.
The second is treating out-of-network as one rate. OON is not a number. It is a distribution, and within a single alpha prefix it can swing 10x on identical coverage.
Operators who admit and forecast as if OON is a single expected rate get crushed on the low tail and never know they left money on the table at the high end.
The fix is to see the distribution, not just the average, and admit against the probable rate rather than a folklore average.
The third is the absence of a feedback loop between the VOB and the paid claim. The VOB said one thing at admission. The EOB said something else two months later. Nobody reconciles the two.
The same misjudgment repeats every month, on every payer, forever. The fix is a rate intelligence layer that stores both the VOB data and the paid rate, then closes the loop so the operator’s assumptions update as reality changes. Our reimbursement intelligence guide covers that layer end to end.
None of these are exotic operator failures. They are the default state of admissions ops at almost every treatment center running today. What is uncommon is the operating discipline that closes each gap deliberately.
The $1.36M underpayment recovery story
The most defensible way to explain what rate intelligence produces is to point at a specific case where we ran the math.
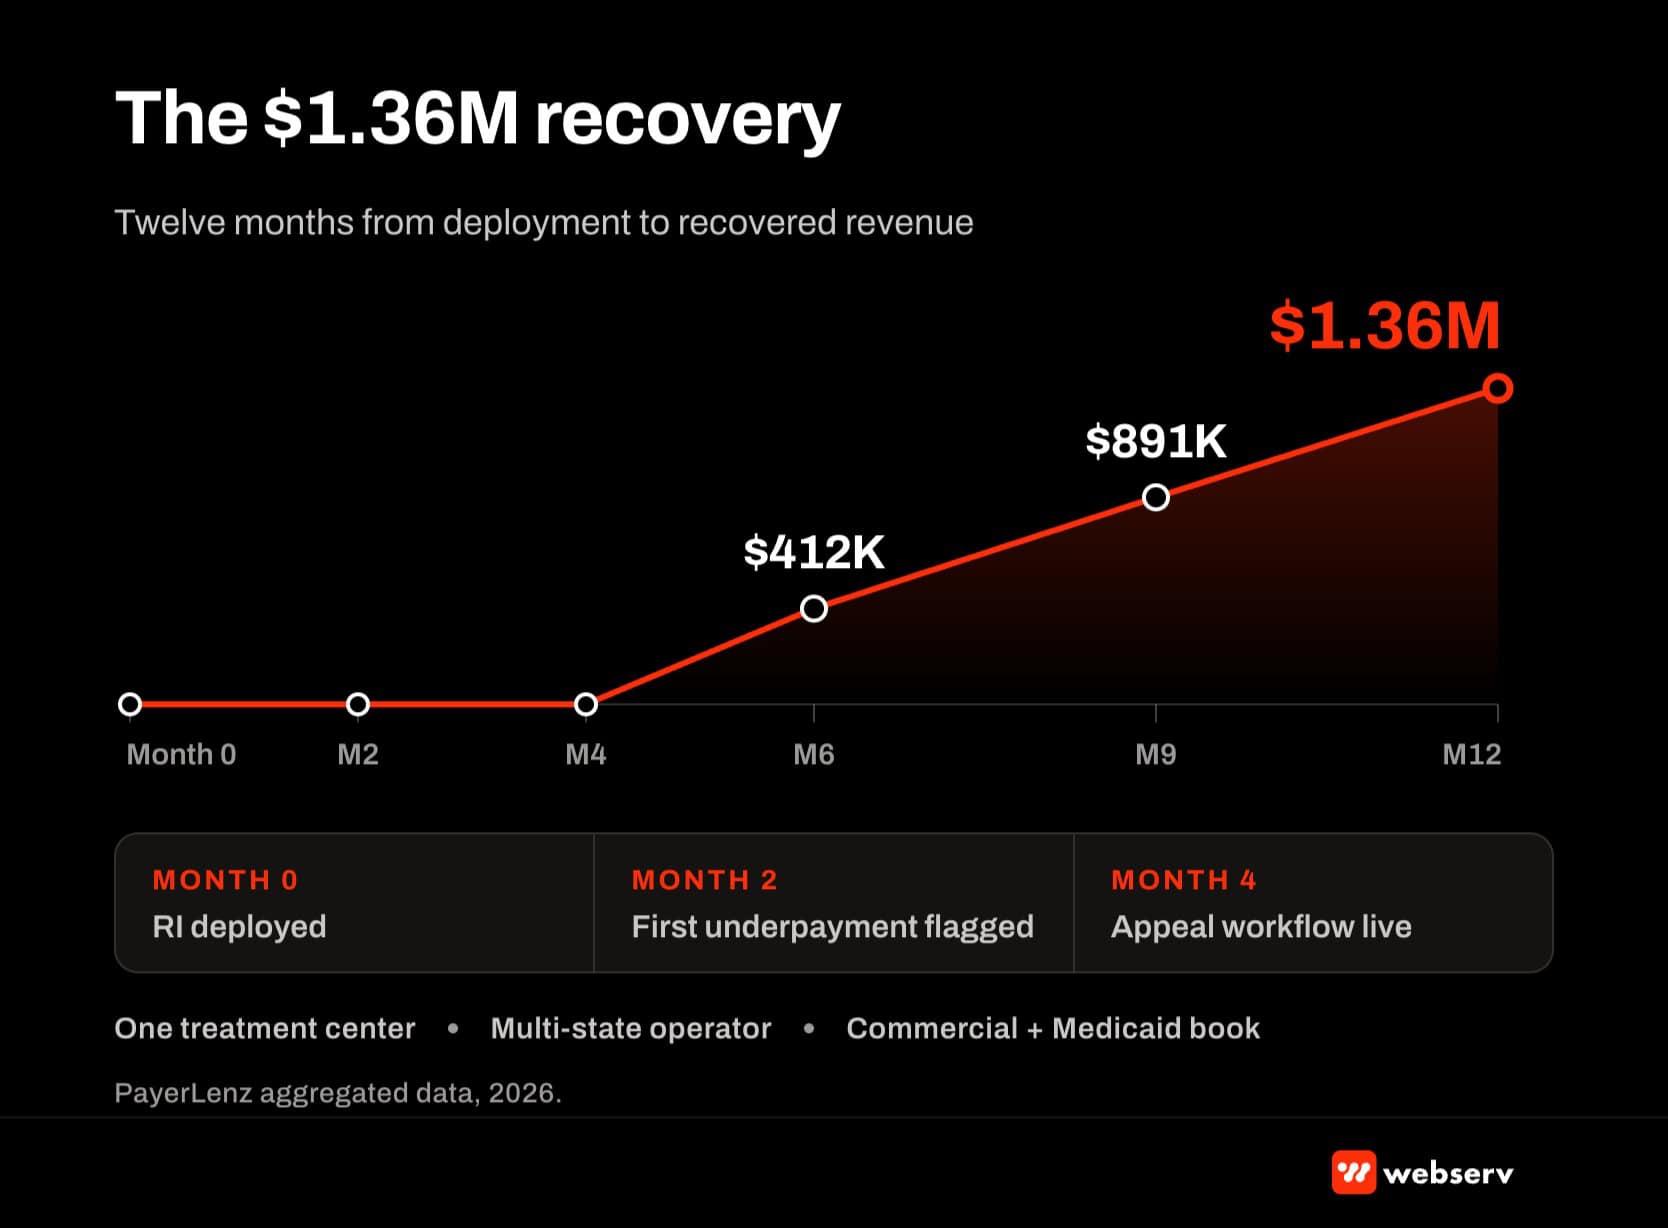
In one comparison case, we evaluated roughly 23,000 claims where we could compare what the payer actually paid against what our benchmark data said the payer should have paid. The pool caught $1.36 million in underpayments across those claims.
A few things worth naming precisely here. The 23,000 claims were the subset where we had enough data to make a defensible paid-versus-expected comparison, not the entire pool.
The $1.36M represents underpayments that the specific treatment centers involved could reasonably pursue as a recovery workflow. And the framing is “estimates, not guarantees,” because reimbursement recovery is a workflow that depends on payer disposition, medical-necessity documentation, and appeals discipline. What the number is not is a rate card promise.
What the number represents in practice is money that was owed and never chased. A payer allowed less than the contract or the historical pattern suggests they should have, and the treatment center’s billing team had no baseline against which to notice.
Rate intelligence produces that baseline. The recovery workflow that follows is the operator-side implementation of what the data surfaces.
The number matters strategically because it changes the ROI framing on rate intelligence. Most operators evaluating the category ask whether a rate intelligence tool will help them make better admit decisions. That is one axis of the value.
The second axis is the underpayment identification that happens after the admit, when the paid claim can be measured against the expected rate. That is a distinct revenue stream operators do not typically count until they run the math. Our underpayment recovery workflow covers how to collect it.
What operators do differently once rate intelligence is running
The specific operating changes I see across our client book are consistent enough to name.
The admissions call flow changes. Coordinators still confirm coverage on the VOB. The admissions manager now sees the expected rate alongside the coverage confirmation before the admit gets scheduled.
The rate intelligence workflow piece walks the specific script and CRM integration mechanics. The net effect is that admits happening at rates below the program’s cost floor get flagged upstream instead of showing up on a P&L 90 days later.
Payer mix strategy sharpens. Operators stop running strategy on carrier-level anecdotes and start running it on plan-level and level-of-care-level data. That produces different decisions about which OON payers to pursue, which to price-check, and which to route to a specific case-management workflow.
The revenue cycle discipline extends upstream. Billing teams start reconciling paid rates against expected rates and identifying underpayments to pursue. That is where the $1.36M comparison case lives.
QBR reporting changes shape. Aggregate cost per admit reporting gets replaced by rate-adjusted admissions volume, payer mix trending against expected reimbursement, and referral partner attribution that accounts for the payer profile the partner is sending. The marketing-to-admissions QBR playbook covers how that reporting rebuilds.
The compound effect over a quarter or two is a materially different operating conversation with ownership than the one most treatment centers have today.
The census question stays. What gets added is the rate question, which is what actually determines whether the census is producing the revenue the plan called for.
Why this is different from what VOB tools produce
VOB tools like VerifyTX, Availity, and pVerify are genuinely good at answering the eligibility question. The policy is active. The deductible is at X. Out-of-network benefits apply. That answer is real value.
The distinction is what the VOB tool does not answer and structurally cannot answer. Eligibility APIs return what the policy says. They carry no information about what the payer actually pays on adjudicated claims. That is a different question.
To produce a rate estimate that lands within 10% of actual reimbursement, a tool has to have access to a pool of adjudicated claims across many providers, cleaned and normalized to the plan-and-LOC level.
That is not eligibility API data. That is claims data, which is a different data infrastructure and a different customer relationship (customers contribute claims into a shared pool).
OPERATOR INSIGHT
The way I say it to a CEO on the first call: eligibility tells you whether you can bill. Rate intelligence tells you whether you should admit. VerifyTX ends where PayerLenz begins.
This connects to the broader revenue cycle picture covered in behavioral health marketing guide and revenue cycle management guide. It’s also worth pairing with billing mistakes that reduce admissions and reducing claim denials.
Frequently Asked Questions
How accurate is PayerLenz’s expected reimbursement estimate?
PayerLenz’s expected reimbursement estimates land within 10% of what the payer actually pays about nine out of ten times, on rate cells where the underlying data supports a high-confidence estimate.
The estimate is calculated from adjudicated claims contributed to the pool across more than a million datapoints, keyed to the specific alpha prefix, home plan, state, level of care, and network status.
When the underlying data is thin, PayerLenz says so and returns a lower-confidence estimate with the trust score attached. Operators should treat high-confidence rates as planning-grade data and low-confidence rates as directional signal to be verified before high-stakes admit decisions.
How does rate intelligence identify underpayments?
Rate intelligence produces an expected reimbursement number for a specific patient, payer, plan, and level of care before the admit.
When the paid claim comes back sixty to ninety days later, the billing team can compare what the payer actually paid against the expected rate. When the paid amount is materially below the expected rate, that is a candidate for an appeal or a rate-negotiation follow-up.
In one comparison case across roughly 23,000 claims, PayerLenz identified $1.36 million in underpayments the treatment centers had not previously known to chase.
That number is the subset where we had enough data to make a defensible paid-versus-expected comparison, not the entire pool. And the framing is “estimates, not guarantees,” because reimbursement recovery depends on the operator-side appeals and case-management workflow.
Why can’t a VOB tool give us the same information?
A VOB tool is built on payer eligibility APIs. Those APIs return what the policy says: deductible position, benefit design, coverage active, out-of-network percentages, prior authorization requirements. That is genuinely useful data for confirming a patient can bill.
To answer the rate question, a data source has to have access to adjudicated claims across many providers. That is a different data infrastructure and a different customer relationship. Adding features to an eligibility tool does not create a claims pool; the underlying data has to come from providers contributing claims into a shared substrate.
How much does the rate variance actually swing within a single payer?
Two patients with identical benefits on paper can produce a 10x difference in what actually gets allowed per day. Within a single alpha prefix on OON PHP, the variance can span an order of magnitude once the plan-level details are accounted for.
The variance is not random noise. It is a structural feature of how modern healthcare payer networks work. Behavioral health carve-outs, subcontracted network administrators, plan-level rate negotiations, and employer group-level adjustments all layer on top of the base contract. The visible policy looks identical. The paid rate is not.
How does rate intelligence change payer strategy?
The primary shift is moving the decision from the carrier level to the plan-and-LOC level. Operators running payer strategy on carrier-level anecdotes make three predictable mistakes: they treat OON as a single rate, they judge payers on folklore instead of adjudicated data, and they never close the loop between the VOB and the paid claim.
Rate intelligence fixes all three at once. Decisions get made at the resolution the money actually adjudicates at. OON is treated as a distribution, not a single number. And the paid rate gets reconciled against the expected rate, which surfaces the underpayments the billing team can now pursue.
Preston Powell is CEO of Webserv, a behavioral health marketing agency and admissions ops platform working with residential, outpatient, and telehealth treatment providers across the United States. He co-founded PayerLenz alongside Kyle McHenry, the reimbursement intelligence platform this piece describes.