Every behavioral health CMO or founder I talk to has some version of the same problem when it comes to marketing measurement. They know their marketing team is spending real money. They know admits are landing. But the specific KPI stack that ties marketing spend to admissions outcomes at a defensible benchmark level is usually not built out.
The result is that marketing performance conversations at the quarterly review either default to vanity metrics (impressions, sessions, page views that do not correlate to admits) or default to raw admit volume that hides the underlying efficiency of the marketing spend.
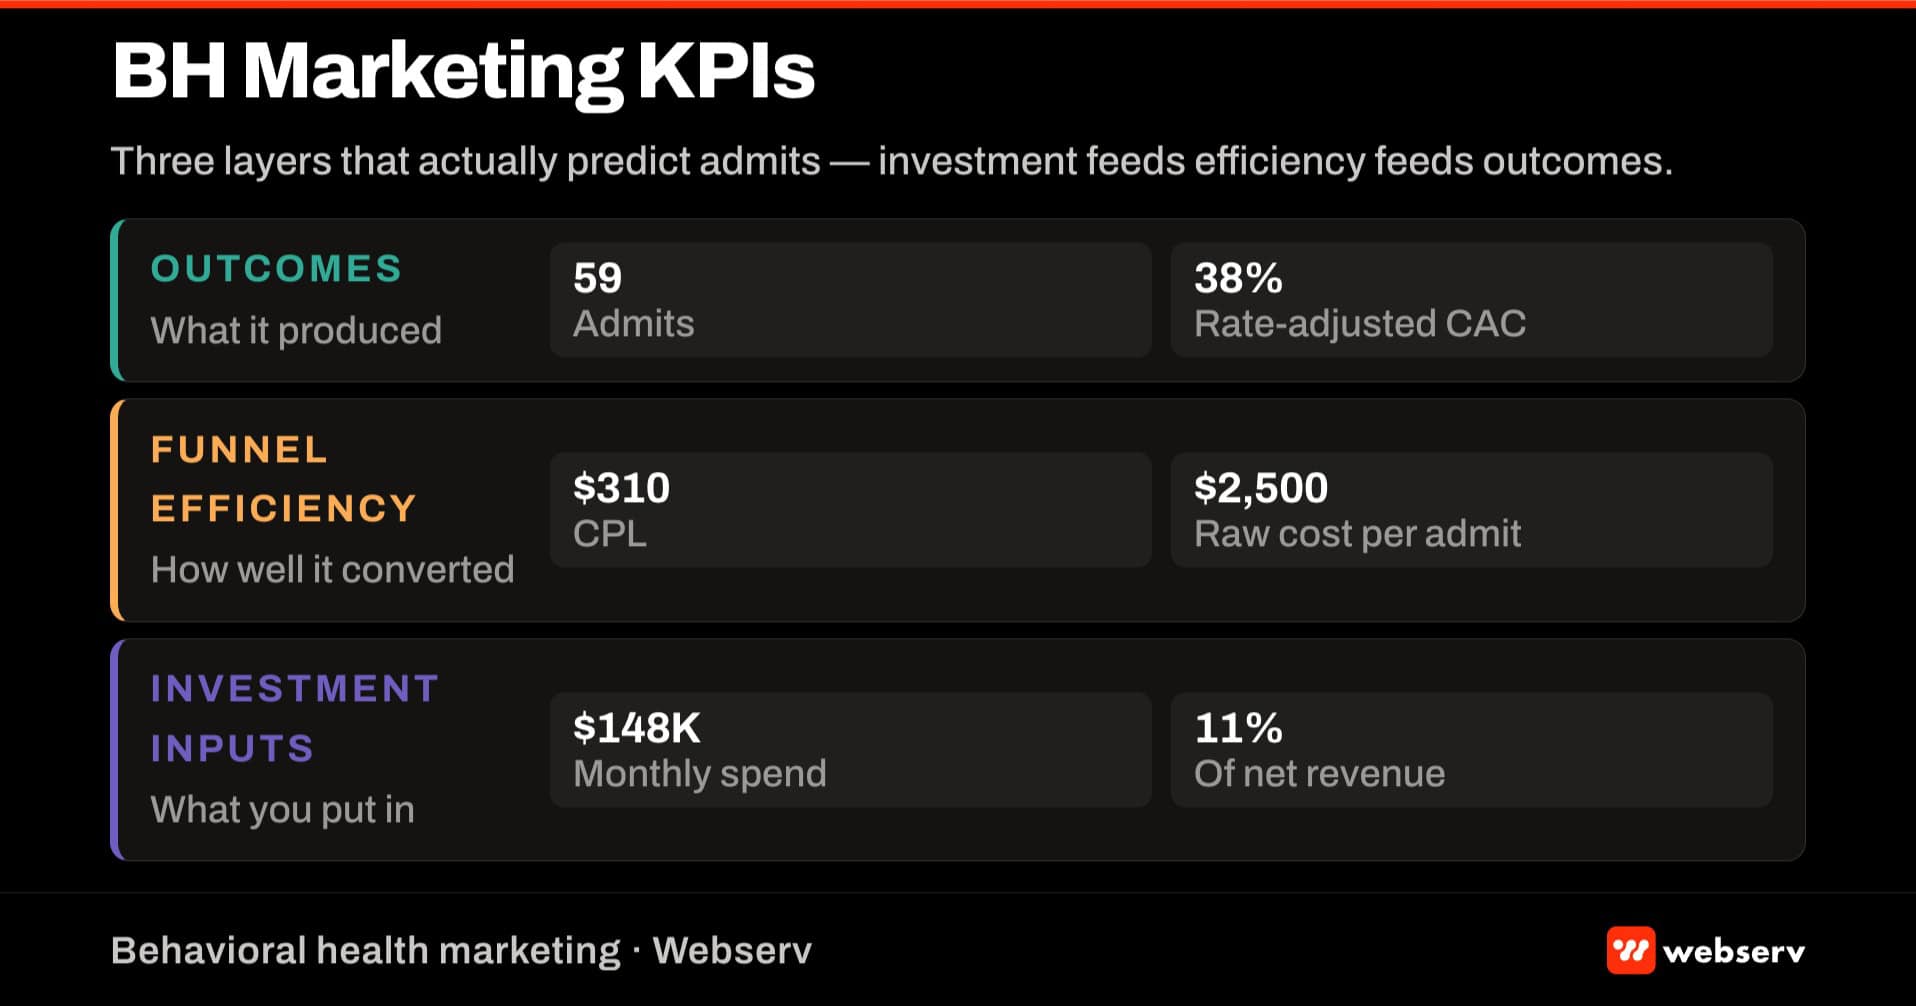
Neither framing gets a treatment center to the right operating decisions. The right framing is a KPI stack that separates investment inputs from funnel efficiency from admissions outcomes, with defensible benchmark ranges at each layer that account for the specific facility mix the operator is running.
This piece walks that KPI stack for behavioral health treatment centers in 2026. It covers the three-layer framework and the benchmark ranges at each layer. It also covers the specific facility-mix factors that determine where within each range a given operator lands, and the reporting cadence that turns the KPIs into operating decisions rather than dashboard artifacts.
It is intended for the CMO, marketing director, admissions director, and CFO reviewing marketing performance together in the full-funnel behavioral health marketing operating model our client book runs on.
Key Takeaways
- Behavioral health marketing measurement has to run at three layers. Investment inputs (what you are spending on agency, in-house team, and media). Funnel efficiency (how spend converts through leads, VOBs, and admits). Outcomes (cost per admit, admits per marketing dollar, contribution margin per admit).
- Vanity metrics like impressions, sessions, and page views correlate poorly with admits at behavioral health treatment centers. Operators who let marketing performance conversations default to vanity metrics typically discover they are optimizing the wrong side of the funnel.
- Benchmark ranges are wide across the industry because facility size, level-of-care mix, payer mix, and geographic mix all shift where a given operator lands. A single-facility residential SUD program with heavy OON payer mix in California produces materially different benchmarks than a multi-facility outpatient network in Ohio.
- The most important KPI most treatment centers under-measure is contribution margin per admit. Raw admits are volume. Contribution margin per admit is what determines whether the marketing engine actually improves the operator’s P&L, and it is the KPI that ties marketing spend to financial outcomes.
- The right reporting cadence is monthly at the tactical layer (CPL, conversion rates, spend efficiency) and quarterly at the strategic layer (cost per admit, contribution margin per admit, payer mix quality) in the QBR review.
DEFINITION
Behavioral health marketing KPI. A defined metric that ties marketing investment through funnel efficiency to admissions outcomes for a treatment center. Runs across three layers: investment inputs (spend), funnel efficiency (conversion rates), and outcomes (cost per admit, contribution margin per admit, rate-adjusted admissions volume).
Distinct from vanity metrics (impressions, sessions, page views) that correlate poorly with admits and typically hide weakness in the funnel efficiency or outcomes layers. A defensible KPI stack accounts for the three BH-specific constraints most other verticals do not face: HIPAA tracking constraints, payer mix variance, and multi-day intake funnels with family decision-makers involved.
Why Behavioral Health Marketing KPIs Are Different
Marketing measurement in behavioral health carries three constraints most other verticals do not face at the same intensity.
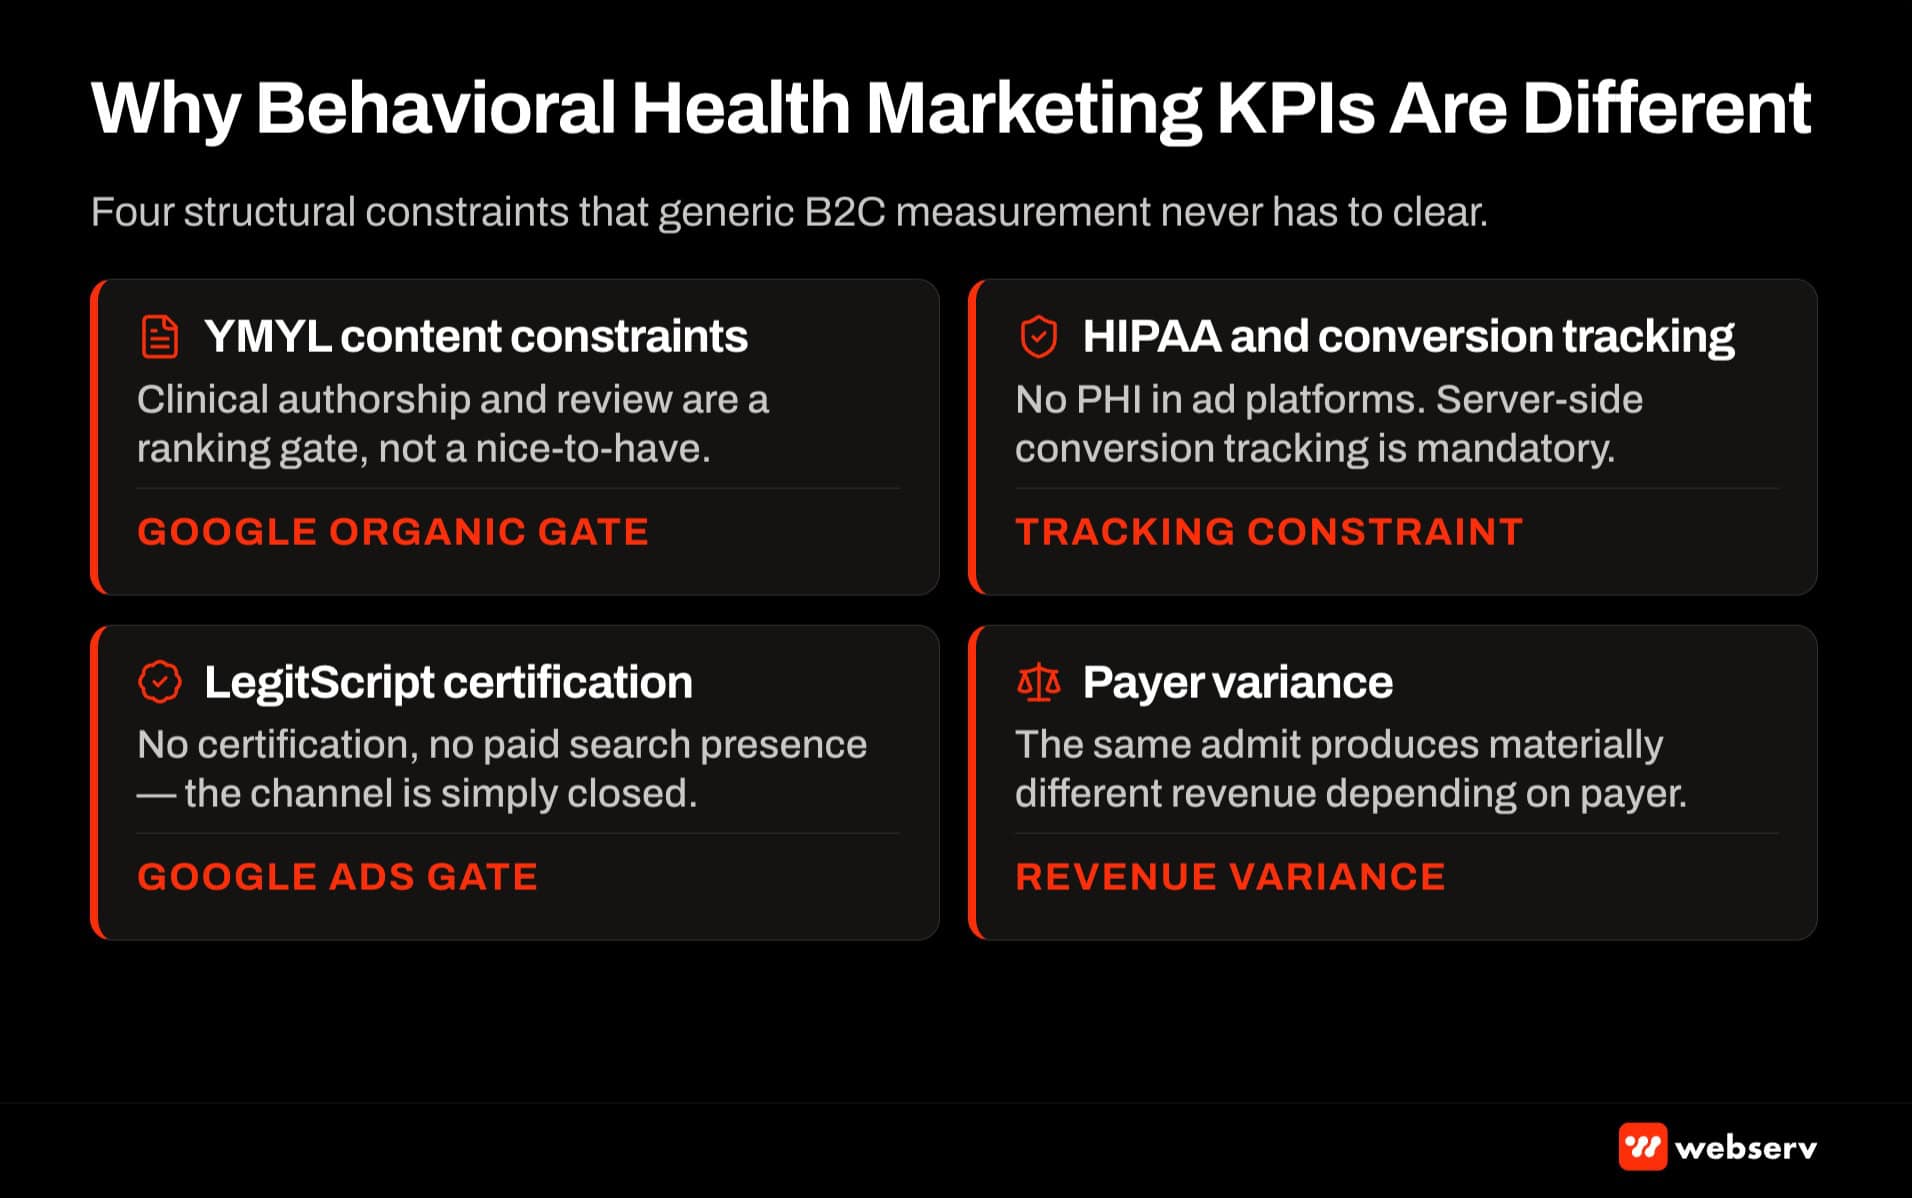
The first is HIPAA. Conversion tracking on healthcare sites is constrained by HHS OCR guidance on tracking technologies, which means the Meta Pixel or Google Analytics tag deployment that produces easy attribution data in ecommerce cannot be deployed the same way on treatment center sites. Server-side conversion tracking via Meta Conversions API and click-based Google Ads conversions (with enhanced conversions off) is the compliant path, and it introduces both cost and complexity to the measurement stack that most benchmark data does not account for.
The second is the payer mix. A patient inquiry that converts on a low-yielding OON plan is not economically equivalent to a patient inquiry that converts on a high-yielding OON plan. Marketing measurement that treats all admits as equal misses the underlying rate variance that determines whether the specific admit was profitable. This is why rate-adjusted admissions volume matters as much as raw admissions volume, especially for operators running heavy OON books.
The third is the funnel length. Behavioral health admits typically involve a family decision-maker, an intake process that requires coverage verification, and a scheduling window that can span days to weeks between the initial inquiry and the actual admit. The funnel is longer than ecommerce, which changes how attribution windows and CPL benchmarks should be interpreted.
The KPI stack that follows accounts for these three constraints.
The Three-Layer KPI Framework
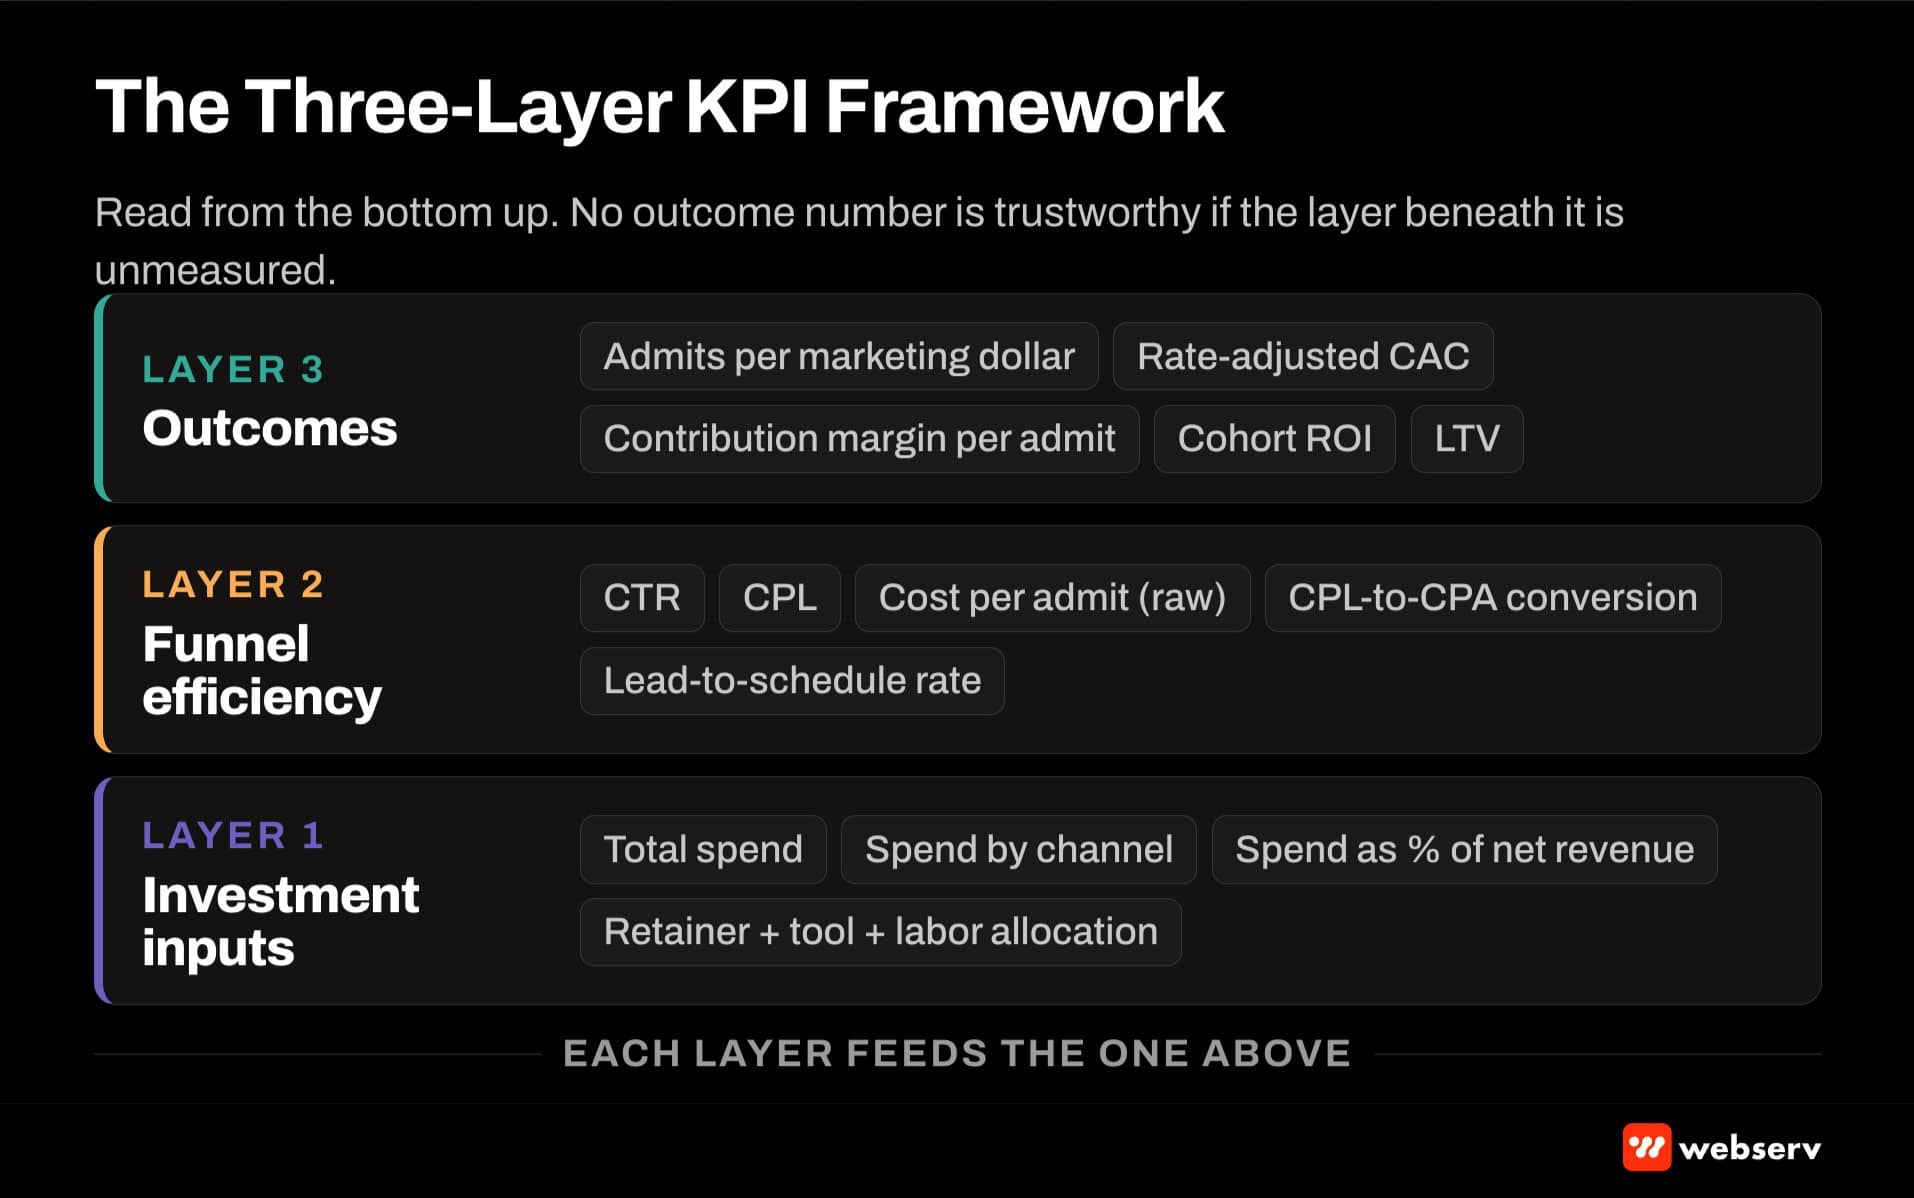
The KPI stack organizes into three layers: investment inputs (what you spend), funnel efficiency (how spend converts), and outcomes (whether the marketing engine improved the operator’s P&L). Ten specific KPIs across the three layers.
Layer 1: Investment inputs
The investment inputs layer measures what you are spending to run the marketing program. Three specific KPIs at this layer.
Total marketing spend. The combined monthly outlay across agency retainer or in-house marketing team salaries, paid media spend across Google Ads and Meta and other channels, content and creative production, SEO and technical work, and any compliance-specific tooling (LegitScript certification, HIPAA-safe tracking infrastructure).
Benchmark ranges: small treatment centers (single-facility, 6-16 beds) typically run $15,000 to $40,000 monthly total marketing spend. Mid-size operators (multi-location or 30-80 beds) run $40,000 to $150,000 monthly. Enterprise operators (multi-facility, 80+ beds or PE-backed platforms) run $150,000 to $500,000+ monthly.
Where a given operator lands within the range depends on the payer mix (OON operators generally spend more on paid acquisition because the higher revenue per admit supports it) and the LOC mix (residential drives higher spend than outpatient). Market competitiveness also matters (California and Florida run higher than most other states).
Agency versus in-house cost split. The specific breakdown between agency retainer and internal marketing team salary. Facilities running purely in-house typically have marketing team salaries running $150,000-$400,000 annually across a marketing manager, SEO/content specialist, and paid media specialist. Facilities running purely agency-side often pay $15,000-$60,000 monthly to a specialist BH agency. Hybrid models split the disciplines. The tradeoff between agency and in-house is not primarily a cost question. It is an expertise-depth-per-dollar question. Boutique BH agencies bring specialist expertise that a small in-house team typically cannot replicate, but the marginal cost of that expertise varies materially by agency. Our behavioral health marketing complete guide covers the buy-versus-build decision in depth.
Media spend by channel. Paid media spend broken out by Google Ads, Meta, LinkedIn (for B2B referral partner work), and any additional platforms. For BH specifically, Google Ads typically absorbs 40 to 70 percent of paid media spend because search-intent traffic converts at higher rates than social. Facilities running heavy Meta budgets should track LegitScript compliance and creative fatigue more actively than facilities running heavy Google Ads budgets.
Layer 2: Funnel efficiency
The funnel efficiency layer measures how the investment inputs convert through the intake pipeline. Six specific KPIs at this layer.
Cost per lead (CPL). The blended cost across all channels to produce one qualified marketing inquiry. Qualified means the inquiry passed a basic filter (right service line, geography, insurance type, contact detail completeness). For BH specifically, blended CPL typically runs $150-$600, with Google Ads at the low end and Meta or programmatic at the high end. The CPL variance is driven by search intent depth (Google Ads high-intent queries produce the lowest CPL per qualified lead), audience specificity (highly-targeted Meta audiences produce mid-range CPL), and geographic competitiveness (California and Florida run higher than most Midwest markets).
Landing page conversion rate. The percentage of qualified marketing traffic that converts to a lead form submission or phone inquiry. BH landing pages typically convert at 5-12 percent in 2026 across desktop and mobile combined, with the higher end usually seen on high-intent search traffic and the lower end on cold social. Our treatment center landing page design guide covers the specific conversion patterns and design decisions that drive the higher end of this range.
VOB completion rate. The percentage of leads whose insurance coverage the admissions team successfully verifies before the intake conversation resolves. High-performing admissions teams complete VOB on 85-95 percent of inbound leads within the first business day. Facilities running under 70 percent typically have admissions ops issues (understaffed intake, missing VOB automation, or workflow gaps) that no amount of marketing spend can fix.
Lead-to-admit conversion rate. The percentage of qualified leads that ultimately schedule an admission. Ranges widely by facility, LOC mix, and lead source, but typical BH treatment centers see 8-18 percent lead-to-admit conversion. High-performing residential programs can push toward 20-25 percent on high-intent inbound. Outpatient and detox programs often run lower because the intent-to-admit window is different.
Time-to-admit. The average days between initial inquiry and scheduled admission. For residential SUD, typical time-to-admit is 3-10 days. For outpatient, 1-7 days. Shorter time-to-admit correlates with higher conversion because BH inquiries lose intent quickly. Every additional day between inquiry and scheduling drops conversion.
Cost per admit (CPA). The total marketing spend divided by admits produced. Ranges from $800-$2,500 for facilities running efficient organic and referral-heavy programs to $3,500-$12,000 for facilities relying heavily on paid acquisition. Enterprise operators running paid-heavy programs can run higher because the volume supports it. Efficient CPA is not the same as low CPA. The right CPA depends on the contribution margin per admit.
Layer 3: Outcomes
The outcomes layer measures whether the marketing engine actually improved the operator’s P&L. Three specific KPIs at this layer.
Contribution margin per admit. The average revenue per admit minus the cost of delivering care on the admit (clinical staff, facility costs, allocated overhead) minus the marketing acquisition cost. This is the KPI that ties the whole marketing engine to P&L. Most facilities under-measure this because it requires cross-functional data flow between billing and marketing.
Admits per marketing dollar. The inverse of cost per admit, expressed at the dollar level rather than the case level. Well-run programs typically see 1 admit per $2,000-$5,000 in marketing spend. Weaker programs land at 1 admit per $6,000-$12,000. The KPI is useful because it makes the marketing efficiency conversation intuitive at the budget-planning level.
Rate-adjusted admissions volume. Admits weighted by expected reimbursement rather than counted as a flat number. Two facilities with 40 monthly admits can produce materially different revenue depending on the plan mix. Rate-adjusted admissions volume is the KPI that lets the operator manage payer mix as a portfolio rather than treating all admits as interchangeable.
By the numbers: BH marketing spend and outcomes benchmarks
6-12%
Marketing spend as share of net revenue (established BH facility)
$800-$12K
Cost per admit range across efficient-organic to paid-heavy programs
5-12%
BH landing page conversion rate range (2026 desktop + mobile combined)
8-18%
Lead-to-admit conversion rate (residential SUD, in-network + OON)
The Most Under-Measured KPI
Of the ten KPIs above, the most consistently under-measured across the treatment centers we work with is contribution margin per admit.
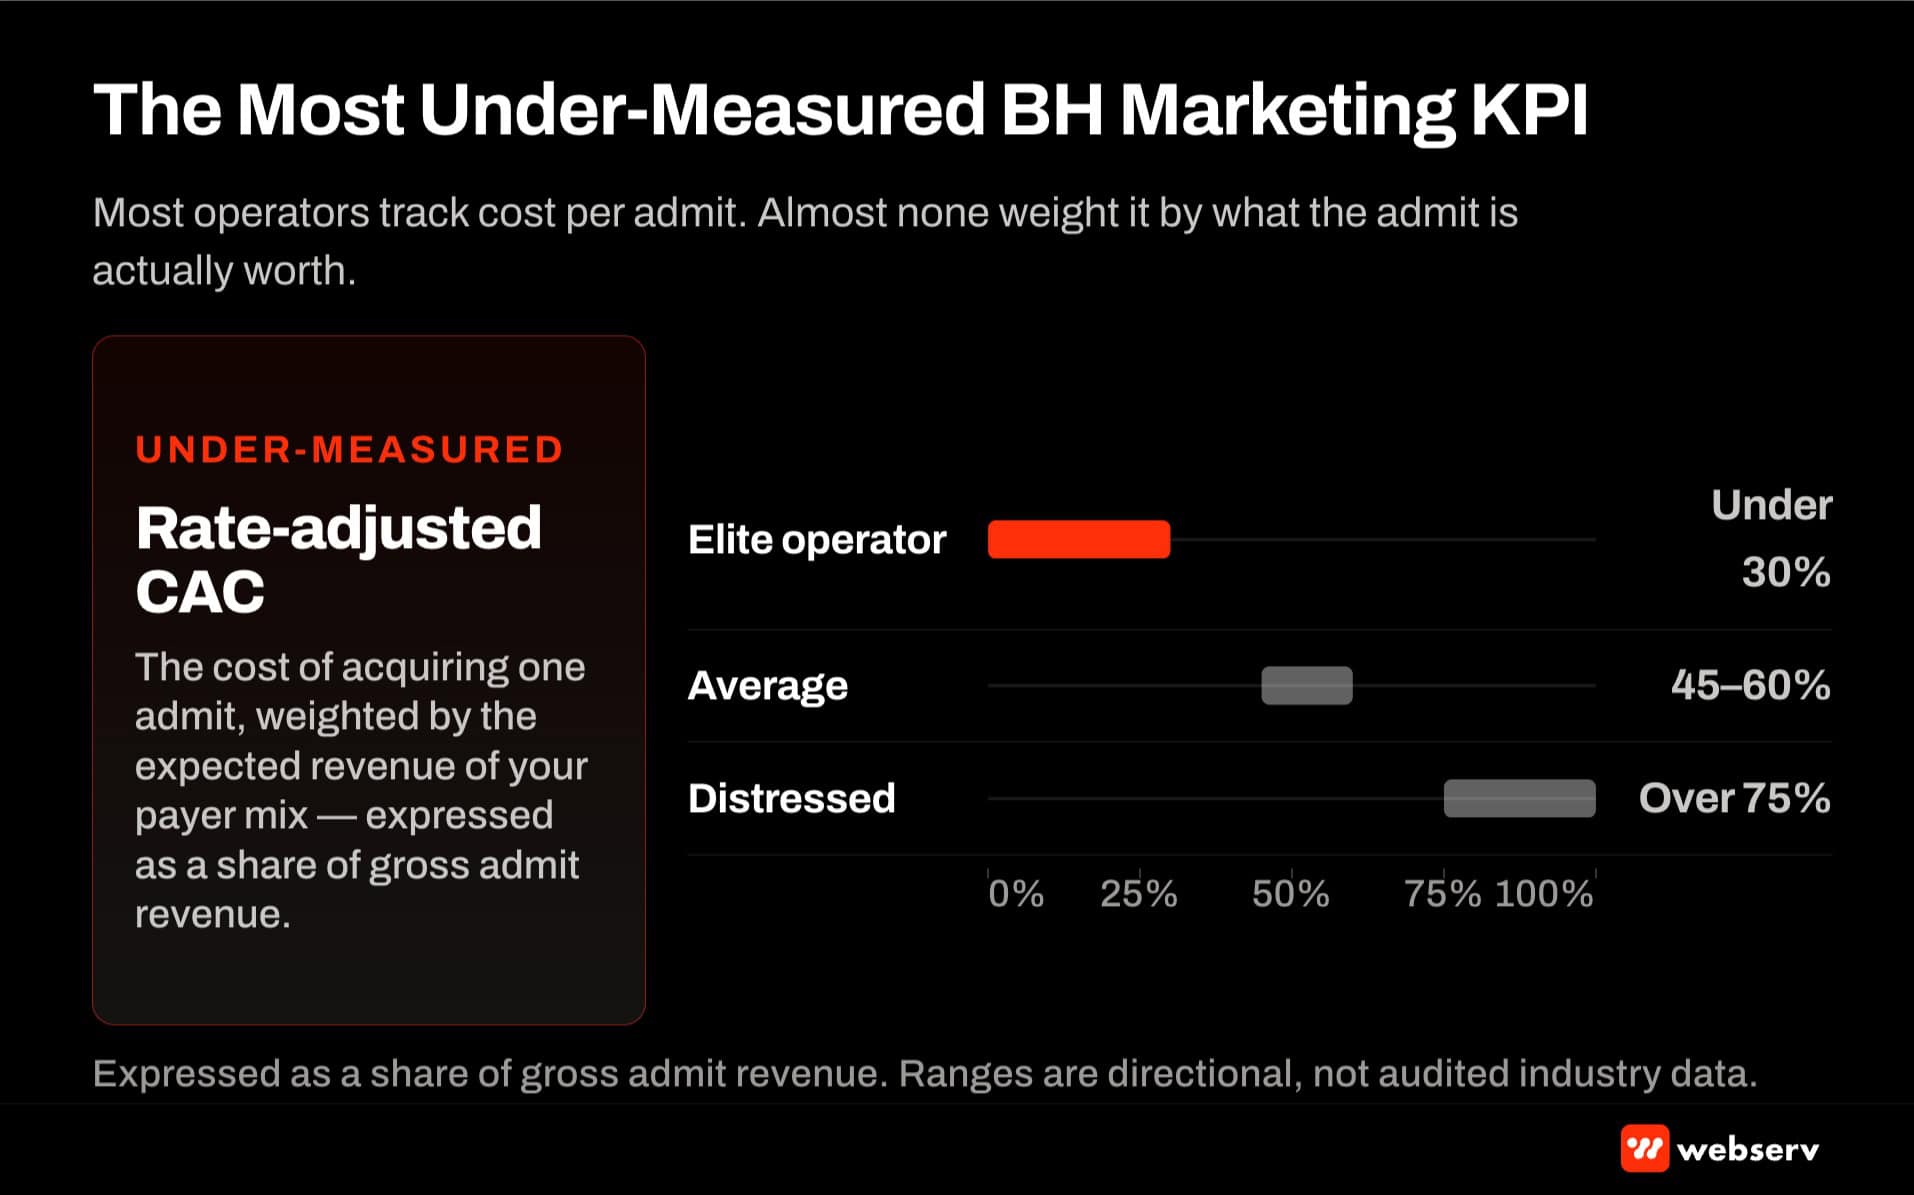
The reason is structural. Contribution margin per admit requires the marketing team to have visibility into the admissions team’s per-case reimbursement data, and the admissions team’s per-case reimbursement data lives in the billing system. Most facilities do not have the cross-functional reporting to close this loop, so marketing performance gets measured on cost per admit alone.
The gap this produces is that a marketing program can look efficient on cost per admit and still be destroying the operator’s P&L if the admits being produced are landing in low-yielding payer mix. Marketing spends $3,000 to acquire an admit that pays $700 per day for a 30-day residential stay. The gross revenue looks fine at $21,000. The contribution margin is a very different picture once you account for the cost of delivering 30 days of residential care.
Fixing this gap requires the CFO or controller to publish reimbursement data per admit back to the marketing team on a monthly cadence, and the marketing team to reweight their KPI reporting from raw cost per admit to contribution margin per admit.
Once this loop closes, the entire payer mix conversation changes because marketing can now steer paid acquisition toward the plans that produce the best economics.
OPERATOR INSIGHT
Marketing spends $3,000 to acquire an admit that pays $700 per day for a 30-day residential stay. Gross revenue looks fine at $21,000. Contribution margin is a very different picture once you account for the cost of delivering 30 days of residential care.
A marketing program can look efficient on cost per admit and still be destroying the operator’s P&L if the admits being produced are landing in low-yielding payer mix. Fixing this requires the CFO to publish per-admit reimbursement back to marketing monthly, and marketing to reweight from raw cost per admit to contribution margin per admit. Once the loop closes, the entire payer mix conversation changes because marketing can steer paid acquisition toward the plans that produce the best economics.
Facility Mix Factors That Determine Where You Land
Benchmark ranges are wide because facility mix determines where a given operator sits within each range. Four factors matter most.
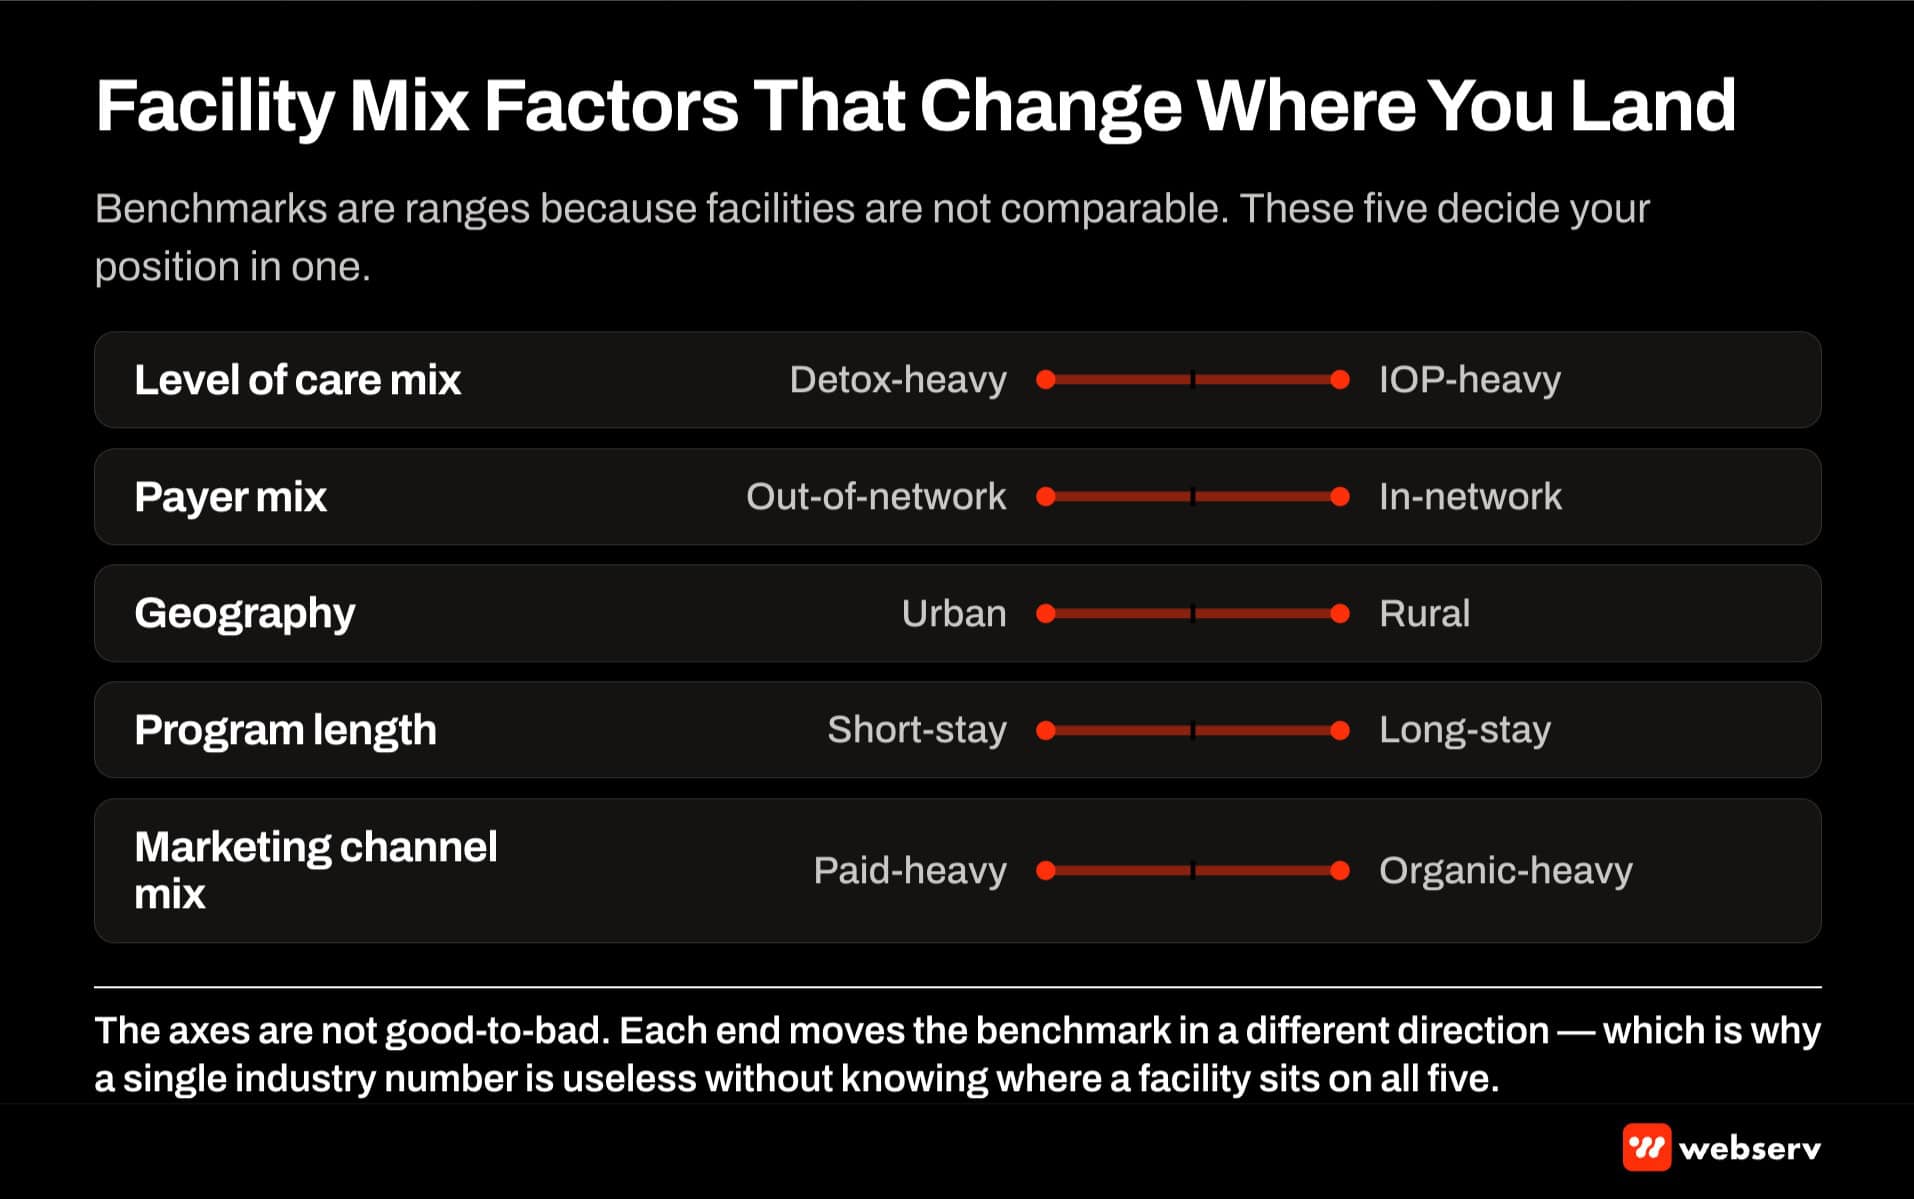
Payer mix. OON-heavy operators typically show higher CPL and CPA but higher contribution margin per admit. In-network-heavy operators show lower CPA but tighter contribution margin per admit. Medi-Cal operators produce the lowest CPA but lowest contribution margin. The strategic question is not which mix is best in the abstract. It is which mix supports the operator’s P&L model at the scale they operate.
Level-of-care mix. Residential operators typically run higher CPA than outpatient operators, offset by higher revenue per admit. Detox operators run the highest CPA per admit but the shortest LOS, so the revenue-per-day math is different from residential. PHP and IOP operators often produce the best marketing efficiency because the acquisition cost is lower and the LOS is meaningful.
Geographic mix. California and Florida run 30-60 percent higher CPL than most Midwest markets because paid search competition is denser. Facilities operating in less-competitive markets often produce better CPA even with smaller marketing budgets.
Program-portfolio mix. Facilities running multiple LOCs (residential plus outpatient step-down) typically capture better contribution margin per patient because a single acquired inquiry can convert into multiple episodes of care as the patient progresses through the continuum. Single-LOC facilities capture only the initial admit revenue.
Understanding your specific mix on all four factors is the prerequisite for interpreting where within the benchmark ranges your specific numbers should land.
Common Measurement Mistakes
Three measurement patterns show up repeatedly at behavioral health treatment centers.
The first is treating vanity metrics as KPIs. Impressions, sessions, page views, and average time on page all sound like marketing performance metrics but correlate poorly with admits. Marketing teams that report these numbers to ownership at the quarterly review are typically hiding weakness in the funnel efficiency layer or the outcomes layer.
The second is measuring CPL without measuring lead quality. Two channels can both produce $300 CPL, but one produces qualified BH inquiries that convert to admits at 15 percent and the other produces low-intent inquiries that convert at 2 percent. Aggregated CPL hides the quality gap. Channel-specific lead-to-admit conversion is the measurement that surfaces which channels are actually working.
The third is running the marketing KPI stack in isolation from admissions ops. Marketing produces the inquiry. Admissions converts it. If the admissions team drops leads or fails to complete VOB on time, the marketing spend is wasted, but the marketing team looks efficient in isolation. The full-funnel QBR reporting playbook covers how to run the two disciplines as one performance conversation.
DO
- Measure at three layers: investment inputs, funnel efficiency, and outcomes.
- Track channel-specific lead-to-admit conversion rate, not just blended CPL.
- Close the loop between marketing performance and admissions/billing data monthly.
- Report cost per admit against contribution margin per admit, not industry averages.
- Run marketing and admissions performance conversations together at quarterly QBR.
DON’T
- Report vanity metrics (impressions, sessions, page views) as marketing KPIs.
- Aggregate CPL without measuring lead quality by channel.
- Run marketing KPIs in isolation from admissions ops execution data.
- Benchmark your CPA against industry averages without accounting for your payer mix.
- Deploy client-side Meta Pixel or Google Analytics on authenticated patient pages (HIPAA violation).
The Reporting Cadence
Monthly reporting handles the tactical layer. Marketing team reviews spend by channel, CPL by channel, landing page conversion rate, and any specific campaign-level performance. Adjustments happen at the campaign level within the month.
Quarterly reporting handles the strategic layer. The full team (CMO, marketing director, admissions director, CFO, ownership) reviews cost per admit, contribution margin per admit, payer mix quality, and the specific strategic decisions the operator is running against the data. The QBR review is where marketing performance gets connected to admissions outcomes and financial outcomes.
Annual reporting handles the investment level. The CFO reviews total marketing spend as a percentage of net revenue, compares against industry benchmarks (typically 6-12 percent of net revenue for BH treatment centers), and makes the top-line budget decision for the coming year.
Frequently Asked Questions
This connects to the broader cost-per-admit picture in revenue cycle as a marketing problem and conversion rate optimization guide.
What percentage of net revenue should we spend on marketing?
Behavioral health treatment centers typically spend 6 to 12 percent of net revenue on marketing, with the range varying by payer mix and growth stage. OON-heavy operators tend to run at the higher end because paid acquisition is more expensive but revenue per admit supports it. In-network and Medi-Cal-heavy operators run lower because per-admit revenue does not support the same paid-acquisition intensity.
New facilities in their first two years often run materially above this range (15-25 percent of net revenue) because building organic authority takes time and paid channels have to fill the gap. Established facilities with strong organic authority and referral pipelines can sometimes run at 4-6 percent of net revenue if the mix has matured toward channels that do not require ongoing paid investment.
The percentage is a rough benchmark. What matters more is whether the marketing spend is producing the cost per admit and contribution margin per admit that support the operator’s financial model.
How do we measure marketing ROI in behavioral health specifically?
Marketing ROI in BH is measured at the contribution margin per admit level, not the raw admit or raw revenue level. The formula is (contribution margin per admit multiplied by admits produced) minus total marketing spend, divided by total marketing spend. That produces a defensible ROI number that ties the marketing engine to P&L improvement rather than just top-line volume.
The complication is that contribution margin per admit requires cross-functional visibility into the admissions and billing data that the marketing team does not typically own. Getting the CFO or controller to publish per-admit reimbursement data back to marketing on a monthly cadence is the operational step that unlocks defensible ROI measurement.
Facilities that cannot close this loop typically default to cost per admit as their ROI proxy, which is directionally useful but misses the payer mix quality that determines whether the admits being acquired are actually profitable.
What’s a good cost per admit for a BH treatment center?
Cost per admit varies from $800 to $12,000+ depending on facility mix. Efficient organic-and-referral programs typically produce $800-$2,500 CPA. Paid-heavy programs produce $3,500-$12,000 CPA. Enterprise national brands can run higher on paid programs because the volume supports it.
The specific CPA that is “good” for your facility depends on the contribution margin per admit your specific payer mix produces. A $5,000 CPA is excellent if your average admit contributes $8,000 to margin and terrible if your average admit contributes $2,000 to margin.
Track cost per admit against contribution margin per admit rather than against industry averages. The ratio between the two is what determines whether the marketing engine is actually improving the operator’s P&L.
How long should our lead-to-admit funnel realistically take?
For residential SUD treatment, typical time-to-admit is 3-10 days from initial inquiry. For outpatient (OP, IOP, PHP), 1-7 days. For medical detox, sometimes as fast as 24-48 hours when the clinical urgency drives immediate scheduling.
Shorter time-to-admit correlates strongly with higher conversion rates because BH inquiries lose intent quickly. Family members and patients researching treatment often make the decision within days of the initial inquiry, so admissions teams that cannot respond and schedule fast lose those cases to competitors.
The specific admissions ops workflow that drives faster time-to-admit is a defined operational discipline, not a marketing metric. But the marketing KPI stack has to measure time-to-admit because it is the shared metric that determines whether the funnel is actually converting.
What’s the difference between marketing KPIs and admissions KPIs?
Marketing KPIs measure how efficiently the marketing engine produces qualified leads and converts them into admits. Admissions KPIs measure how efficiently the admissions team converts leads into scheduled admissions and completes the intake workflow through to first day of care.
The two overlap at the middle of the funnel (lead-to-admit conversion is a shared metric that depends on both marketing lead quality and admissions team execution) and diverge at the endpoints. Marketing owns CPL, channel performance, and landing page conversion. Admissions owns VOB completion, time-to-admit, and scheduling completion.
The quarterly QBR review is where the two KPI stacks come together. Facilities that run marketing and admissions performance conversations in isolation typically miss the middle-of-funnel diagnostics that determine whether specific channels or campaigns are actually working.
How do HIPAA and LegitScript compliance affect marketing KPI measurement?
HIPAA compliance requires server-side conversion tracking for any user-authenticated pages on the treatment center site. The specific implementation (Meta Conversions API with proper HIPAA safeguards, click-based Google Ads conversions with enhanced conversions off) is more expensive and more complex than the standard client-side pixel deployment most industries use, and it affects the granularity of attribution data available to the marketing team.
Facilities that skip HIPAA-safe tracking risk enforcement action, but they also produce cleaner-looking conversion data because the standard Meta Pixel and Google Analytics tags capture more events. The tradeoff is real, and the compliance obligation is not optional, so the KPI stack has to be interpreted against the tracking implementation the facility is running.
LegitScript certification is a prerequisite for Google Ads on treatment-intent keywords for addiction treatment providers. The certification runs $995 initially plus annual renewal fees and takes 6-8 weeks to process. Marketing KPI reporting should account for the certification status because paid search access is on/off depending on whether it is in place.
Trevor Gage is Director of Marketing at Webserv, a behavioral health marketing agency and admissions operations platform working with residential, outpatient, and telehealth treatment providers across the United States. He leads the SEO, content, and paid-media disciplines for the Webserv client book and works directly with treatment center CMOs, marketing directors, and CFOs on marketing performance measurement, KPI framework design, and full-funnel reporting cadence.