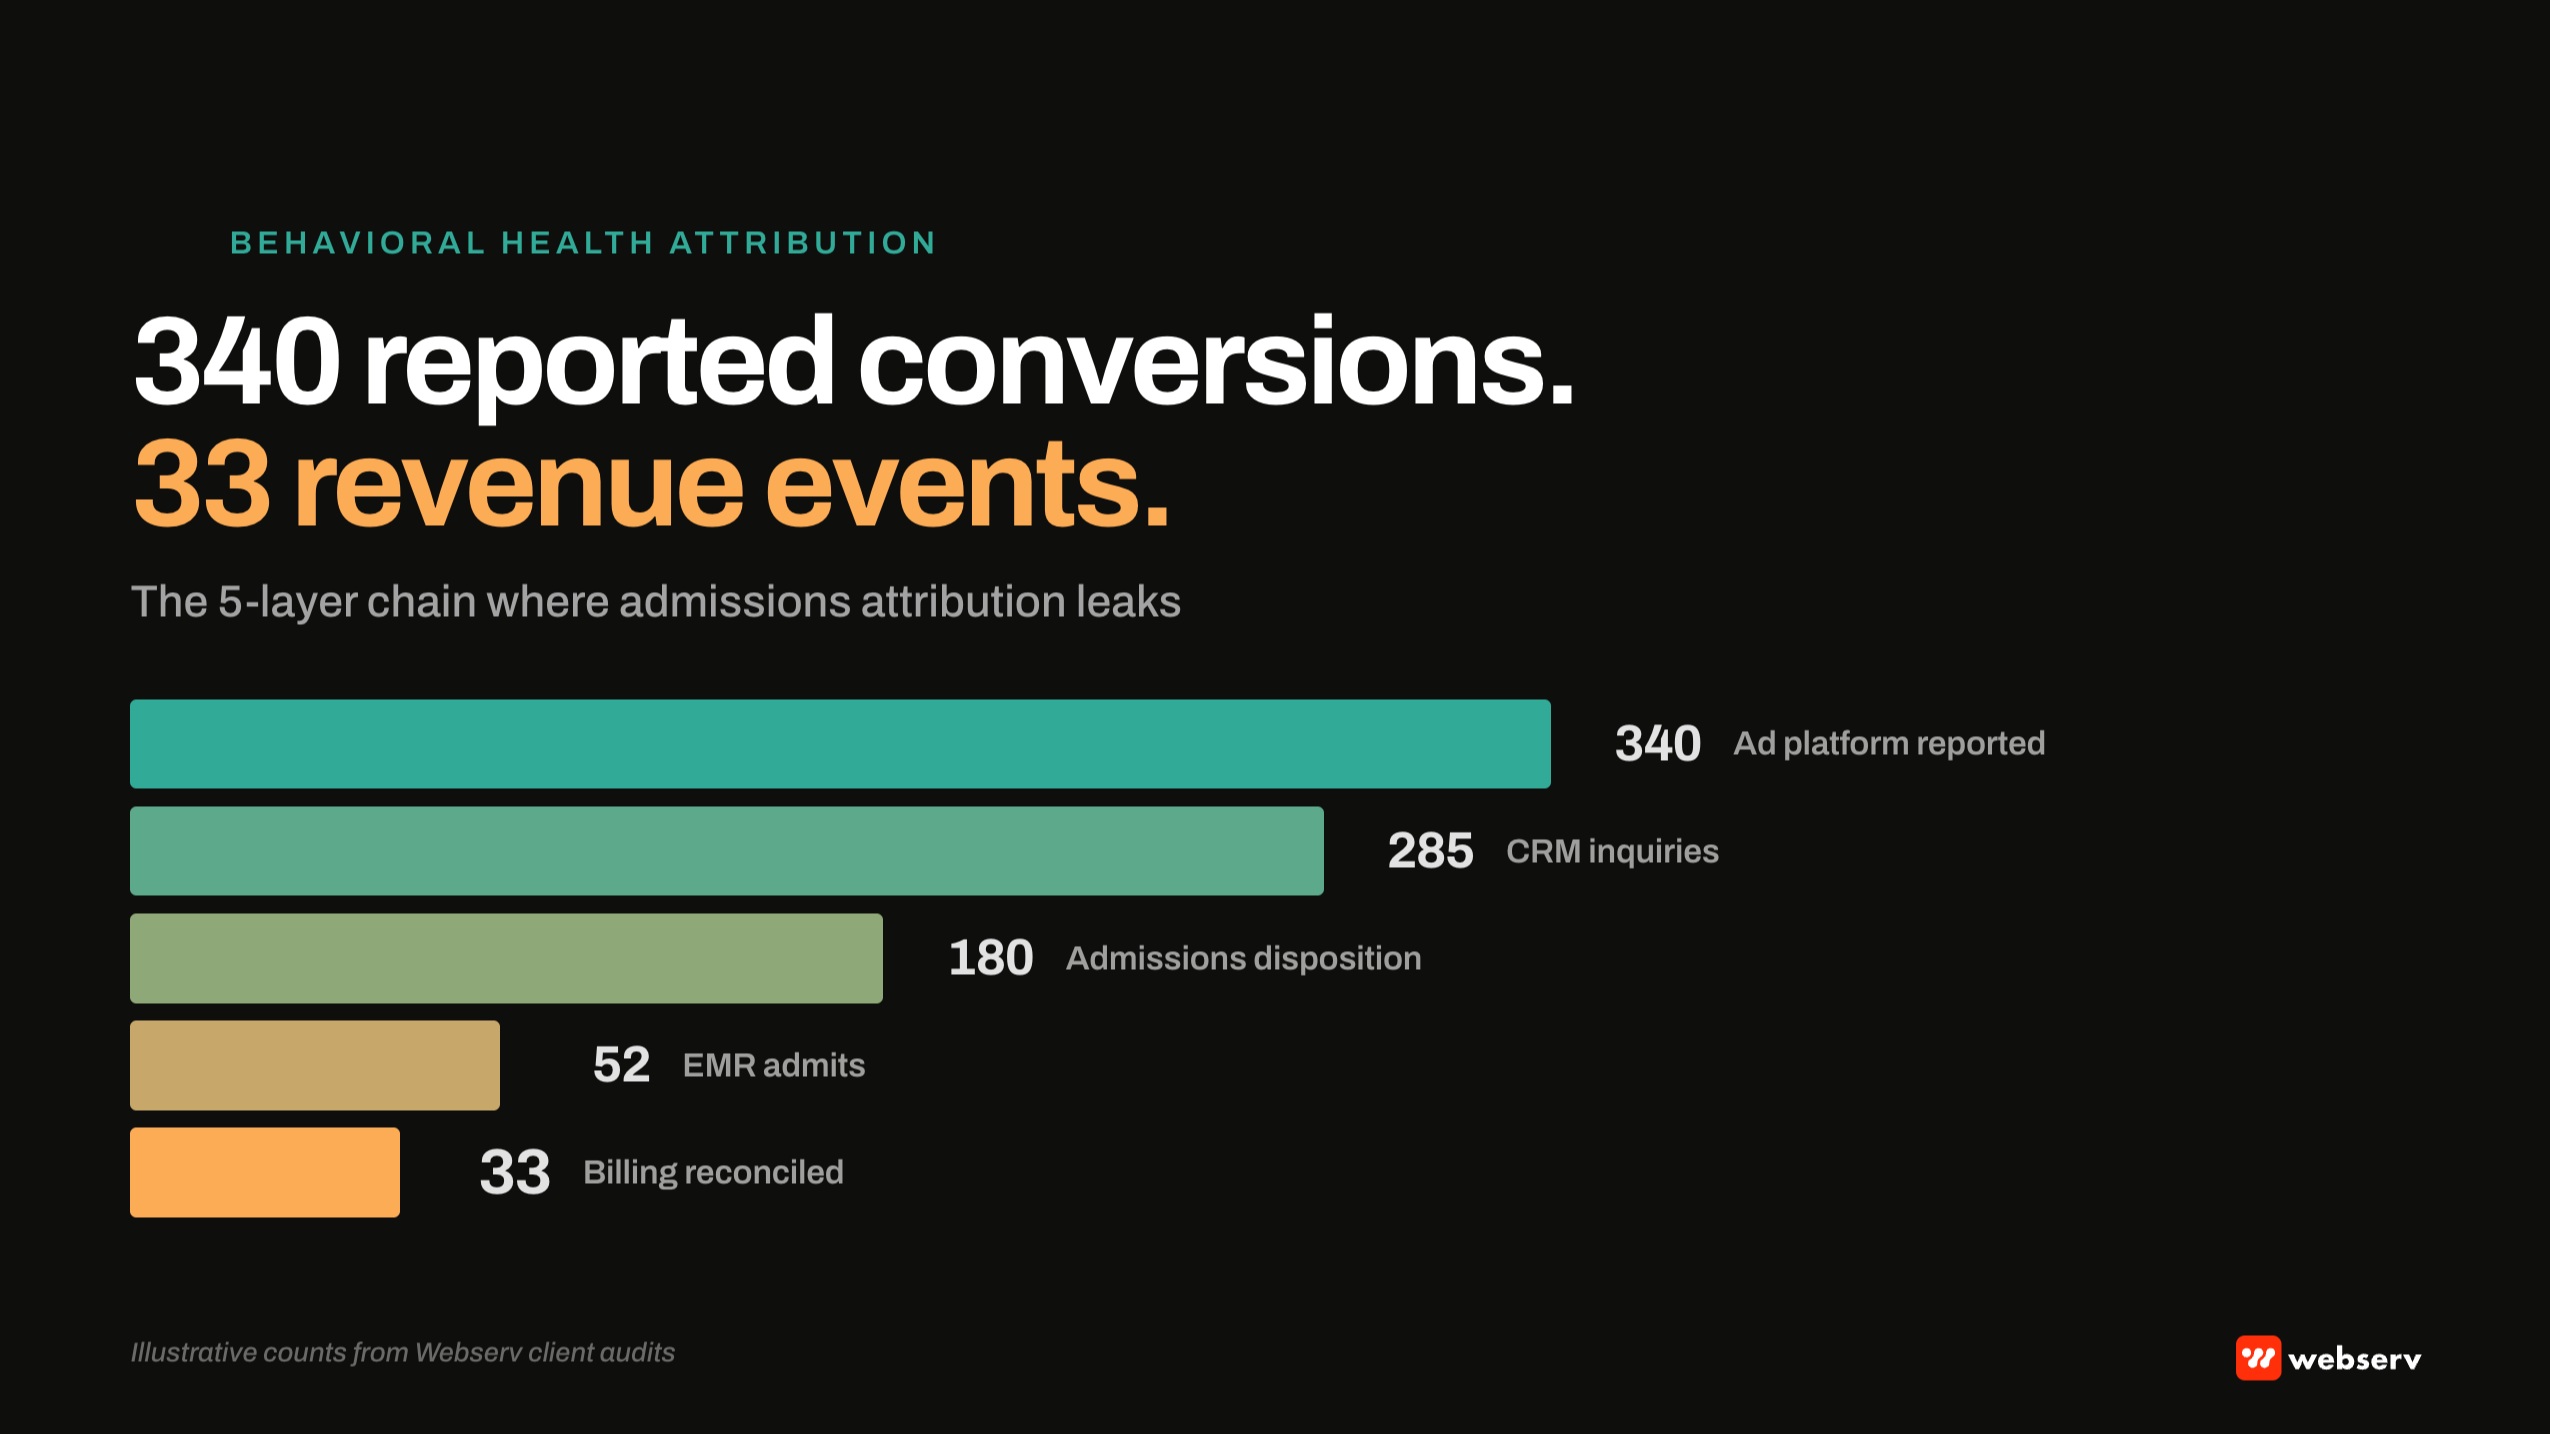
Attribution for treatment centers is a specific measurement discipline that spans marketing spend, admissions inquiries, admissions decisions, admits, and reimbursement realization. Most facilities measure the first two links in that chain and lose the last three.
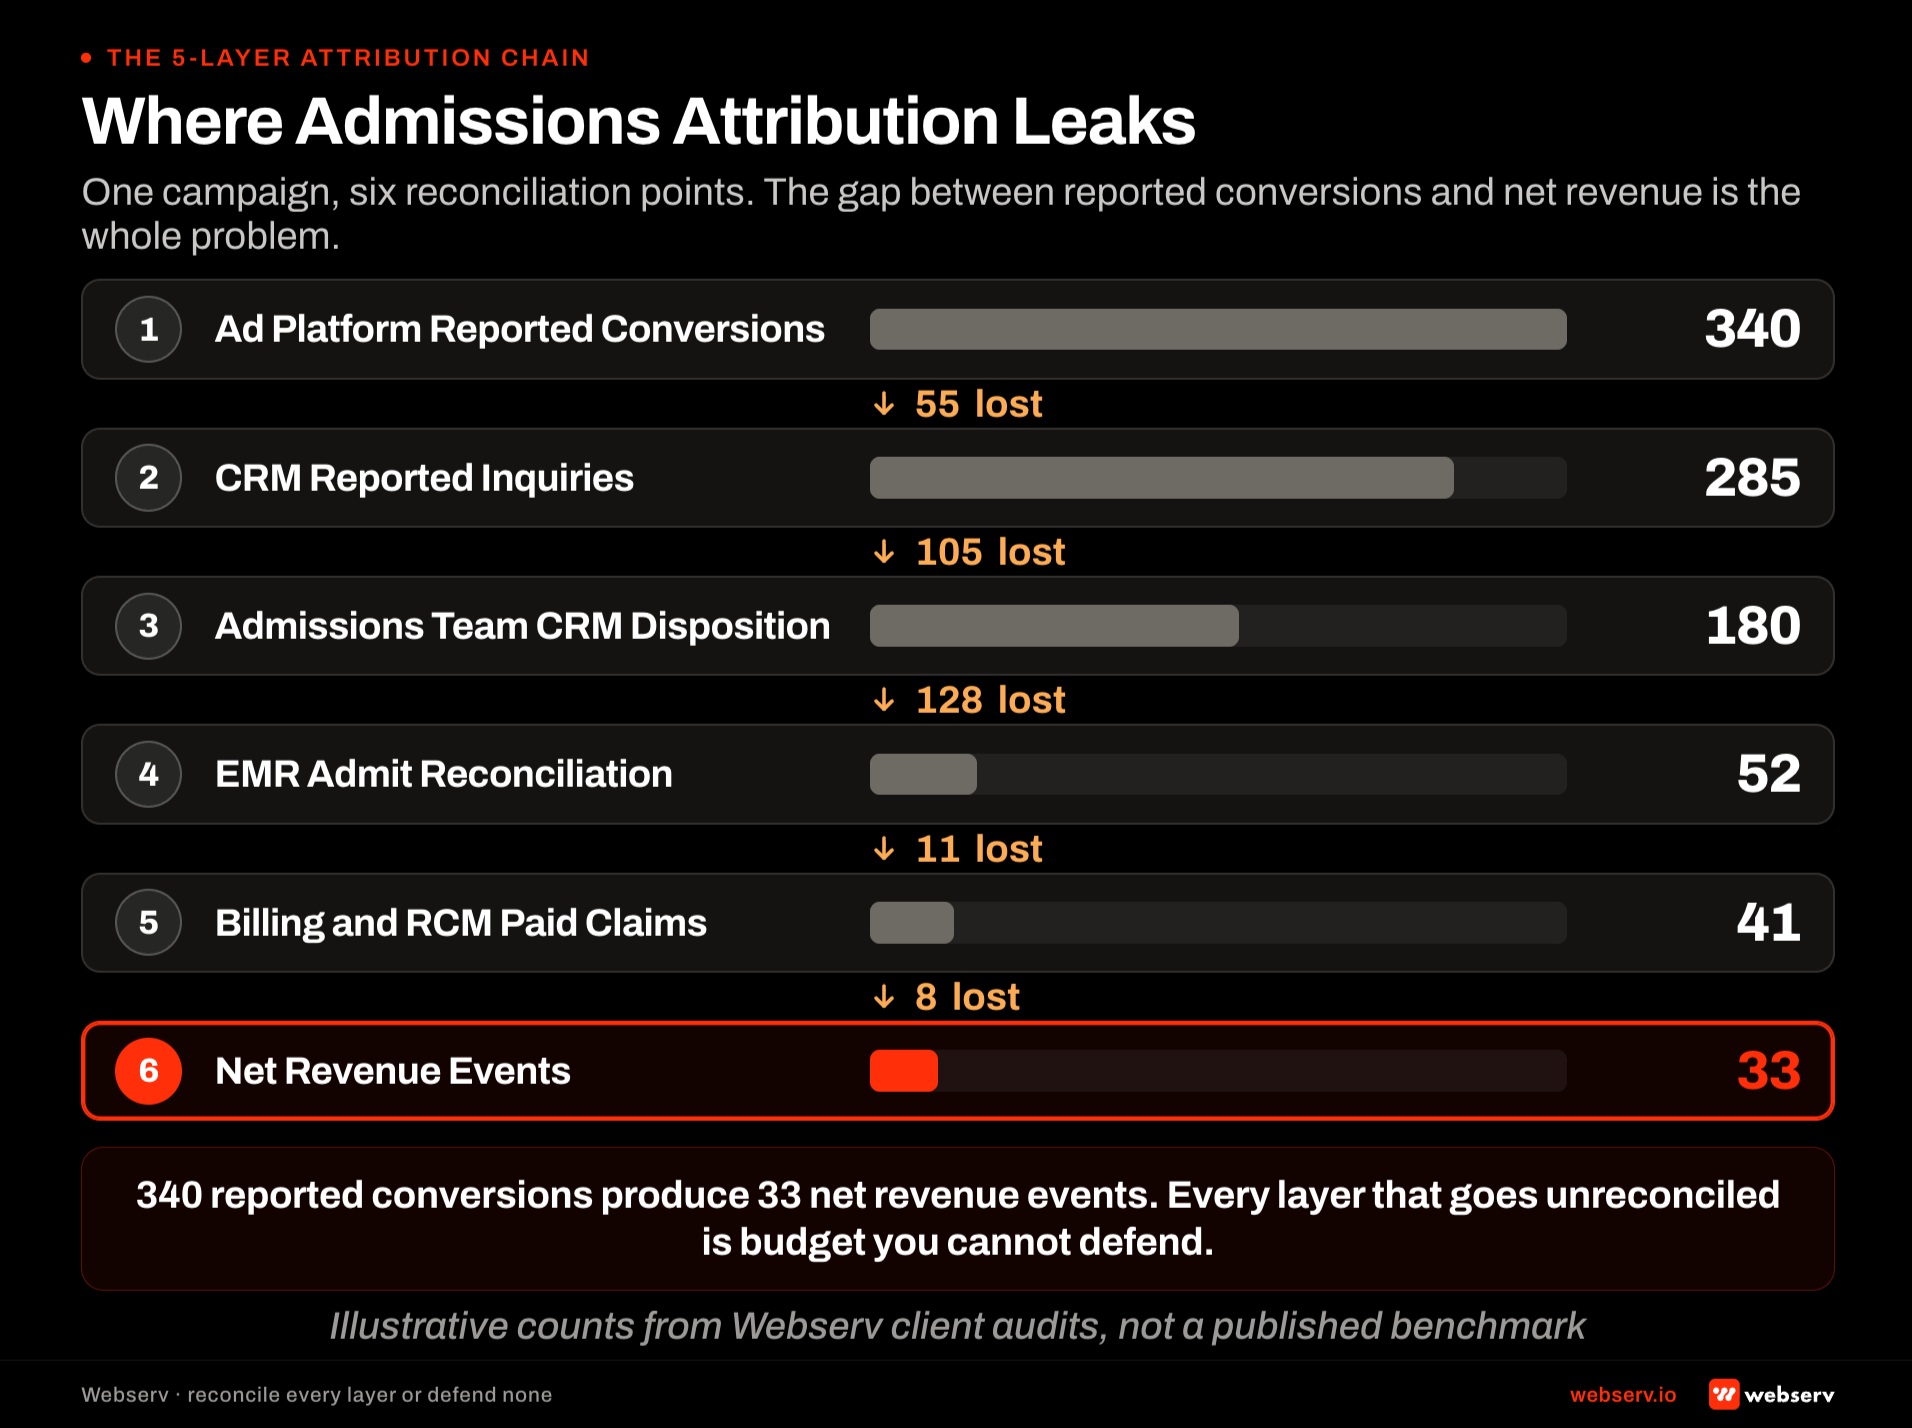
The typical pattern our admission ops team audits repeatedly at Webserv: Meta Ads Manager reports 340 conversions. Google Ads reports 285. Google Analytics reports 620 sessions attributed to paid campaigns.
The CRM shows 180 qualified inquiries. The admissions team reports 52 scheduled admits. The EMR shows 41 patients actually arrived. The billing system reports 33 admits that produced measurable reimbursement.
Every one of those numbers is correct in isolation. The chain between them is what is broken. Marketing looks at the first three, admissions looks at the middle two, billing looks at the last one, and nobody sees the whole chain end to end.
Budget decisions get made against the reported numbers at each layer, which is why marketing spend allocated to the “best-performing” channels often does not correlate with the channels producing actual revenue.
This piece is the operator-facing attribution reference our team runs on every treatment center engagement. It walks the five measurement layers, the four attribution methodologies operators can choose between, and the BH-specific challenges that break standard attribution frameworks.
It also covers the reference architecture that produces defensible attribution across the full chain, the implementation phases that get facilities from broken attribution to working attribution, and the reporting cadence that keeps the chain visible at the QBR level.
It is the reference we run every attribution engagement against and pairs with our BH Marketing ROI and Attribution Playbook, which covers methodology in operational depth, and our HIPAA-safe conversion tracking full-stack guide, which covers the technical infrastructure the attribution chain depends on. For the admissions ops side, see our Salesforce for treatment center admissions playbook. This is part of our broader work on behavioral health marketing.
Key Takeaways
- Attribution for treatment centers has five measurement layers spanning marketing spend, admissions inquiries, admissions dispositions, admit realization, and reimbursement realization. Most facilities measure the first two layers and lose the last three. The specific consequence is budget decisions that reward channels producing volume without producing revenue.
- The four attribution methodologies operators choose between are last-touch, first-touch, multi-touch, and cohort-based. Behavioral health specifically favors cohort-based attribution because the buying window is long (30 to 90+ days), the decision-maker is often a family member rather than the patient, and the revenue realization happens 60 to 120 days after admit.
- BH-specific attribution challenges: long consideration windows, multi-decision-maker family dynamics, HIPAA constraints on data flow across platforms, payer mix effects on revenue per admit, no-show rates that affect admit realization, and mid-treatment departure that affects reimbursement completion. Each challenge requires a specific configuration decision that generic attribution frameworks do not address.
- The reference architecture uses CRM as the source of truth, server-side tracking to keep PHI out of ad platforms, value-tier conversion events that let AI-optimized campaigns pursue admits rather than form-fills, and monthly reconciliation between platform-reported conversions and CRM-reported admits to catch signal drift.
- The implementation phases run over 90 to 180 days depending on starting condition. Phase 1 gets the CRM configured as source of truth. Phase 2 deploys server-side tracking. Phase 3 configures value-tier conversion events across ad platforms. Phase 4 builds the reporting cadence and reconciliation workflow.
DEFINITION
Treatment center attribution. The measurement discipline that connects marketing spend to reimbursement realization through five layers: ad platform reported conversions, CRM reported inquiries, admissions team disposition, EMR admit reconciliation, and billing / RCM reimbursement reconciliation. Four methodologies (last-touch, first-touch, multi-touch, cohort-based) decide how to assign credit across marketing touchpoints for the leads that produce admits.
Distinct from ad platform reporting (Layer 1 only), distinct from marketing mix modeling (top-down statistical rather than bottom-up lead-level), and distinct from generic e-commerce attribution frameworks that assume short buying windows and single-decision-maker purchases. Behavioral health has 30-90+ day consideration, family decision-makers, HIPAA constraints, and payer-dependent revenue per admit — cohort-based methodology handles those dynamics; last-touch reporting misrepresents them.
OPERATOR INSIGHT
Every number is correct in isolation. The chain between them is what is broken.
Meta reports 340 conversions. Google reports 285. GA4 reports 620 sessions. The CRM shows 180 qualified inquiries. Admissions reports 52 scheduled admits. The EMR shows 41 patients arrived. Billing reports 33 admits that produced measurable reimbursement. Marketing looks at the first three, admissions looks at the middle two, billing looks at the last one, and nobody sees the whole chain end to end. Budget decisions get made against the reported numbers at each layer — which is why marketing spend allocated to the “best-performing” channels often does not correlate with the channels producing actual revenue.
The five measurement layers
Attribution for treatment centers spans five distinct measurement layers. Each layer measures a different step in the chain from marketing spend to realized revenue. Facilities that treat one layer as the whole picture produce budget decisions that misread the underlying operational reality.
Layer 1: Ad platform reported conversions
Meta Ads Manager, Google Ads, LinkedIn Ads. Each platform reports conversions its own way, based on its own attribution window (typically 7-day click or 1-day view for Meta, 30-day click for Google). Platform conversions are self-reported by the platform against its own tracking infrastructure and its own attribution logic. Useful for optimizing within the platform. Systematically overstates the platform’s actual contribution to admits.
Layer 2: CRM reported inquiries
Kipu CRM, Salesforce, HubSpot, Sunwave CRM. The CRM captures inquiries with source attribution (from UTM parameters, call tracking, or form referrer data). The CRM is typically the first internal system that sees the lead. Source attribution quality at this layer depends on the tracking discipline of the marketing and admissions teams: consistent UTM parameters, working call tracking, standardized source field discipline.
Layer 3: Admissions team CRM disposition
The admissions team updates the CRM as leads move through the funnel: VOB completed, family scheduled, admit day confirmed, admit day arrival, and no-show or cancellation. Each disposition state carries meaning for the attribution model because different channels produce leads with different downstream disposition rates. Facilities without disciplined disposition workflow produce attribution data with holes.
Layer 4: EMR admit reconciliation
Kipu EMR, Sunwave EMR, BestNotes, Alleva. The EMR records patients who actually arrived and became formal patients of the facility. This is the operational admit count that matters for revenue. The gap between CRM-reported admits and EMR-reconciled admits is often meaningful because CRM records include scheduled admits that no-showed. Reconciliation between Layer 3 and Layer 4 is where the gap becomes visible.
Layer 5: Billing and RCM reimbursement reconciliation
The billing system or RCM partner records actual reimbursement realized per admit, typically 60 to 120 days after the admit. Reimbursement varies dramatically by payer, level of care, and length of stay. The gap between EMR admits and billing-reconciled admits captures which admits actually produced measurable revenue. Our out-of-network reimbursement math piece covers the specific Layer 5 mechanics in depth.
The full attribution chain produces revenue-per-channel data only when all five layers are connected. Facilities measuring only Layers 1 and 2 produce channel performance reporting that looks correct but does not reflect actual revenue.
The four attribution methodologies
Once the five measurement layers are in place, the attribution methodology decides how to assign credit across marketing touchpoints for the leads that produce admits.
Last-touch attribution
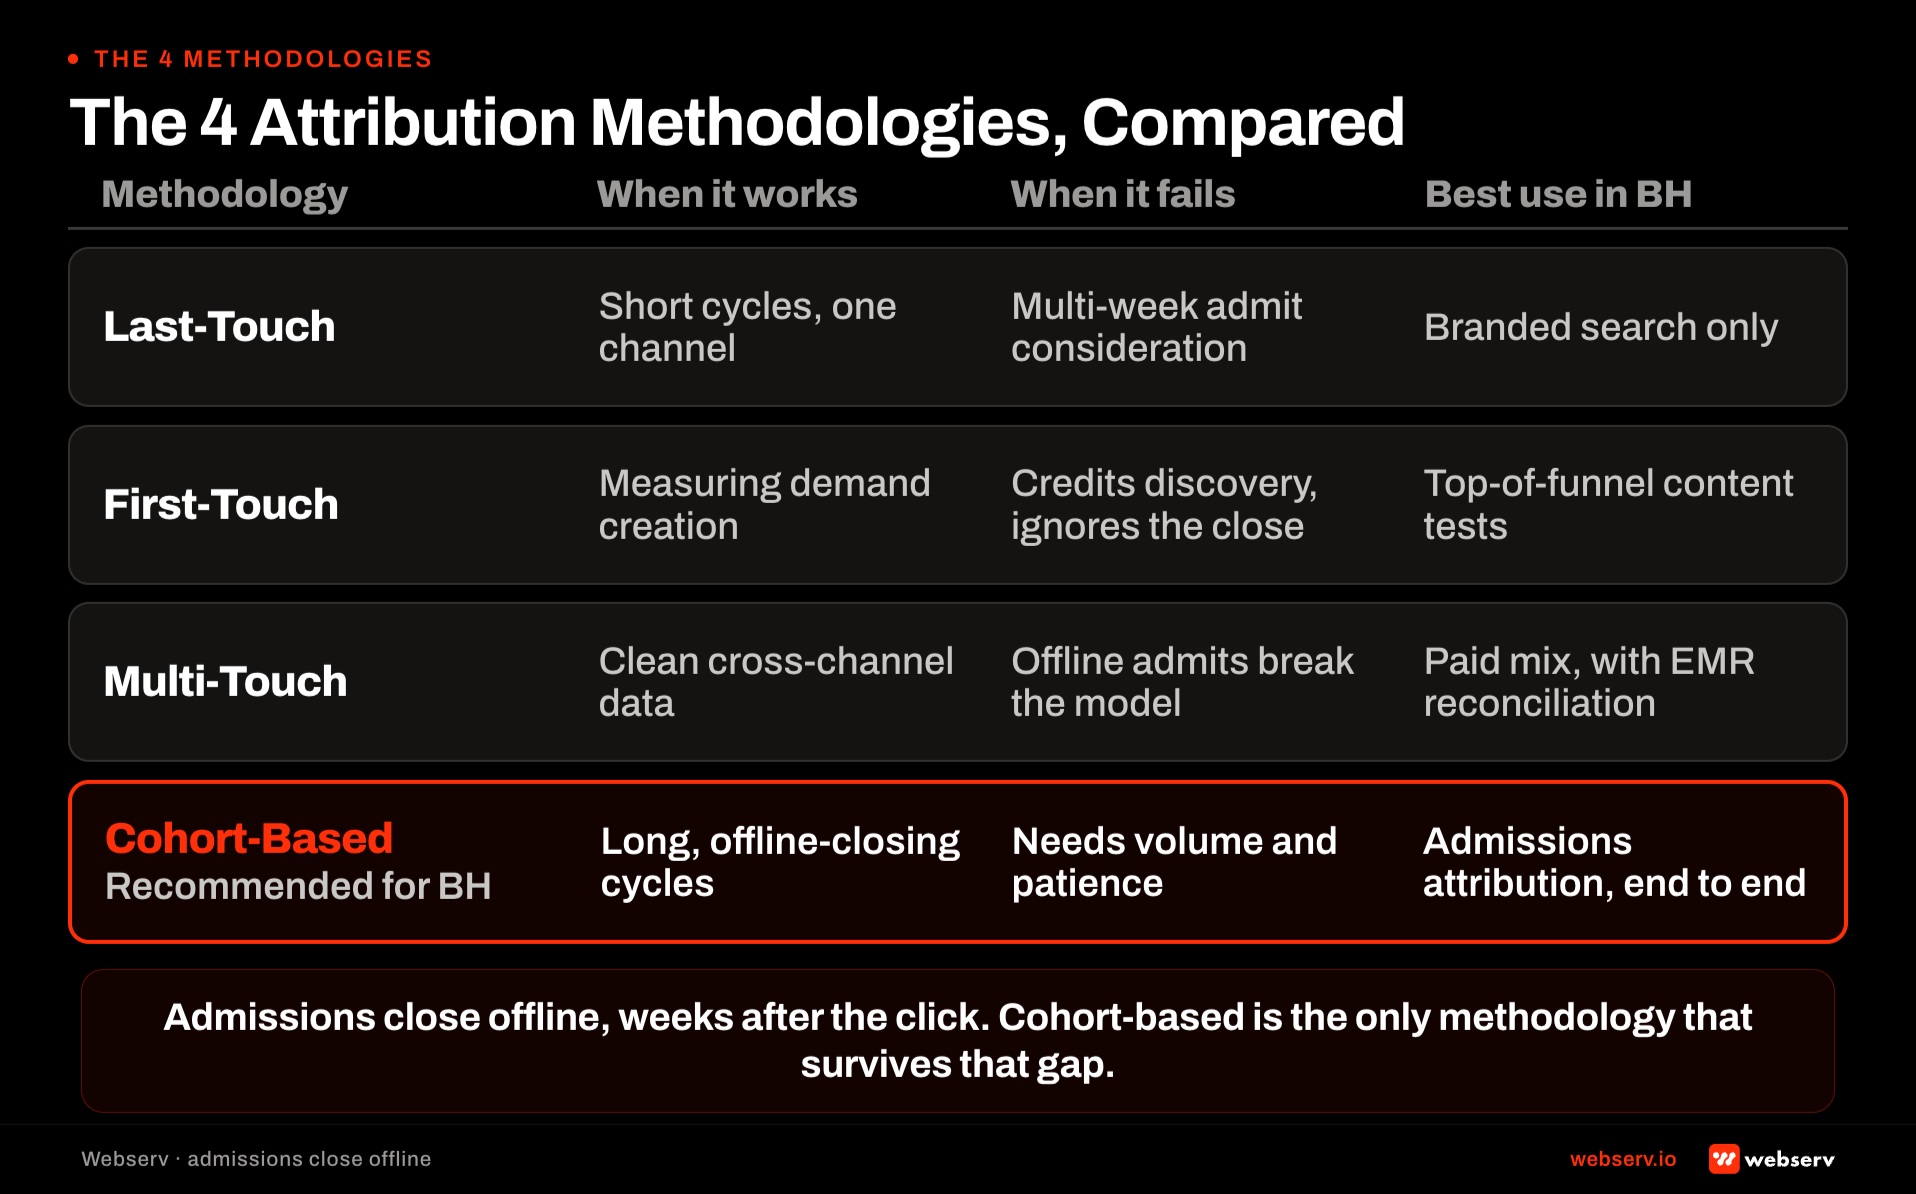
Credits the final marketing touchpoint before the inquiry. Simplest to implement and most common default in Google Analytics and ad platform reporting. Systematically overweights branded search and direct navigation because those touchpoints tend to appear last in the buying journey. Systematically underweights upper-funnel channels that introduced the lead months before the eventual inquiry.
First-touch attribution
Credits the initial marketing touchpoint that introduced the lead. Systematically overweights upper-funnel channels and underweights the closing channels that convert warm leads. Useful for evaluating awareness campaigns but misleading if used as the sole attribution model.
Multi-touch attribution
Distributes credit across multiple touchpoints in the buying journey using a weighting model (linear, time-decay, position-based, or algorithmic). Better than last-touch or first-touch for showing the full picture but requires enough conversion volume to produce statistically defensible weightings. Facilities under roughly 40-60 conversions per month may not have the volume for defensible multi-touch weightings.
Cohort-based attribution
Groups leads by inquiry cohort (typically monthly) and follows the cohort through the full five-layer chain. Reports revenue realized per cohort against marketing spend allocated in the cohort period. This methodology fits behavioral health specifically because the long consideration window makes touch-level attribution unreliable, and the 60-120 day reimbursement realization means the revenue attribution has to be time-shifted.
For most treatment centers, cohort-based attribution is the primary methodology, with multi-touch attribution as a supporting view for facilities with sufficient volume. Our BH Marketing ROI and Attribution Playbook walks the methodology comparison in operational depth.
The attribution surface at a glance
5
Measurement layers: ad platform, CRM, admissions disposition, EMR, billing
4
Methodologies: last-touch, first-touch, multi-touch, cohort-based
90-180 d
Full implementation timeline across 4 phases
15%
Reconciliation variance threshold triggering monthly investigation
The BH-specific attribution challenges
Five specific challenges undermine standard attribution frameworks in behavioral health.
Long consideration windows. Families researching treatment for a loved one typically move through a 30 to 90 day decision window. Some families move faster in acute-need situations. Some take longer. Ad platform attribution windows (7-day click for Meta, 30-day click for Google) miss the meaningful share of admits that come from touchpoints outside the platform’s window.
Multi-decision-maker family dynamics. The person who searches for the facility is often not the person who calls, and the person who calls is often not the patient. The buying journey involves multiple people on multiple devices, which produces attribution noise across cookie-based tracking. Server-side tracking with hashed identifiers partially resolves this but cannot eliminate the cross-device attribution challenge.
HIPAA constraints on data flow. PHI cannot flow to ad platforms without BAA coverage. This constrains what conversion signal can be transmitted and produces reporting that cannot include PHI-adjacent detail even at the CRM layer. Our HIPAA-safe conversion tracking piece walks the specific technical architecture that keeps PHI out of ad platforms while preserving attribution signal.
Payer mix effects on revenue per admit. Two admits from the same channel produce different revenue depending on payer. A channel producing 20 admits from cash-pay or OON payers may generate materially more revenue than a channel producing 30 admits from Medicaid or heavily discounted in-network plans. Attribution that reports admit counts without payer mix produces misleading channel comparisons.
No-show and mid-treatment departure. Scheduled admits that no-show or arrive but leave before completing treatment reduce realized revenue below the nominal admit count. Different channels produce different no-show and completion rates. Attribution that reports scheduled admits without tracking through to completion overstates the revenue from channels with high no-show rates.
The reference architecture
The reference architecture that produces defensible attribution across the full chain has four load-bearing components.
Component 1: CRM as source of truth. All leads flow through the CRM with clean source attribution at the point of inquiry. Every admissions disposition update happens in the CRM. Every downstream reconciliation (EMR admit confirmation, billing reimbursement) writes back to the CRM record. When attribution reports differ across systems, the CRM is the authoritative reference.
Component 2: Server-side tracking infrastructure. Google Tag Manager Server-Side (or equivalent server-side layer) receives conversion events from the CRM and transmits them to ad platforms with PHI stripped and identifiers hashed. This layer keeps PHI out of ad platforms while preserving conversion signal for AI-optimization purposes.
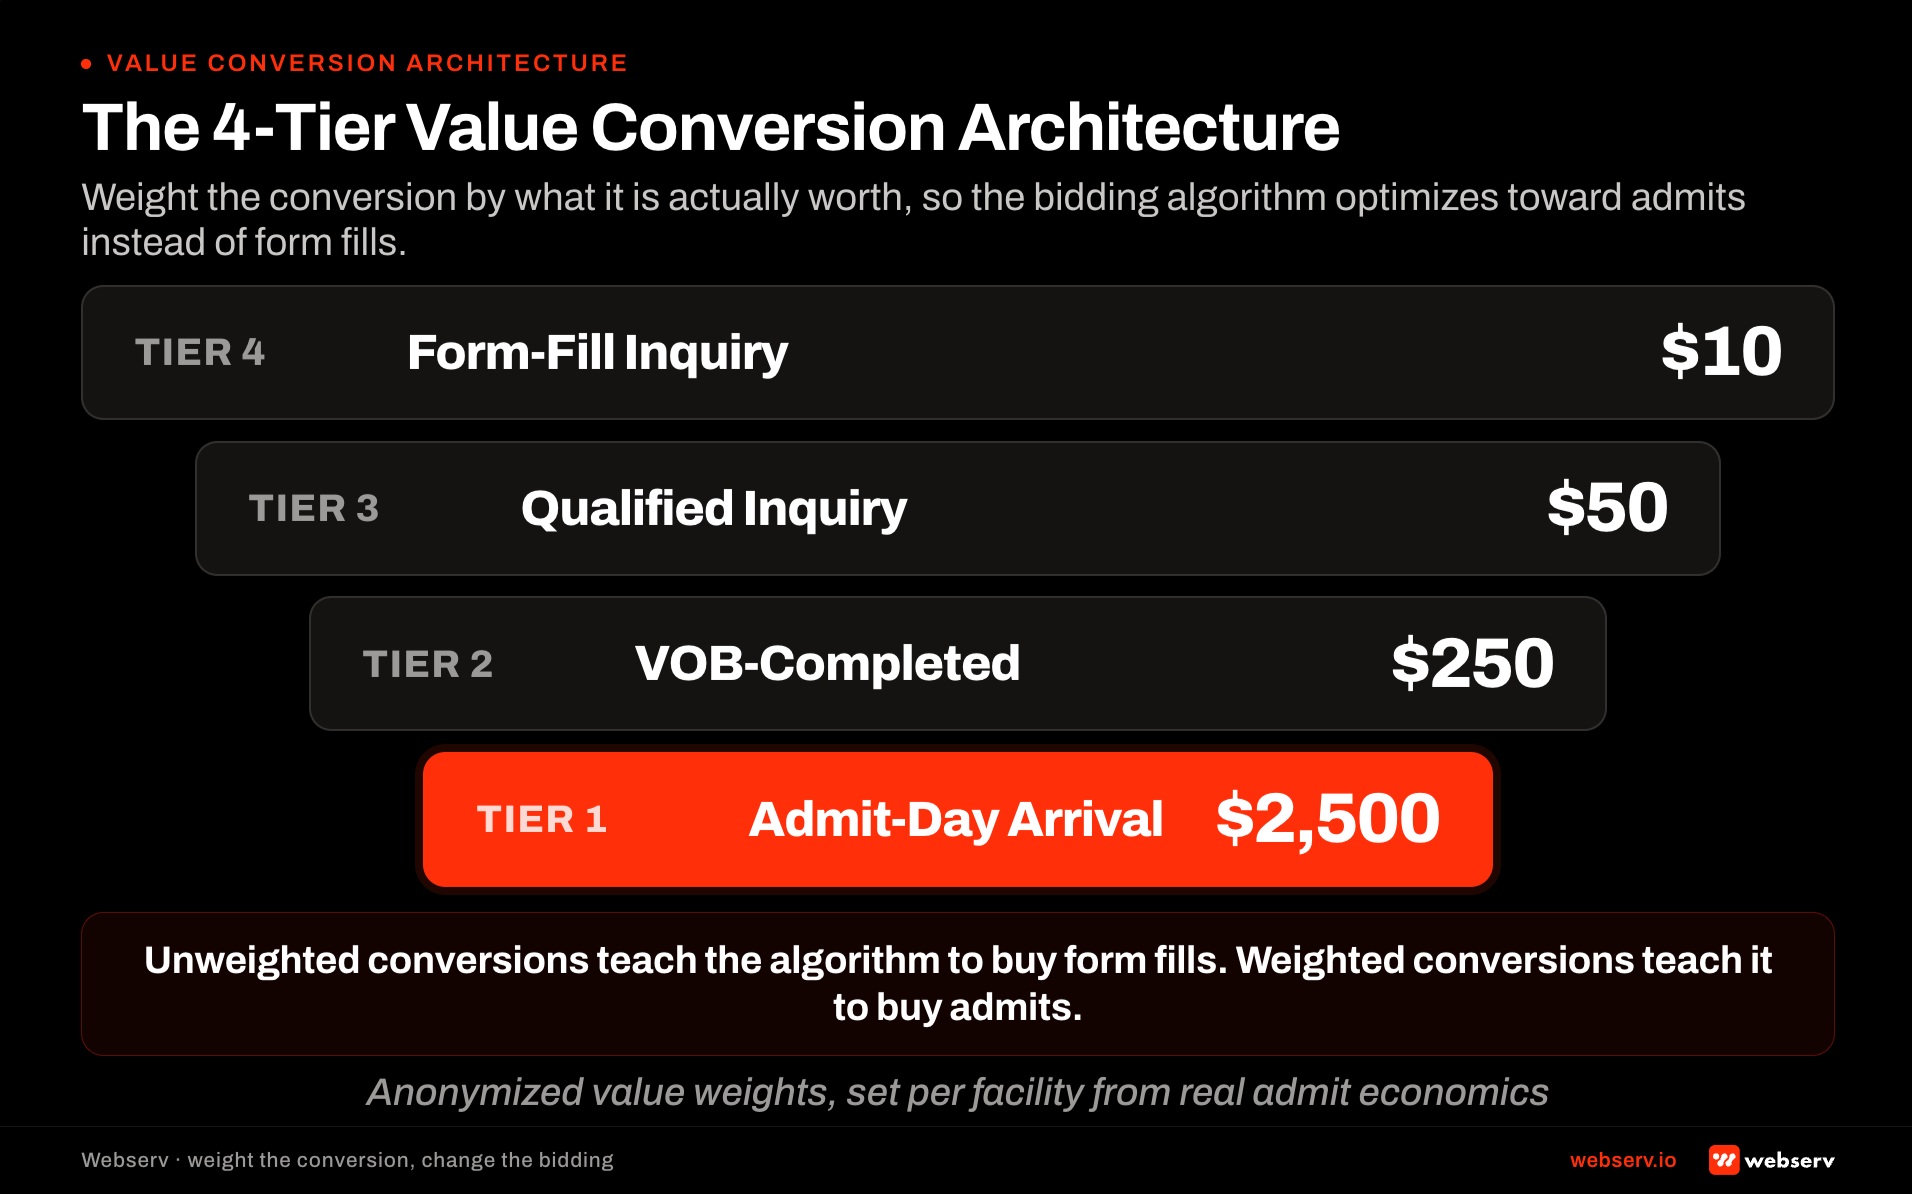
Component 3: Value-tier conversion events. Not every inquiry has the same value. The specific conversion event architecture that works: form-fill inquiry as Tier 4 (low value), qualified inquiry as Tier 3, VOB-completed inquiry as Tier 2, admit-day arrival as Tier 1 (full value). Ad platforms configured to optimize against value-weighted conversions pursue admits rather than form-fills.
Component 4: Monthly reconciliation workflow. Every month, pull platform-reported conversions, CRM-reported inquiries, CRM-reported admits, EMR-confirmed admits, and billing-reconciled reimbursement. Compare the numbers layer by layer. Investigate any discrepancy greater than 15 percent between adjacent layers. Document findings in the QBR reporting.
The implementation phases
Facilities under-invested in attribution typically run through four implementation phases over 90 to 180 days.
Phase 1 (Weeks 1-4): CRM as source of truth. Confirm CRM captures every lead with source attribution intact. Configure UTM parameter passthrough from paid campaigns. Configure call tracking integration (CallTrackingMetrics or CallRail) to write source data to CRM records. Standardize the admissions team disposition workflow so every lead has current status.
Phase 2 (Weeks 5-8): Server-side tracking deployment. Deploy Google Tag Manager Server-Side or equivalent server-side container. Configure the CRM webhook to fire conversion events to the server-side container at each meaningful lifecycle event. Configure the container to transmit to Meta Conversions API, Google Enhanced Conversions, and GA4 with PHI stripped and identifiers hashed.
Phase 3 (Weeks 9-12): Value-tier conversion events. Configure the four value tiers (form-fill, qualified inquiry, VOB-completed, admit-day arrival) in both Meta Ads Manager and Google Ads. Configure the ad platforms to optimize against value-weighted conversions rather than unweighted counts. Verify AI Max and Meta Advantage+ campaigns are consuming the tiered signal.
Phase 4 (Weeks 13-24): Reconciliation workflow and reporting cadence. Build the monthly reconciliation workflow across the five measurement layers. Build the QBR-level reporting that surfaces the full chain to marketing leadership, admissions leadership, and CFO or ownership. Establish the cadence for reviewing attribution outputs. Our marketing-admissions QBR playbook covers the specific reporting structure this phase produces.
Facilities that compress the phases into a single sprint typically produce partial deployment where some layers work and others do not.
The specific dependency is that the CRM has to be the source of truth before the server-side tracking layer can transmit clean signal, and value-tier events cannot function correctly against a CRM that does not consistently capture admissions dispositions.
DO
- Treat the CRM as source of truth — every reconciliation reads from the CRM record, not from ad platform reports.
- Run cohort-based attribution as primary methodology — BH’s 30-90 day consideration window and 60-120 day reimbursement realization require it.
- Configure value-tier conversion events (form-fill Tier 4, qualified inquiry Tier 3, VOB completed Tier 2, admit-day arrival Tier 1) so AI-optimized campaigns pursue admits.
- Reconcile monthly across all 5 layers — investigate any variance greater than 15% between adjacent layers.
- Run all 3 cadences (weekly operational / monthly tactical / quarterly strategic) — each supports different decisions.
DON’T
- Treat ad platform reported conversions as ground truth — Meta says 340, CRM admits from Meta cohorts often round to 22.
- Transmit PHI through client-side pixels — HIPAA violation. Server-side layer with hashed identifiers is the only defensible path.
- Ship server-side tracking with all events equal-weighted — AI Max and Advantage+ optimize toward cheapest conversion (form-fill), CPA looks good, admits collapse.
- Report last-touch data at QBR level as if it reflects revenue — last-touch systematically overweights branded search and underweights upper-funnel touchpoints.
- Compress the 4 phases into a single sprint — the CRM has to be source of truth BEFORE the server-side layer can transmit clean signal.
The reporting cadence
Attribution reporting needs to run at three cadences to serve the specific decisions each cadence supports.
Weekly (operational). Ad platform performance against unweighted conversion counts. Used by paid media managers to identify campaigns underperforming versus baseline and adjust bids or creative rotation. Not the full attribution picture but useful for tactical optimization inside campaigns.
Monthly (tactical). Reconciliation across the five measurement layers. Cohort performance for the trailing 30 days versus the prior 30 days. Value-tier conversion event volume by channel. Used by marketing leadership and admissions leadership to identify channel performance shifts and adjust budget allocation across channels.
Quarterly (strategic). Full cohort-based revenue attribution across the trailing 90 to 180 days. Channel-level revenue realized versus channel spend. Payer mix analysis by channel. LTV analysis where available. Used at QBR level by ownership, marketing leadership, admissions leadership, and CFO to make budget allocation decisions for the coming quarter.
Facilities that run only weekly reporting produce optimization decisions inside campaigns without visibility into whether the campaigns are producing the right admits. Facilities that run only quarterly reporting produce strategic decisions without the tactical monthly signal to adjust between quarters. All three cadences serve different decisions and all three are load-bearing.
Common failure modes
Five patterns produce most of the attribution failures we audit in treatment center accounts.
Failure mode 1: Ad platform conversions treated as ground truth. Meta reports 340 conversions. Marketing assumes 340 admits are attributable to Meta. Actual admits from Meta cohorts are 22. Budget decisions get made against the wrong number. Fix: CRM as source of truth, monthly reconciliation.
Failure mode 2: CRM without disposition discipline. Leads arrive in the CRM. Admissions team updates dispositions inconsistently. Attribution reports pull from CRM records that do not accurately reflect operational reality. Reporting looks defensible but reflects data quality issues rather than actual performance. Fix: standardize the disposition workflow via our admissions process piece, then rebuild reporting against clean data.
Failure mode 3: Server-side tracking without value tiers. Server-side infrastructure is in place, transmitting conversion events to ad platforms. But all events transmit as equally-weighted conversions. AI Max and Meta Advantage+ optimize toward the cheapest conversion type, which is usually form-fill inquiry. CPA looks strong. Admits collapse. Fix: value-tier conversion event configuration per the reference architecture.
Failure mode 4: No connection between EMR and CRM. Marketing sees CRM admits. Billing sees EMR admits. Nobody reconciles the gap. Reimbursement realization by channel is unknown, which means payer mix by channel is unknown, which means channels producing low-value admits look equivalent to channels producing high-value admits. Fix: EMR-to-CRM reconciliation as part of Phase 4.
Failure mode 5: Cohort methodology applied without operational discipline. Facility adopts cohort-based attribution conceptually but continues to make tactical decisions on last-touch data because the cohort reporting is not built or is inconsistent. Cohort methodology only works when the cohort reporting is actually built and reviewed at monthly cadence.
How attribution fits with the broader stack
Attribution is not a standalone discipline. It sits on top of the admissions ops software stack and depends on that stack functioning cleanly. Our admissions ops software stack map covers the six-category stack (CRM, EMR, call tracking, VOB automation, attribution, communications) and the five data flows that connect them.
The specific dependency: attribution reporting depends on Flow 5 (CRM plus call tracking to attribution) and Flow 4 (EMR back to CRM for reimbursement reconciliation). Facilities with broken flows in the underlying stack produce attribution reports that reflect the broken flows rather than actual marketing performance. Our admissions operations complete guide covers the operational discipline layer.
Attribution also connects to the AI-readability stack on the SEO side. Organic attribution requires GA4 configured with value-tier events, which is the same infrastructure paid attribution depends on. Facilities running strong paid attribution but weak organic attribution produce budget allocation decisions that systematically under-invest in organic.
Frequently Asked Questions
How long does it take to see improvement in marketing performance after fixing attribution?
Between 60 and 120 days for measurable channel-level performance shifts. The specific pattern: Phase 1 through Phase 3 deployment produces the infrastructure over 12 weeks. AI-optimized campaigns begin adjusting toward value-weighted conversions immediately upon Phase 3 completion. The optimization typically stabilizes 30 to 45 days after value tiers go live. Cohort reporting produces the first full cohort view at 60 to 90 days.
Facilities that expect faster results usually see mid-deployment noise (campaigns underperform temporarily as AI models adjust to the new value signal) and misinterpret the noise as a signal to revert. The correct posture is to expect 60 to 120 days of adjustment before the improvement becomes visible in cohort reporting.
Beyond 120 days, well-configured attribution compounds. The specific compounding: AI-optimized campaigns get progressively better at identifying prospects likely to convert to Tier 1 admits, cohort reporting produces better budget allocation decisions, and the payer mix improvement produces higher realized revenue per admit at the same or lower spend.
Which CRM should we use to support attribution?
Depends on the EMR the facility already runs. If Kipu is the EMR, Kipu CRM is typically the fastest path because the CRM-to-EMR handoff is native.
If Sunwave, BestNotes, or Alleva is the EMR, the bundled CRM from the same platform is usually cleanest. If the EMR is a custom system or an enterprise platform without a bundled CRM, Salesforce with a BH-specific configuration or HubSpot Enterprise are the two most common paths.
The specific requirements for attribution: the CRM has to support webhooks (to fire conversion events to server-side tracking), has to capture source attribution at inquiry, has to support custom fields for the value-tier disposition events, and has to reconcile against the EMR for admit confirmation. Facilities running attribution against a CRM that does not support webhooks require middleware , our CRM migration piece covers the platform decision framework.
How does attribution work for organic and referral traffic?
Organic traffic gets tracked through GA4 with the same value-tier events as paid traffic. Referral partner leads get tracked with source attribution in the CRM (referral partner name, referral date). Word-of-mouth and alumni referrals typically get captured through call tracking or the CRM’s manual source field.
The specific challenge for organic and referral attribution: the touchpoints are harder to identify at the platform level. GA4 sees the organic session but does not know which specific content asset produced the eventual admit unless URL-level tracking is configured. Referral partners typically produce leads that call directly, which requires call tracking to capture the source.
Our referral partner attribution piece covers the specific attribution workflow for referral partner leads. Facilities running strong paid attribution but weak organic and referral attribution typically discover 6 to 12 months in that the channel mix reporting is systematically biased toward the channels with the best measurement.
What’s the difference between attribution and marketing mix modeling?
Attribution is bottom-up. It follows specific leads through the buying journey and attempts to credit specific touchpoints for specific admits.
Marketing mix modeling (MMM) is top-down. It uses statistical modeling against aggregate marketing spend and aggregate revenue to estimate the contribution of each channel to overall revenue. MMM does not require lead-level tracking and works even in environments with heavy privacy restrictions.
For most treatment centers under $50K per month in paid media spend, attribution is sufficient and MMM adds complexity without materially improving budget decisions. Above $50K per month with meaningful spend across five or more channels, MMM begins to add value as a complementary layer to attribution. Facilities running only MMM without attribution produce strategic budget allocation without the tactical detail attribution provides.
How does attribution interact with HIPAA compliance?
Directly. Attribution requires transmitting conversion signal to ad platforms. Ad platforms do not offer BAAs. Therefore attribution has to strip PHI before transmission or the attribution deployment itself becomes a HIPAA violation.
The specific compliance-safe pattern: CRM fires conversion events to server-side tracking with PHI stripped and identifiers hashed. Server-side tracking transmits to Meta CAPI, Google Enhanced Conversions, and GA4 with the same hashed identifiers. Ad platforms use the hashed identifiers for lookalike matching without receiving PHI directly.
Facilities that attempt attribution without the server-side layer typically transmit PHI to ad platforms through client-side pixels. This is a HIPAA violation and produces regulatory exposure that exceeds the attribution benefit. Our HIPAA-safe conversion tracking full-stack guide covers the specific compliance-safe architecture in operational depth.
Should we build attribution internally or work with an agency?
Depends on internal team capacity. The specific work required: CRM configuration, server-side tracking deployment, ad platform value-tier event configuration, monthly reconciliation workflow, and QBR-level reporting.
Facilities with a dedicated marketing operations person or team can typically handle the deployment internally with 60 to 120 hours of focused work over 90 to 180 days. Facilities without dedicated marketing operations capacity typically need agency support for the initial deployment even if ongoing operation moves in-house.
The specific gotcha: agencies that build attribution as a one-time deployment without ongoing reconciliation workflow produce infrastructure that drifts within 60 to 90 days of handoff. The reconciliation cadence is the load-bearing operational discipline. Facilities that build attribution without committing to the monthly reconciliation workflow typically produce infrastructure that stops reflecting operational reality within a quarter.
How do we know if our attribution is actually working?
Three specific tests. First: platform-reported conversions and CRM-reported admits reconcile within 15 percent for the same period. Larger gaps indicate signal loss or duplication somewhere in the chain.
Second: AI-optimized campaigns (AI Max, Meta Advantage+) shift budget over 60 to 90 days toward the channels producing Tier 1 and Tier 2 conversions rather than Tier 3 and Tier 4. If AI-optimized campaigns do not shift, the value-tier configuration is probably not transmitting correctly.
Third: cohort-based revenue reporting produces channel performance rankings that differ meaningfully from last-touch reporting. If cohort reporting matches last-touch reporting perfectly, the cohort methodology is probably being applied to the same underlying data without independent reconciliation, which defeats the purpose. Facilities passing all three tests have attribution that reflects operational reality.
Trevor Gage is the Director of Marketing at Webserv, a digital marketing agency for treatment centers.