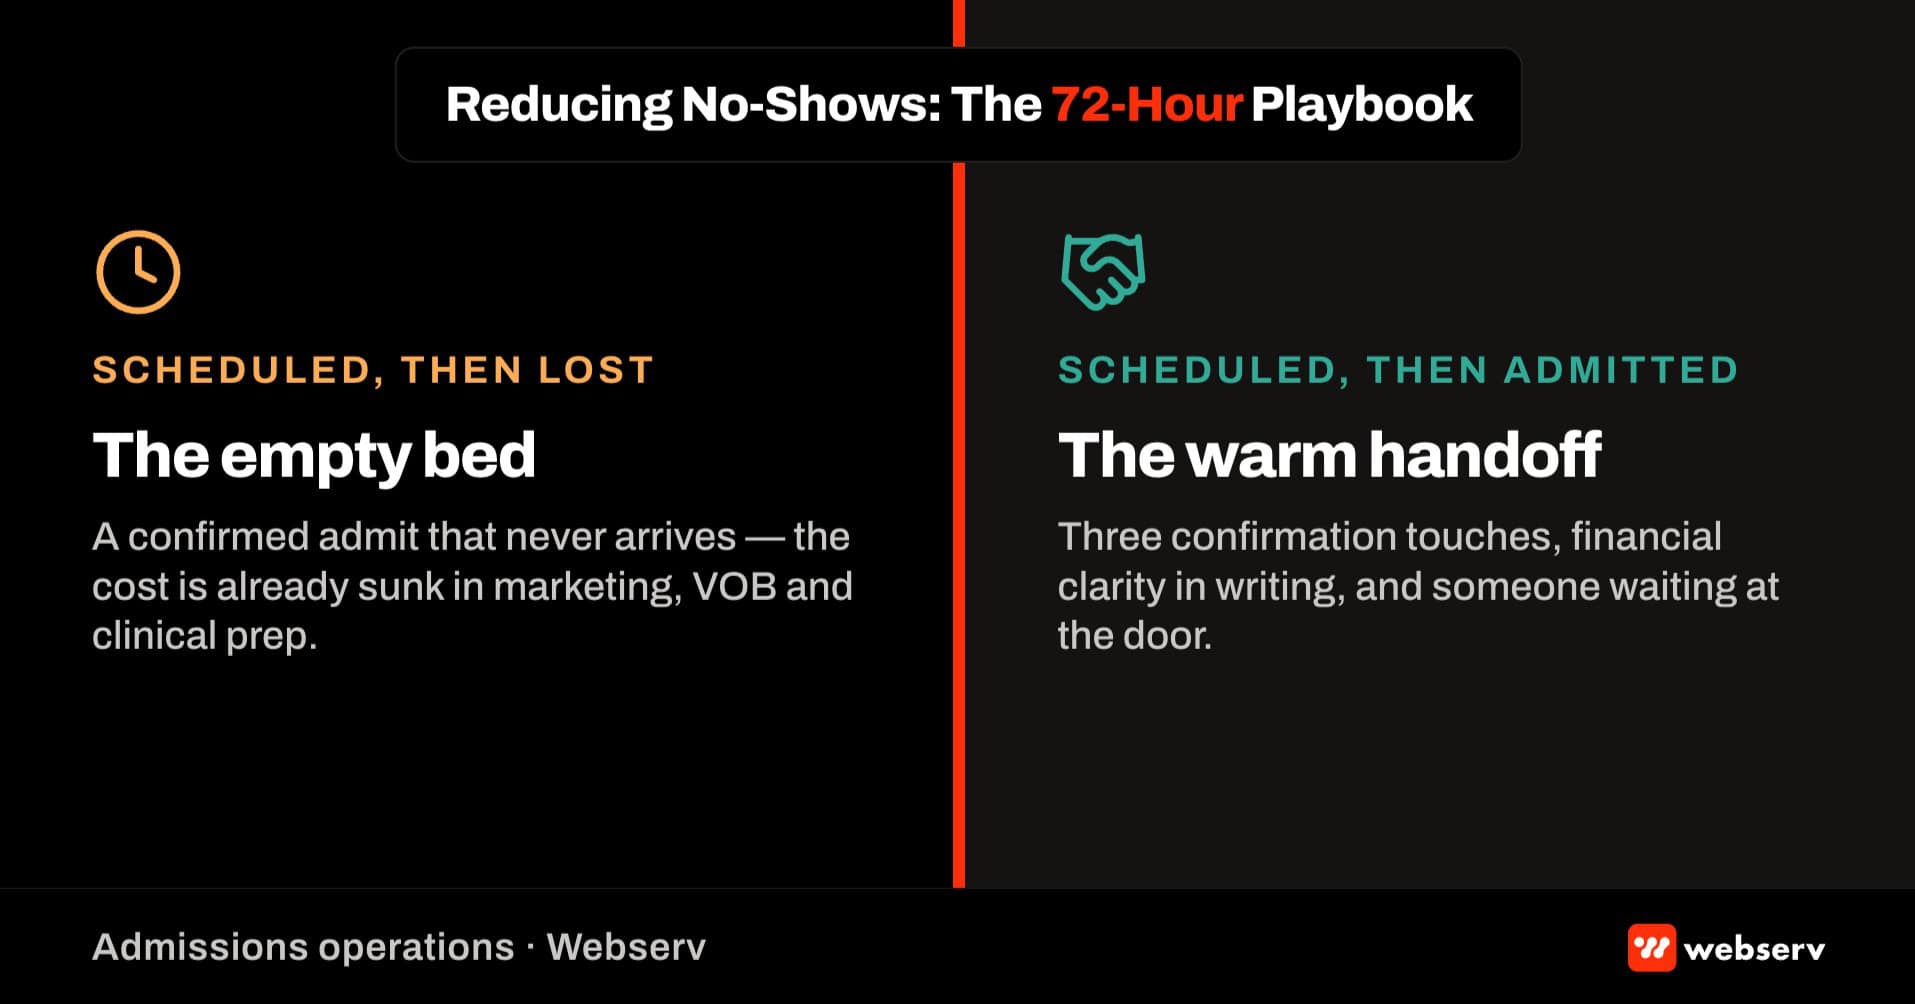
Every admissions director I have talked to has a version of the same problem. The intake team runs a clean call. Coverage verifies. The family is engaged. The patient sounds motivated. The admit gets scheduled for 48 hours out.
The patient does not show.
No-shows are the single most consistent revenue leak in the behavioral health admissions funnel that operators can actually control. Most treatment centers see no-show rates between 15 and 35 percent depending on population, level of care, and time-to-admit patterns. Facilities that run tight admissions ops discipline pull no-show rates down to 8 to 15 percent. The gap between those two ranges is real revenue that shows up in the collections report every month.
The complication is that no-shows are not a marketing problem. They are not a clinical problem in isolation. They sit at the intersection of admissions ops, clinical readiness, family dynamics, and logistics, which means fixing them requires cross-functional discipline that most treatment centers do not naturally run. This piece sits inside our broader admissions operations and billing playbook.
When ownership sees the no-show rate at the quarterly review, the reflex is usually to blame the admissions team. That is almost always the wrong diagnosis.
This piece walks the operational playbook we use to reduce no-shows at treatment centers, including the admissions ops discipline that supports it. It covers what a no-show actually is and how to measure it defensibly, the seven structural drivers of no-shows in behavioral health admissions, and the 72-hour operational playbook that closes the gap between scheduled admit and completed admit.
It also covers the population-specific patterns that shape which drivers matter most for a given facility, and the cross-functional discipline that turns a 25 percent no-show rate into a 10 percent no-show rate over 60 to 90 days.
Key Takeaways
- No-show rates at behavioral health treatment centers typically range from 15 to 35 percent, with well-run admissions operations pulling the rate down to 8 to 15 percent. The gap is worth 5 to 10 admits per month at a mid-size facility, which translates to material revenue.
- No-shows are not a marketing problem or a clinical problem in isolation. They sit at the intersection of admissions ops, clinical readiness, family dynamics, transportation, and financial clearance. Fixing them requires cross-functional discipline, not more admissions coordinator hours.
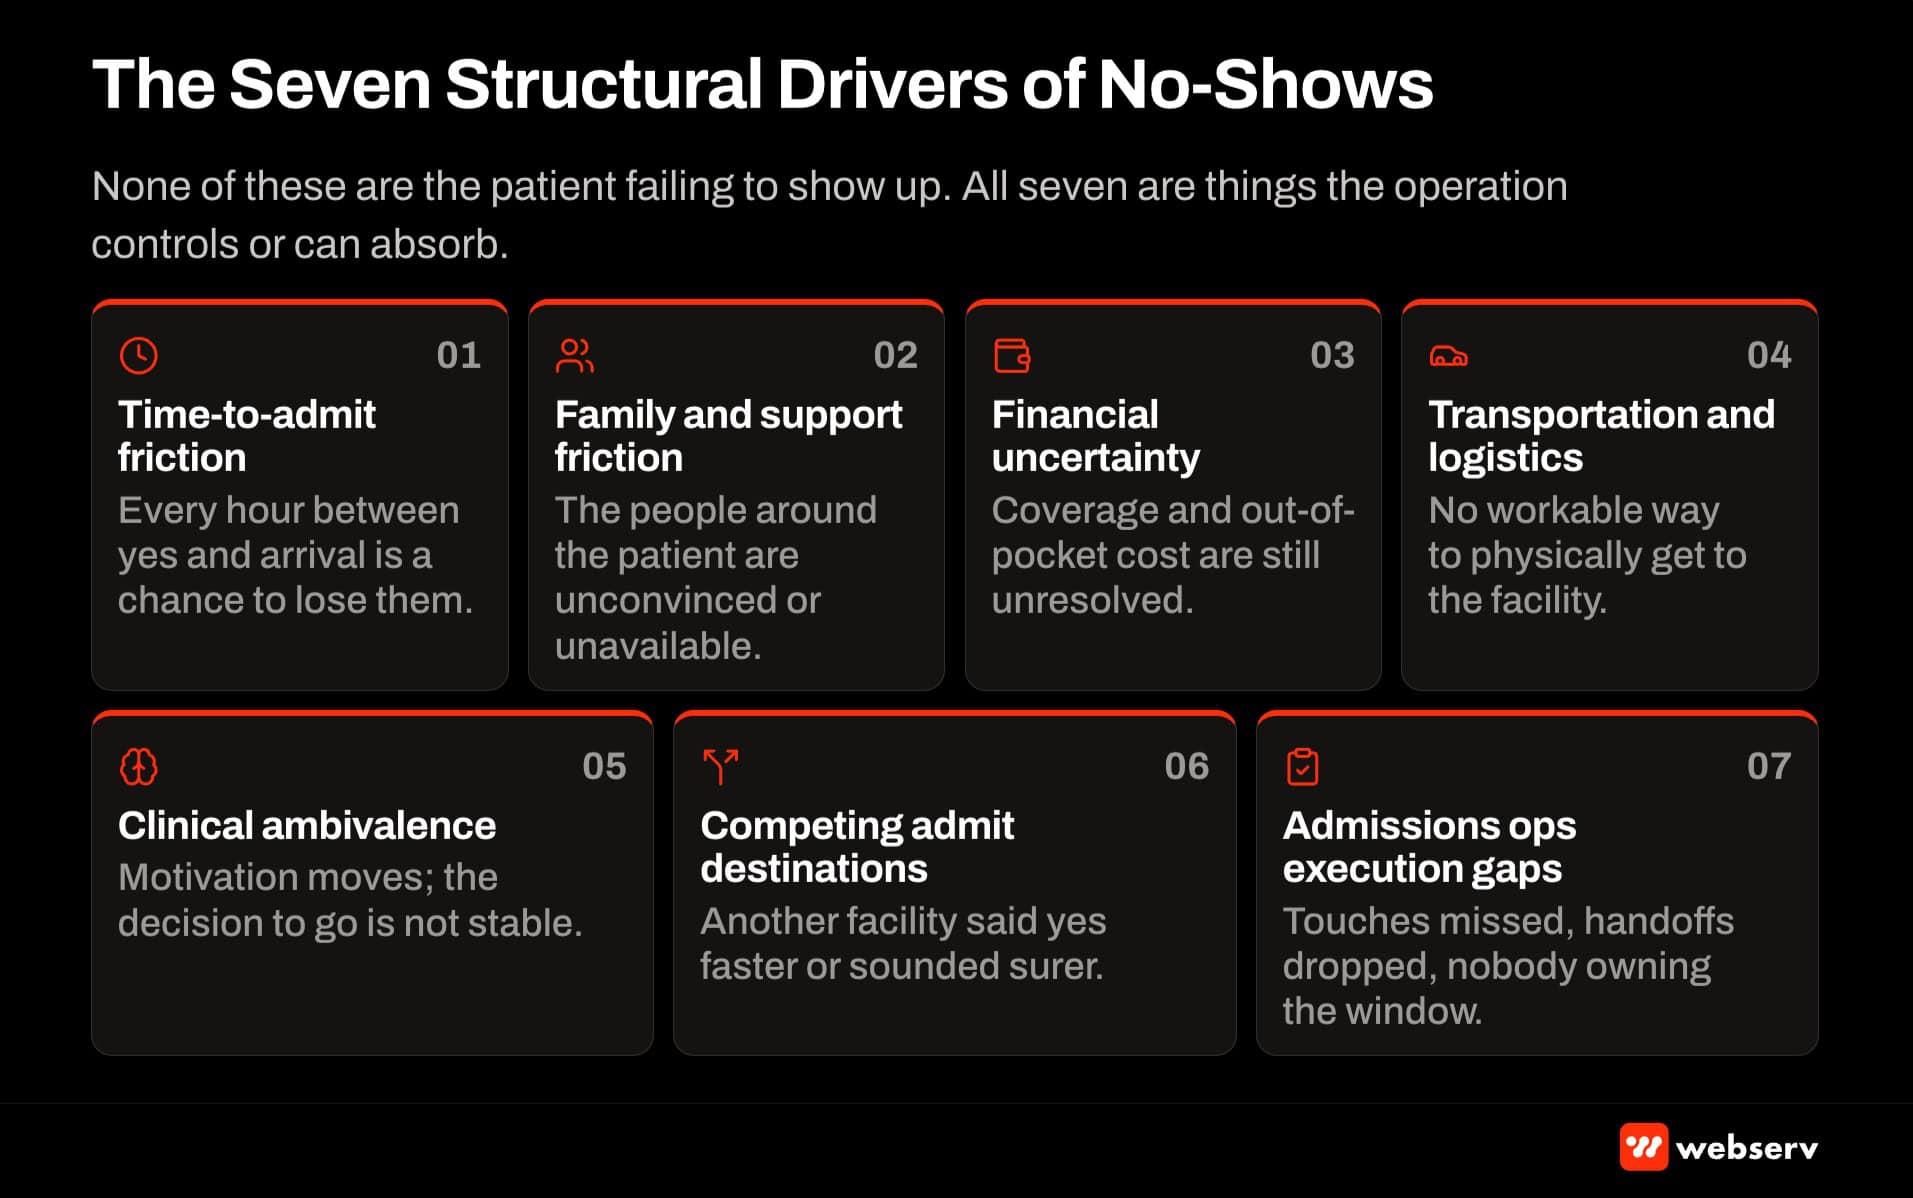
- The seven structural drivers of no-shows: time-to-admit friction, family and support-system friction, financial or coverage uncertainty, transportation and logistics friction, clinical or motivational ambivalence, competing admit destinations, and admissions ops execution gaps.
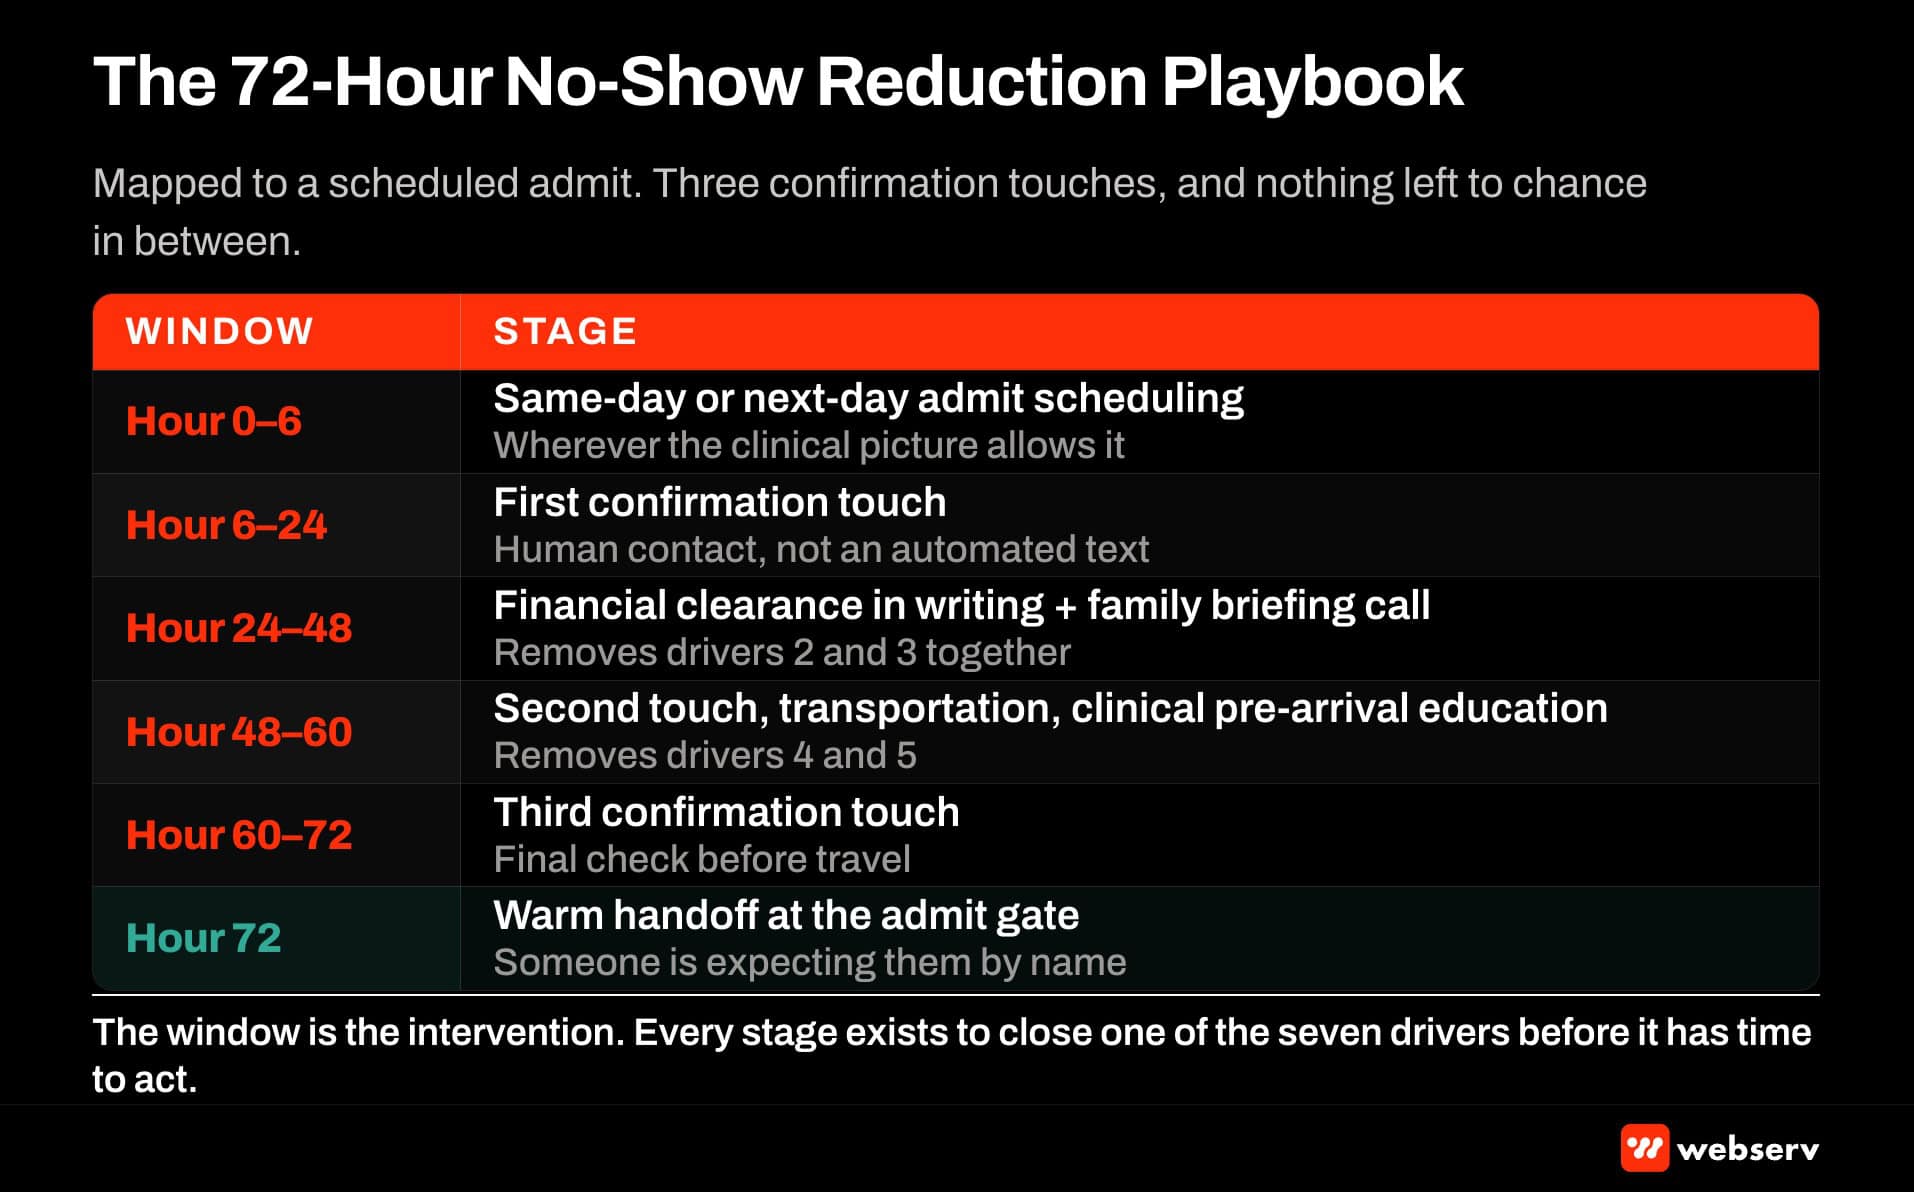
- The 72-hour playbook to reduce no-shows: same-day or next-day admit scheduling when possible, three-touch confirmation cadence, pre-admission transportation coordination, financial clearance in writing, family briefing call, clinical pre-arrival education, and warm handoff at the admit gate.
- Measurement discipline matters. Facilities without a defensible no-show measurement (definition, denominator, tracking cadence) cannot diagnose the drivers accurately, and their improvement efforts default to whatever the loudest admissions coordinator suggests.
DEFINITION
No-show (BH admissions). A scheduled admit where the patient does not arrive at the facility on the scheduled admit day and does not reschedule within 48 hours. Measured as no-shows divided by total scheduled admits over the reporting period.
Distinct from rescheduled admits (patient admitted within 48 hours — not a no-show), pre-admit cancellations (patient called back before admit day — separate diagnostic category), insurance denials that block admit at the last minute (coverage failure, not no-show), and family-blocked admits (still a no-show in the strict definition but tracked as a specific driver category).
What a No-Show Actually Is (and How to Measure It)
Before you can reduce no-shows, you have to define what one is. This sounds obvious. In practice most treatment centers have inconsistent definitions across teams.
The working definition we use: a no-show is a scheduled admit where the patient does not arrive at the facility on the scheduled admit day and does not reschedule within 48 hours. Scheduled means the intake process reached the point where a specific admit day and time was set with the patient and their support system.
The specific edge cases that need clean definitions in your CRM: rescheduled admits (patient could not make the original day but did admit within 48 hours) are not no-shows, they are scheduling-adjusted admits. Cancellations initiated before the scheduled admit day (patient calls back to say they are not admitting) are not no-shows, they are pre-admit cancellations, and they require different diagnostic and improvement work than actual no-shows.
Insurance denials that block admit at the last minute are not no-shows. They are coverage failures, and they should be tracked separately because the intervention is different. Family-blocked admits (patient wanted to admit, family intervened, patient did not arrive) are no-shows in the strict definition but represent a specific driver category that needs its own tracking.
The denominator matters. No-show rate should be measured as no-shows divided by total scheduled admits over the reporting period, not divided by total intake calls or total qualified leads. Using the wrong denominator produces a metric that looks like it is improving even when the actual admits are flat.
Reporting cadence should be monthly at the tactical layer and quarterly at the strategic layer as part of the marketing and admissions QBR review.
OPERATOR INSIGHT
When ownership sees the no-show rate at the quarterly review, the reflex is usually to blame the admissions team. That is almost always the wrong diagnosis.
No-shows sit at the intersection of admissions ops, clinical readiness, family dynamics, transportation, and financial clearance. Adding coordinator coverage without diagnosing the specific drivers moves the metric less than expected. The fix is diagnostic discipline: measure the drivers, identify the two or three that matter most for your admit population, and run the playbook components that address those specific drivers.
The Seven Structural Drivers of No-Shows
No-shows happen for seven specific structural reasons. Understanding which drivers matter most for your specific facility is the prerequisite to targeting the right interventions.
1. Time-to-admit friction
The longer the gap between the initial admissions inquiry and the scheduled admit, the higher the no-show rate. Behavioral health inquiries lose intent quickly. Patients ready to admit on Monday are often not ready to admit by Friday. Family members who agreed to a Wednesday admit have talked to their brother-in-law by Thursday and are now unsure.
Facilities scheduling admits 5 to 7 days out often see no-show rates 2 to 3x higher than facilities scheduling same-day or next-day. The single largest lever in no-show reduction is compressing time-to-admit.
2. Family and support-system friction
BH admits involve family dynamics that other healthcare admits do not. A spouse, parent, or sibling who is not aligned with the admit decision can turn a scheduled admit into a no-show through direct pressure, financial withholding, or transportation refusal.
Admissions teams that engage the family early and produce family alignment before the admit day see lower no-show rates than teams that treat the patient as the sole decision-maker.
3. Financial or coverage uncertainty
Patients and families that reach admit day unclear about their financial obligation often do not show. The uncertainty produces last-minute anxiety that the patient resolves by not going.
The specific pattern is that the VOB completed clean, but the family never received a clear written statement of what the out-of-pocket obligation looks like. The gap between clean VOB and clear family expectation is where no-shows accumulate.
4. Transportation and logistics friction
Getting the patient to the facility on admit day is a logistics problem that a meaningful percentage of admits fail on. The patient does not have a car. The family member driving cannot get time off work. The rideshare estimate came in higher than expected. The airport pickup arrangement fell through.
Facilities that pre-coordinate transportation, including offering facility-arranged transportation for out-of-area admits, see lower no-show rates than facilities that leave transportation as a patient-side responsibility.
5. Clinical or motivational ambivalence
Some patients scheduled to admit are ambivalent about treatment. The intake conversation captured the motivation window, but the motivation eroded over the intervening days.
This driver is harder to fix through admissions ops changes alone. The interventions are clinical (motivational interviewing during the pre-admit period, pre-arrival clinical touch from a therapist on the team) rather than logistical.
6. Competing admit destinations
Patients scheduled to admit at your facility sometimes admit at a competing facility instead. The reason is usually that a competing facility offered same-day admit while yours was scheduled 3-4 days out, or that a referral partner routed the patient to a different program in the interim.
This driver is a symptom of the time-to-admit friction driver, and the intervention is the same: compress time-to-admit so patients do not have the option to go elsewhere first.
7. Admissions ops execution gaps
Some no-shows are simple ops failures. The coordinator forgot to call the confirmation. The admit day time was miscommunicated to the family. The facility contact information the patient received had a typo in the address. These are the easiest driver category to fix but they require the process discipline our admissions process complete guide covers in depth.
No-show benchmarks at behavioral health treatment centers
15-35%
Typical BH no-show rate range across population and LOC
8-15%
Rate after tight admissions ops discipline is applied
60-120 days
Time to bring 25-30% no-show rate down to 10-15%
30-40%
Share of no-shows that reschedule if reached within 2 hours
The 72-Hour No-Show Reduction Playbook
The specific operational playbook we run with client treatment centers to reduce no-shows has seven components, all executed in the 72 hours between admit scheduling and admit day.
1. Same-day or next-day admit scheduling when possible
For every admit inquiry where the clinical and logistical circumstances allow, schedule the admit within 48 hours of the initial intake conversation. Compressing time-to-admit is the single highest-yield intervention.
The specific facility capabilities this requires: available bed capacity at short notice, same-day VOB completion, financial clearance on a compressed timeline, and transportation coordination inside 48 hours. Not every admit can go same-day or next-day. Detox admits often can. Residential SUD admits often can. PHP and IOP admits with lower urgency often cannot without disrupting the program’s start-cycle rhythm. Apply the compression where it works.
2. Three-touch confirmation cadence
Between admit scheduling and admit day, execute three confirmation touches with the patient and family.
Touch 1 is the immediate confirmation at scheduling: written summary of the admit day, time, location, what to bring, and next steps. Sent by email or text within 30 minutes of scheduling. Touch 2 is the mid-window confirmation: 24 to 48 hours before admit day, admissions coordinator or clinical liaison calls the patient (or the family primary contact) to confirm the plan, answer questions, and address any anxiety. Touch 3 is the day-before confirmation: 12 to 24 hours before admit day, final logistics confirmation including transportation, arrival time, and specific point of contact at the facility.
Facilities that skip touches 2 and 3 see materially higher no-show rates than facilities that execute all three.
3. Pre-admission transportation coordination
For every admit, confirm transportation before admit day. This means asking the specific question “how are you getting here on admit day” and getting a specific answer. If the answer is unclear, the admissions team coordinates the specific transportation.
For out-of-area admits (patient flying in from another state, patient driving from more than 2 hours away), facility-arranged transportation from airport or drop-off point to the facility materially reduces no-show risk.
4. Financial clearance in writing
Before admit day, the patient and family receive a written statement of the financial obligation. Not verbal. Not implied. Written and confirmed.
The statement includes the estimated out-of-pocket obligation based on the VOB, any payment plan arrangements, and any conditions that would change the estimate. The statement should be brief (one page) and easy to reference during the pre-admit period.
Financial ambiguity on admit day is a major no-show driver. Written clarity ahead of admit day closes the gap.
5. Family briefing call
At least one call during the pre-admit window with the family primary contact focused specifically on family alignment and family logistics.
The call covers what the family should expect on admit day, how visitation and family contact will work during treatment, what the family’s role is in supporting the admit, and any specific family concerns. For admits where family dynamics are visible from the intake conversation, this call is where family-driven no-shows get prevented.
6. Clinical pre-arrival education
Before admit day, the patient receives clinical program information that manages expectations for what treatment will look like.
The specific information: daily schedule outline, what phones and personal items are allowed, what visits and family contact look like in the first 30 days, and any clinical program specifics that might surprise a patient who arrives without preparation. Patients who arrive with clear expectations show up. Patients who arrive with anxiety about the unknown often do not.
7. Warm handoff at the admit gate
On admit day, a specific person at the facility is expected and prepared for the patient’s arrival. Name known. Time known. Introduction to clinical team pre-scheduled.
The alternative is the patient arriving to a general reception process where nobody is expecting them specifically. The impersonal admit gate is a small but real no-show driver at the last moment.
Population-Specific Patterns
The specific driver mix varies by patient population, which means the intervention priority varies too.
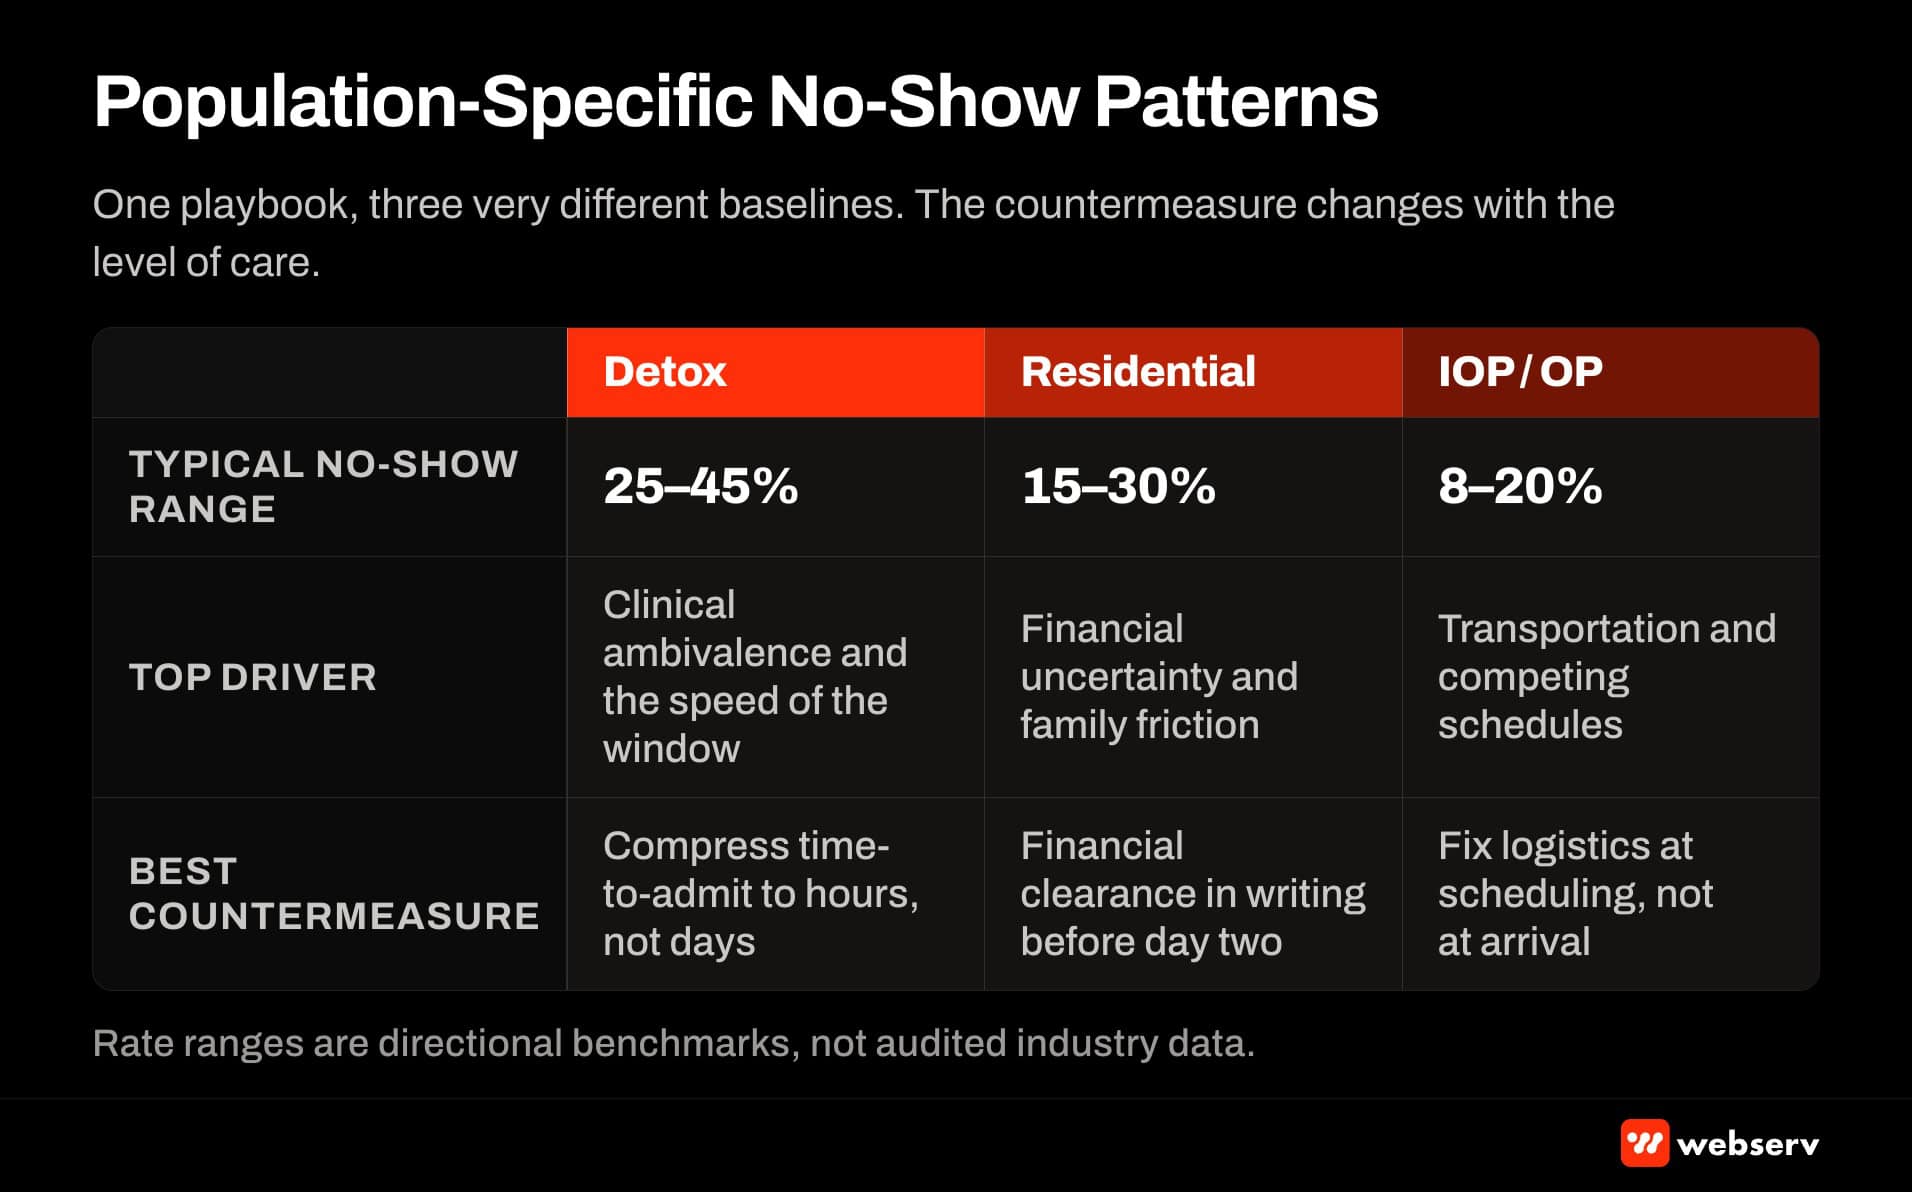
SUD admits typically have shorter motivation windows than mental health admits, so time-to-admit friction hits harder. The compression play is more valuable for SUD.
Family-initiated admits (adult child in crisis, parent as primary contact) have higher family dynamics risk than self-referred admits. The family briefing call is more important for family-initiated cases.
OON payer mix admits have higher financial uncertainty risk than in-network admits because the actual out-of-pocket obligation is harder to estimate cleanly. Written financial clearance matters more for OON.
Out-of-area admits (patient flying in from another state) have higher transportation friction risk than local admits. Facility-arranged transportation matters more for out-of-area cases.
Detox admits have higher motivational ambivalence risk because the physical withdrawal fear can override the initial decision. Clinical pre-arrival education matters more for detox.
Understanding your specific admit population is the prerequisite to prioritizing the seven playbook components correctly for your facility.
The Cross-Functional Discipline
The playbook only works if the admissions team, clinical team, and operations team run it as one coordinated process rather than three separate handoffs.
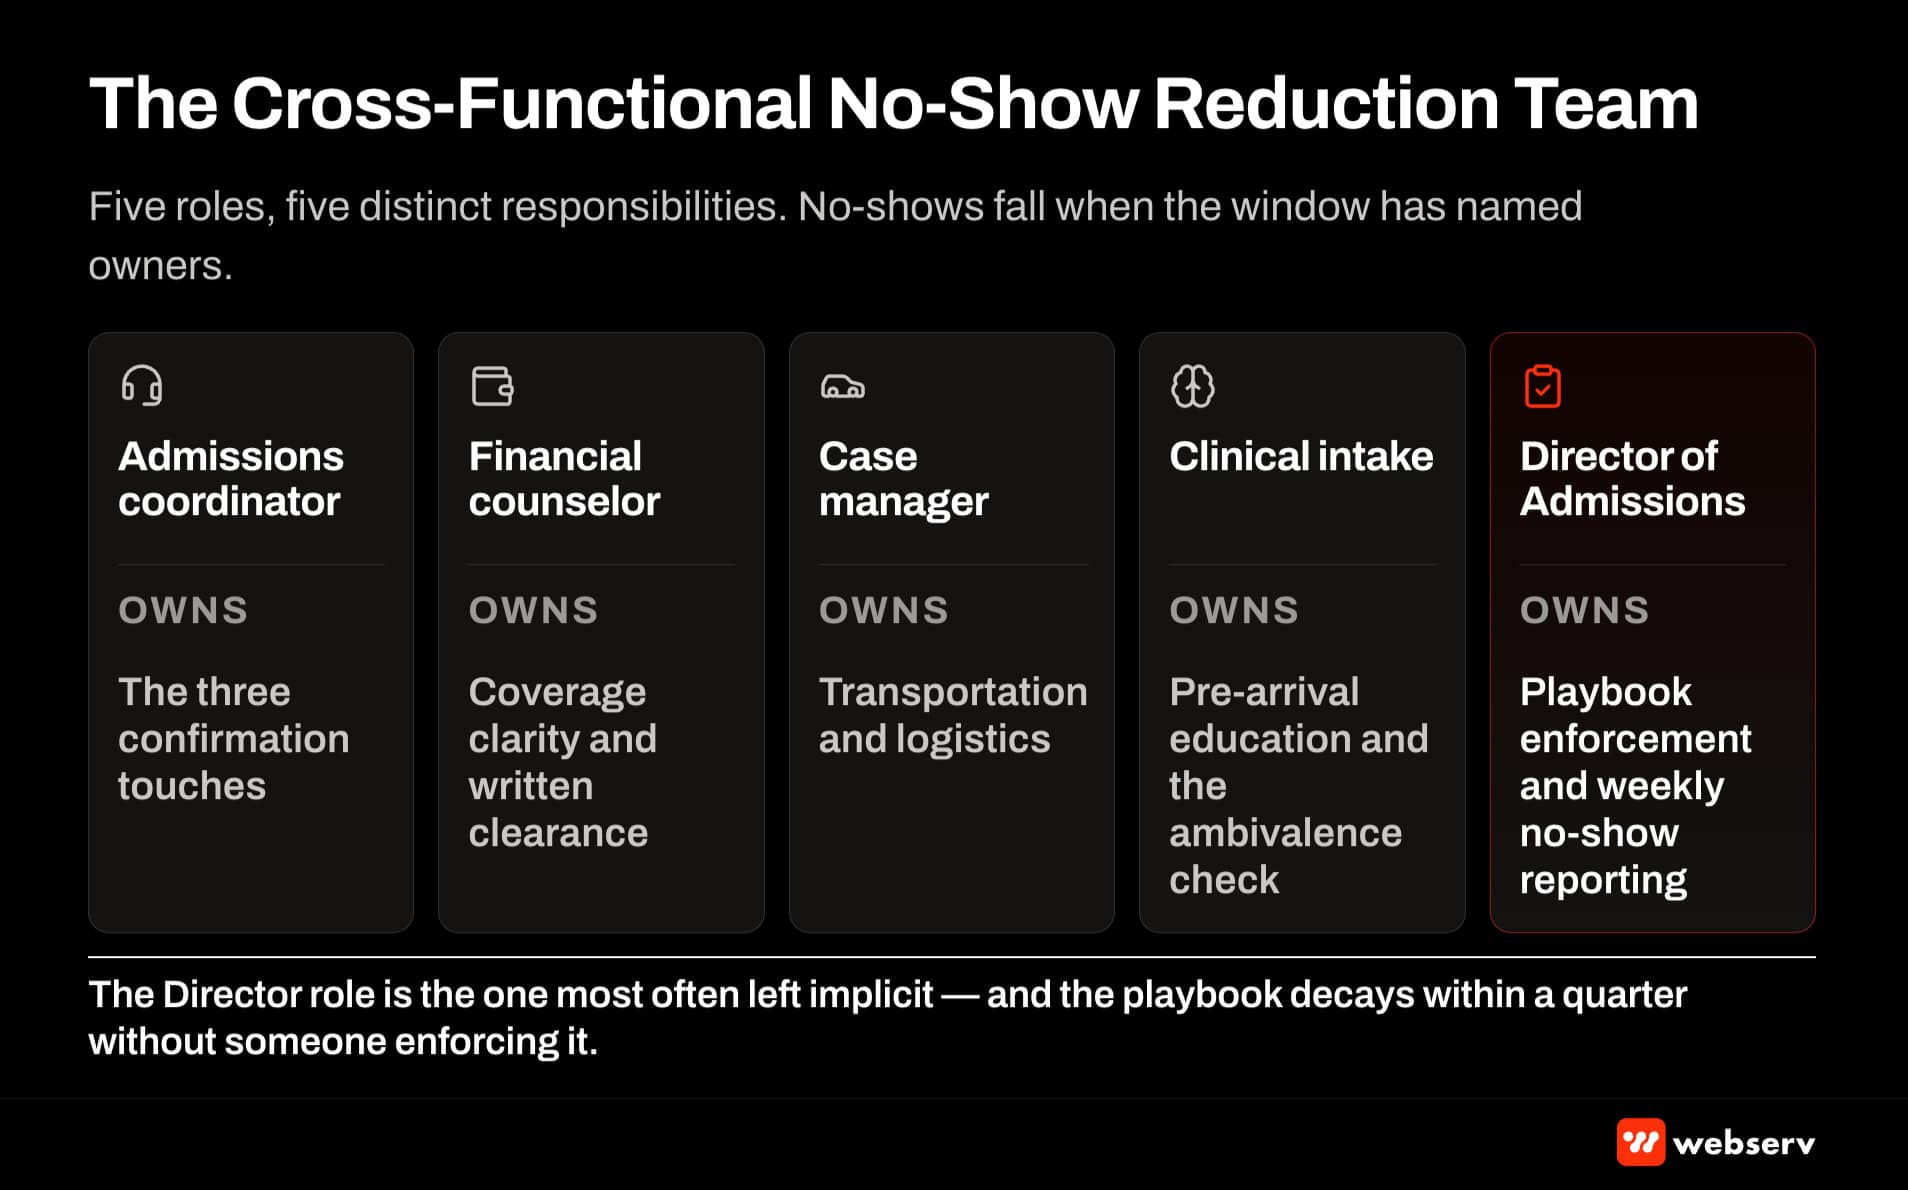
The specific cross-functional design that works: the admissions coordinator owns touches 1, 2, and 3 plus transportation coordination and financial clearance. A clinical liaison owns the family briefing call and the clinical pre-arrival education. A facility ops lead owns the warm handoff at the admit gate.
Facilities running this as three teams with no coordination see the discipline break down at the handoffs. Facilities running weekly admissions-clinical-ops standups where scheduled admits are reviewed case-by-case see the discipline hold. Our admissions team hostage dynamic piece covers the internal politics that make the cross-functional discipline harder than it looks on paper.
Common Failure Modes
Three patterns show up repeatedly at treatment centers trying to reduce no-shows.
The first is blaming the admissions team without diagnosing the drivers. When ownership sees a 30 percent no-show rate and directs the admissions director to fix it, the reflexive response is more coordinator coverage or more aggressive confirmation calls. Neither addresses the actual drivers, and the no-show rate barely moves.
The second is fixing one driver without addressing the others. Facilities that compress time-to-admit without also coordinating transportation see the no-show rate move less than expected because they solved one bottleneck while another persisted.
The third is measuring the wrong denominator. Reporting no-show rate as a percentage of intake calls rather than a percentage of scheduled admits produces a metric that looks like it is improving when the actual admits are unchanged.
The fix in all three cases is the diagnostic discipline: measure the specific drivers, identify which two or three matter most for your admit population, and run the playbook components that address those specific drivers.
DO
- Measure no-shows as scheduled-admit-based rate (no-shows / total scheduled admits), not intake-call-based.
- Distinguish no-shows from reschedules, pre-admit cancellations, coverage denials, and family-blocked admits in the CRM.
- Diagnose which of the seven structural drivers matter most for your specific admit population before intervening.
- Compress time-to-admit as the highest-yield single intervention.
- Run admissions-clinical-ops standups weekly with case-by-case review of scheduled admits.
DON’T
- Blame the admissions team as the default diagnosis when the no-show rate is high.
- Fix one driver without addressing the others (compression without transportation coordination underperforms).
- Report no-show rate as a percentage of intake calls or qualified leads (wrong denominator).
- Skip touches 2 and 3 of the three-touch confirmation cadence.
- Skip clinical assessment to accelerate time-to-admit (produces higher AMA and clinical incidents).
This connects to the broader cost-per-admit picture in lowering cost per admit and revenue cycle as a marketing problem. It’s also worth pairing with conversion rate optimization guide.
Frequently Asked Questions
What is a good no-show rate for a behavioral health treatment center?
Good depends on facility mix. As rough anchors: well-run residential SUD facilities with tight admissions ops discipline typically see no-show rates in the 8 to 15 percent range. Outpatient programs (OP, IOP, PHP) with shorter time-to-admit typically run 5 to 12 percent. Detox programs often run higher because motivation windows are shorter.
The specific target for your facility depends on your admit population, LOC mix, and current baseline. A facility currently at 30 percent should target 15-20 percent within 60 days, then 10-15 percent within 90 to 120 days. Trying to drop from 30 percent to 10 percent in a single quarter typically fails because the interventions require operational muscle memory that develops over time.
Benchmark against your own trailing 12-month baseline rather than against industry averages. Facility mix variance is too wide for cross-facility comparisons to be operationally useful.
How long does it typically take to reduce a facility’s no-show rate?
Facilities running the full playbook discipline typically see meaningful reduction (5 to 10 percentage points) within 60 days. Deeper reduction (bringing a 25-30 percent rate down to 10-15 percent) typically takes 90 to 120 days.
The reason for the ramp is that the playbook requires cross-functional coordination that develops with repetition. The first two weeks are process design. The next four weeks are execution with visible gaps. Weeks 5-12 are execution with the muscle memory that closes the driver-by-driver gap.
Facilities that skip the diagnostic discipline and try to force-fix at the coordinator layer typically see no meaningful reduction because they are addressing symptoms rather than drivers.
Does compressing time-to-admit hurt clinical assessment quality?
Not if the compression is designed correctly. The clinical assessment work that happens between intake conversation and admit does not disappear in a same-day or next-day admit; it moves to the pre-admit and post-admit hours.
The specific compression that works: the admissions team completes the coverage verification and financial clearance work inside 24 hours, the clinical team schedules the initial assessment for admit day rather than pre-admit day, and any additional clinical review that would have happened in the pre-admit window happens in the first 24 hours post-admit.
The compression that does not work is skipping clinical assessment entirely. Facilities that admit patients without adequate clinical review to accelerate the process see higher clinical incidents in the first week of treatment and higher AMA (against medical advice) rates.
How do we handle no-shows when they happen?
The specific workflow for a no-show: attempt to reach the patient by phone and text within 2 hours of the missed admit time. If contact is made, offer immediate reschedule with the shortest possible new admit day. If no contact is made, follow up daily for 3 days, then weekly for 3 weeks.
Roughly 30 to 40 percent of no-shows will reschedule if reached quickly. The other 60 to 70 percent will not, but the follow-up produces the diagnostic information (why they did not show) that feeds back into the driver analysis.
Do not treat every no-show as a lost admit. A meaningful portion are recoverable if the admissions team runs the follow-up discipline.
How does insurance verification affect no-shows?
Verification quality affects no-shows through the financial clarity driver. Patients and families that reach admit day without a clear understanding of their out-of-pocket obligation often do not show.
The specific pattern: VOB completes on Monday, admit scheduled for Wednesday, no written financial statement gets to the family in between, family arrives at Wednesday morning uncertain what treatment will cost, patient does not show up.
The fix is a written financial statement delivered to the family within 24 hours of the completed VOB, before admit day. The statement does not need to be exhaustive; it needs to be clear about the estimated obligation and the payment mechanics.
Are no-shows measured differently for detox versus residential versus outpatient?
The measurement definition is the same across LOCs. The realistic target rates differ.
Detox admits often have higher no-show rates than residential because the motivation window is shorter and the physical withdrawal fear can override the initial decision. A well-run detox program still targets 10-15 percent no-show rate but may run somewhat higher during ramp. Outpatient programs (PHP, IOP, OP) typically have lower no-show rates than residential or detox because the commitment threshold is lower and the time-to-admit is often shorter. Well-run outpatient programs target 5-10 percent no-show rate for initial admits.
Benchmark against your specific LOC baseline rather than mixing LOC data in aggregate reporting. The driver mix is different enough that aggregated numbers obscure the improvement opportunities.
Jim Malcom is Director of Admission Ops at Webserv, a behavioral health marketing agency and admissions operations platform working with residential, outpatient, and telehealth treatment providers. He leads the admissions floor and works directly with treatment center operators on admissions ops discipline, no-show reduction playbooks, and cross-functional coordination between admissions, clinical, and operations teams.