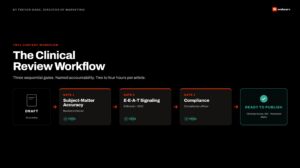
Most treatment center CRMs I audit track two things well: how many leads came in the top, and how many admits landed at the bottom. Everything in the middle is a black box.
The middle is the whole game. If you cannot see what happens between an inbound lead and an admitted patient, you cannot fix a broken funnel. That is the diagnostic layer we build across every engagement inside our admission operations program at Webserv.
You cannot identify which admissions coordinator is closing at 15 percent while the team average is 35. You cannot tell a working paid campaign from a broken one. You cannot make a real decision about where to add budget or where to cut.
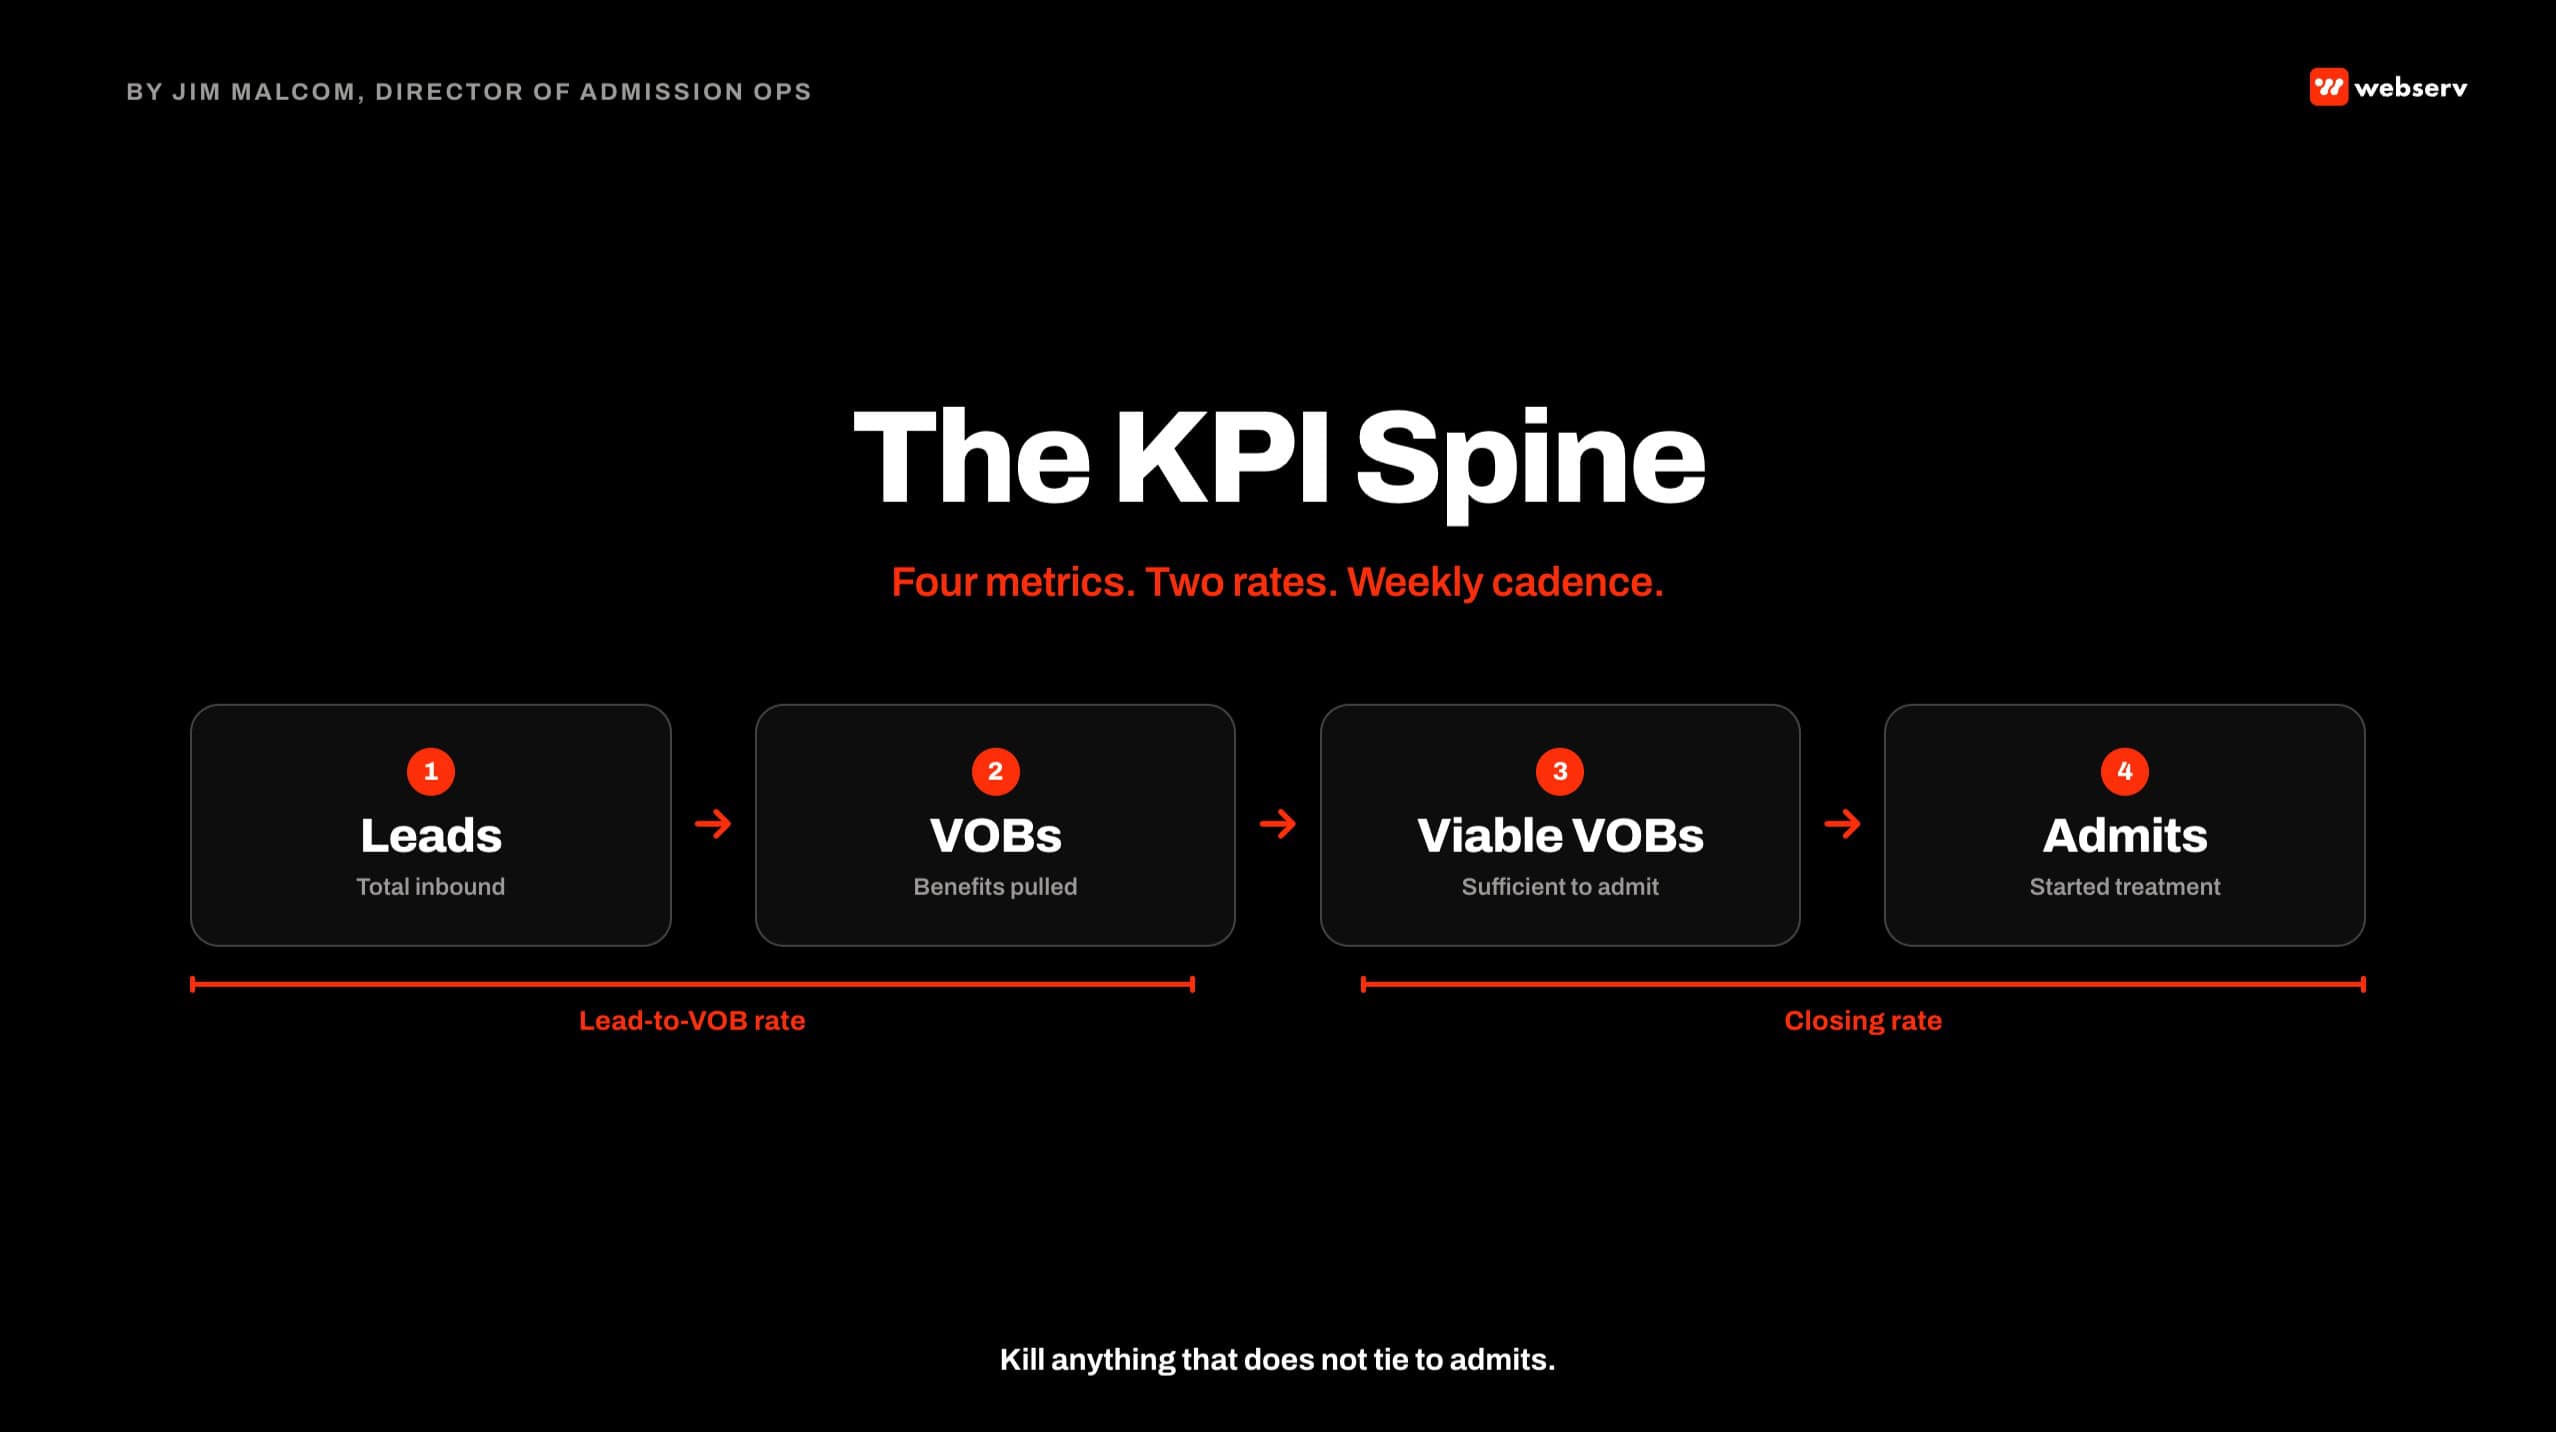
This article is the KPI spine I deploy at every treatment center admissions operations engagement. Four metrics, two rates, four segmentation dimensions. Tracked week over week. Reported to the operator in a format that makes decisions obvious.
Key Takeaways
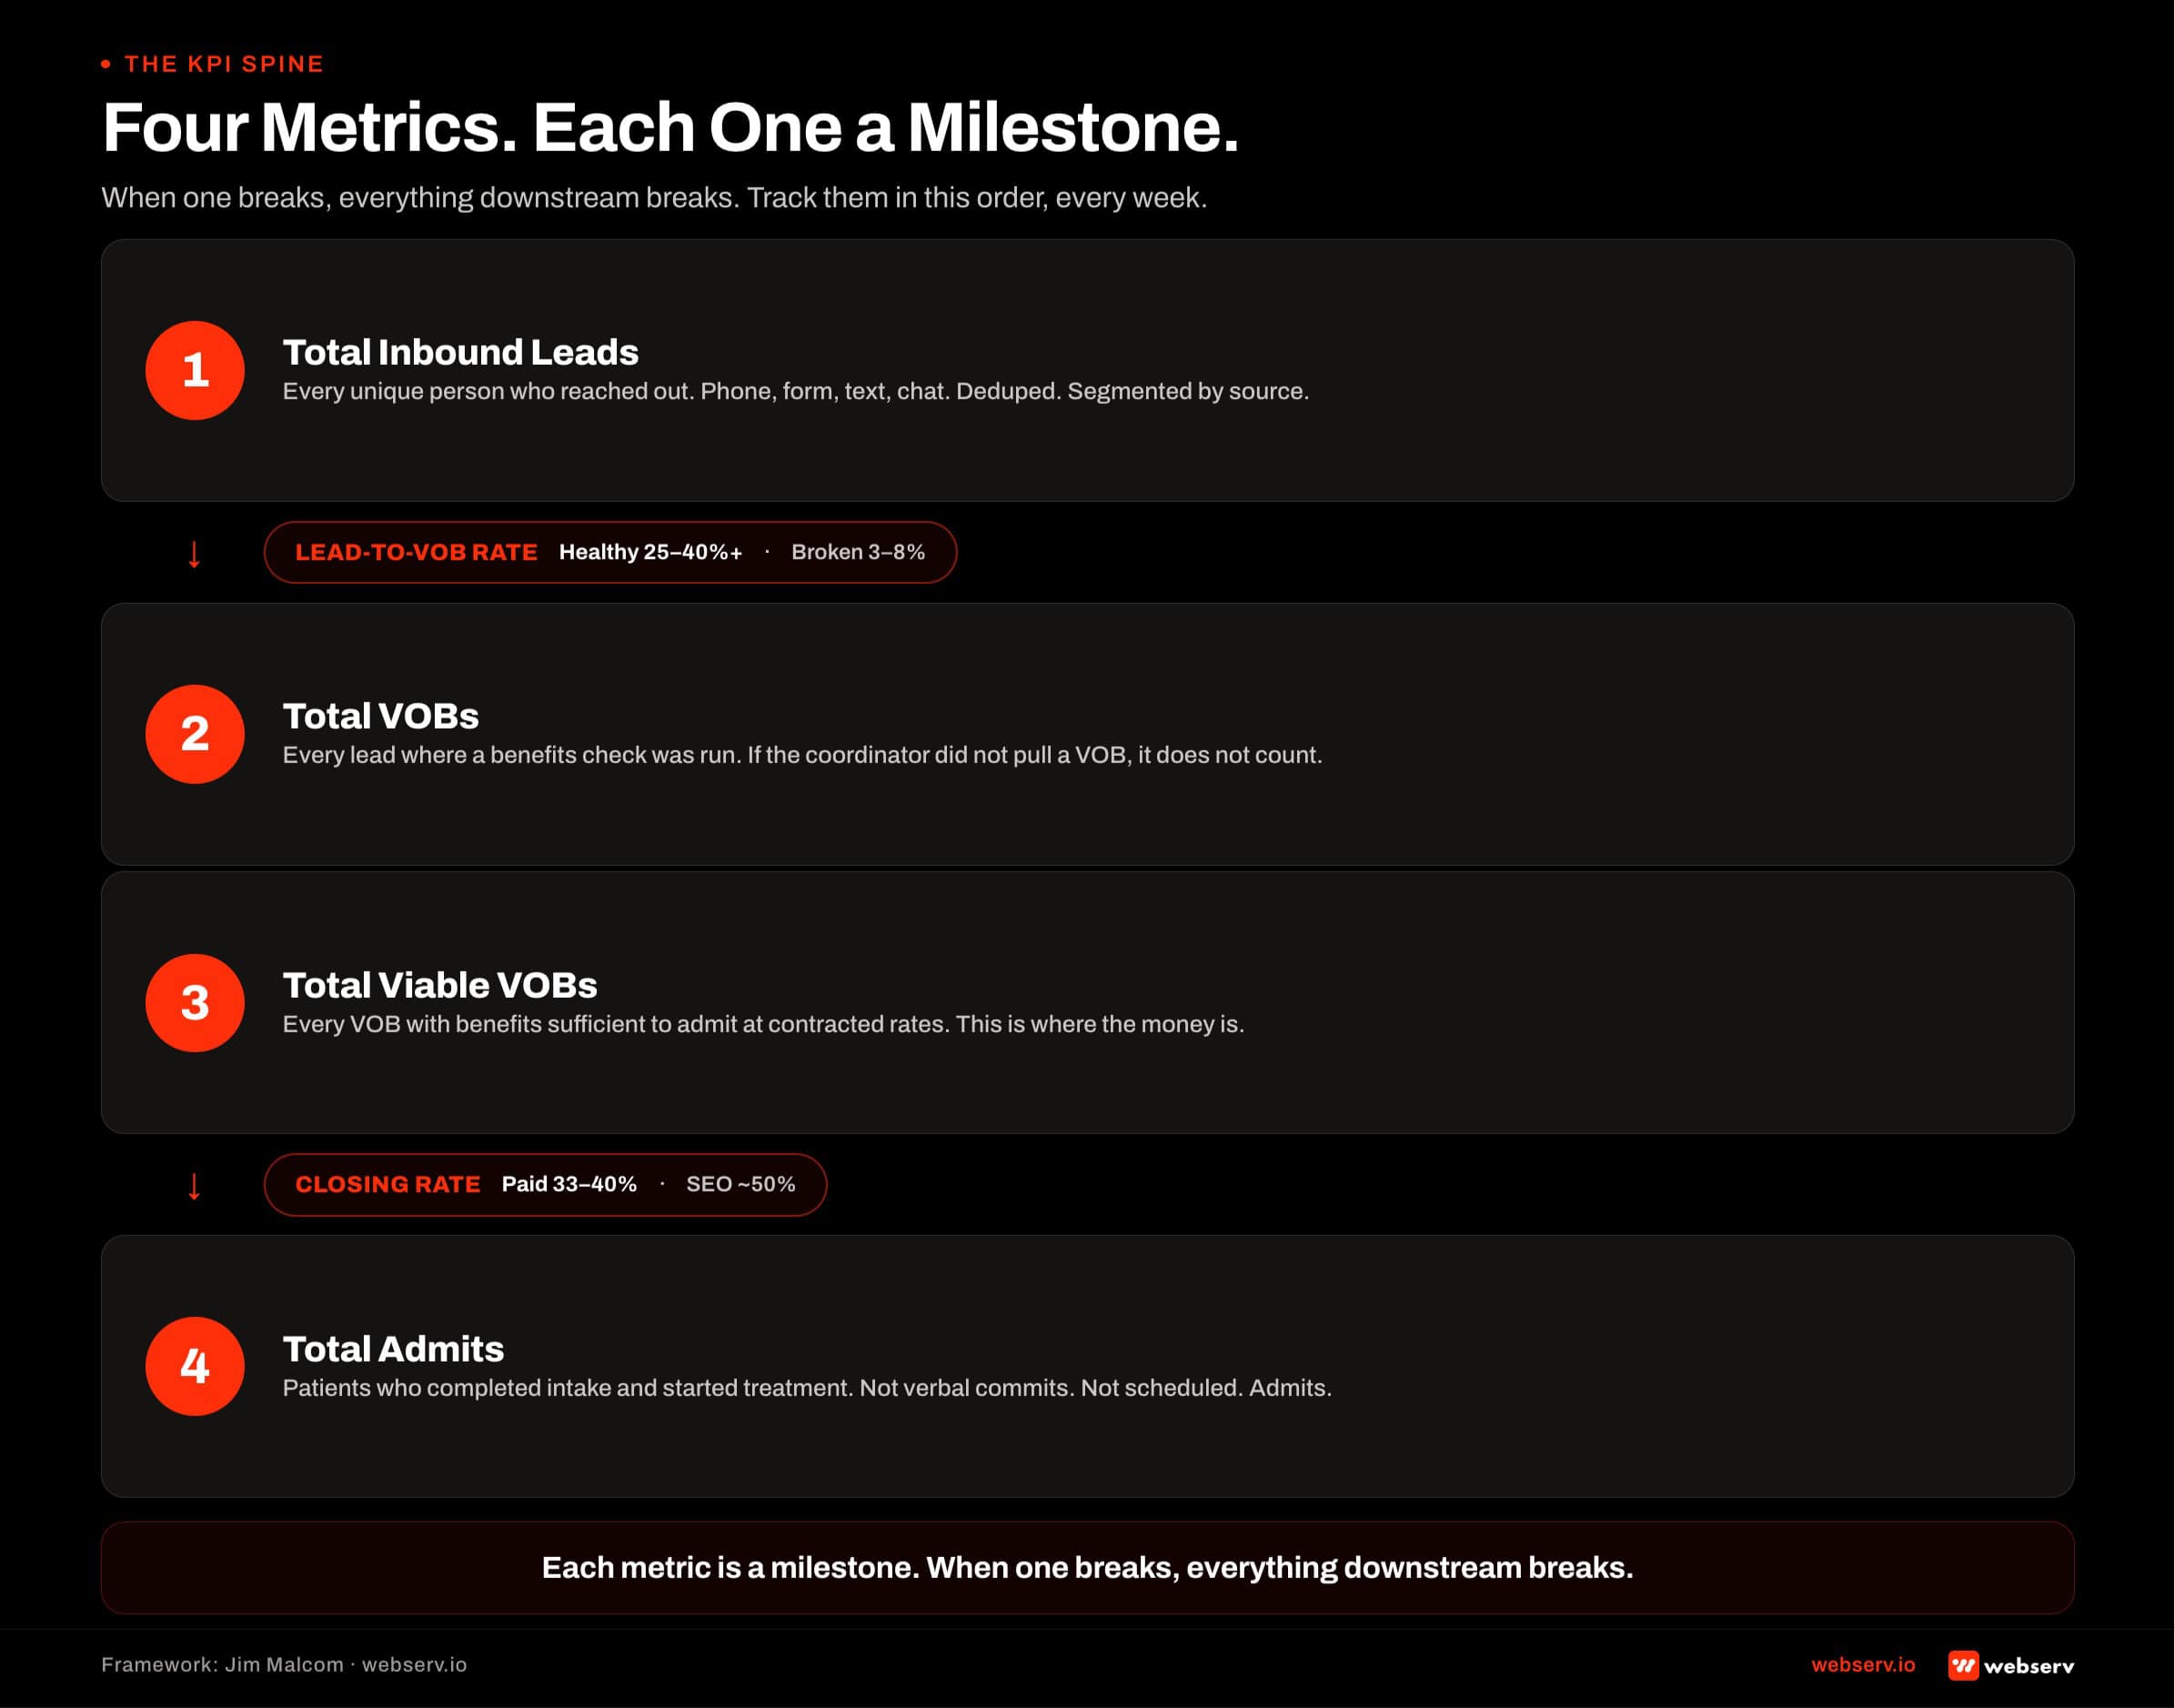
- Every treatment center admissions CRM needs to track four core metrics: total inbound leads, total VOBs, total viable VOBs, and total admits. These four sit on a straight line. When one breaks, the ones downstream break.
- On top of the four metrics, you need two rates: lead-to-VOB conversion rate and closing rate (viable-to-admit). Rates are how you actually diagnose a broken funnel.
- Every metric needs four segmentation dimensions: by lead source, by campaign source, by admissions agent, and by lead type. Aggregate numbers hide problems. Segmented numbers reveal them.
- The cadence is weekly. Monthly reporting is too slow at the volume most treatment centers operate. If a coordinator is closing at 12 percent for four straight weeks, you need to know that in week five, not month six.
- Every treatment center CRM I have audited has vanity metrics that make the dashboard look busy without producing decisions. Form fill counts without downstream conversion. Average time on site. Total impressions. Kill anything that does not tie to admits.
- The reconciliation test is the standard: the number of admits in your CRM should match the number of admits in your billing system within 5 percent. If the gap is larger, the CRM is not being trusted as the source of truth, and half your reporting is wrong.
The KPI Spine
DEFINITION
The KPI Spine
Four sequential metrics measured weekly for every treatment center admissions operation: total inbound leads, total VOBs, total viable VOBs, total admits. Each metric is a milestone in the funnel. Rates between the metrics (lead-to-VOB, VOB-to-viable, viable-to-admit) are the diagnostics. Everything else in an admissions dashboard is either a segmentation of the spine or noise.
The four core metrics are not negotiable. Every treatment center CRM has to have all four, tracked cleanly, or the operator cannot see what is happening in their own funnel.
Total inbound unique leads. Every unique person who reached out. Phone calls plus form fills plus text messages plus chat. Deduped so the same person calling three times counts as one lead. Segmented by source (paid search, paid social, organic, referral, direct).
Total VOBs. Every lead where a benefits check got run. If the coordinator did not pull a VOB, the lead does not count as a VOB.
This is where most treatment centers first lose track of their funnel, because coordinators forget to log the VOB attempt or the CRM does not have a clean VOB status field.
Total viable VOBs. Every VOB that came back with benefits sufficient to admit the patient at the contracted rate. Viable VOB is where the money is. A high VOB count with a low viable rate means your targeting is producing benefits-poor prospects.
Total admits. Every patient who actually completed intake and started treatment. Not verbal commitments, not scheduled admissions that fell through, not intent to admit. Admits.
Admits should be pushed back to your paid-media platform as an offline conversion so the bidding algorithms learn what an actual admit looks like at your facility. Google Ads has extensive documentation on how to import offline conversions and how those uploaded admits feed the bidding algorithms downstream. This is where the CRM’s role in attribution matters most: it is the source of truth that trains every downstream bidding decision.
The four metrics sit on a straight line. Leads become VOBs. VOBs become viable VOBs. Viable VOBs become admits. When one metric breaks, the ones downstream all break. When you see a drop in admits, you have to trace back through the line to figure out where the break started.
The Two Rates That Matter
Aggregate volume tells you what is happening. Rates tell you why.
The two rates I hold every admissions team to:
Lead-to-VOB rate. Percentage of inbound unique leads where a VOB was pulled. Healthy call-center accounts run above 25 percent, often above 40 percent.
Broken teams run 3 to 8 percent on the same marketing campaigns. This is the fastest diagnostic on whether your admissions team is qualifying calls or hanging up.
Closing rate (viable-to-admit). Percentage of viable VOBs that converted to admitted patients. This is where the admissions coordinator’s skill is most visible.
25-40%+
healthy lead-to-VOB rate on call-center accounts
33-40%
target closing rate on paid media viables
~50%
target closing rate on SEO viables
The closing rate benchmark ladder above is what I hold every team to. A team closing viables at 10 to 15 percent is pitching in the first five minutes and skipping the assessment.
A team running the full protocol lands between 33 and 40 percent on paid media leads, and closer to 50 percent on SEO leads because those prospects arrived more qualified.
The Segmentation That Makes Metrics Useful
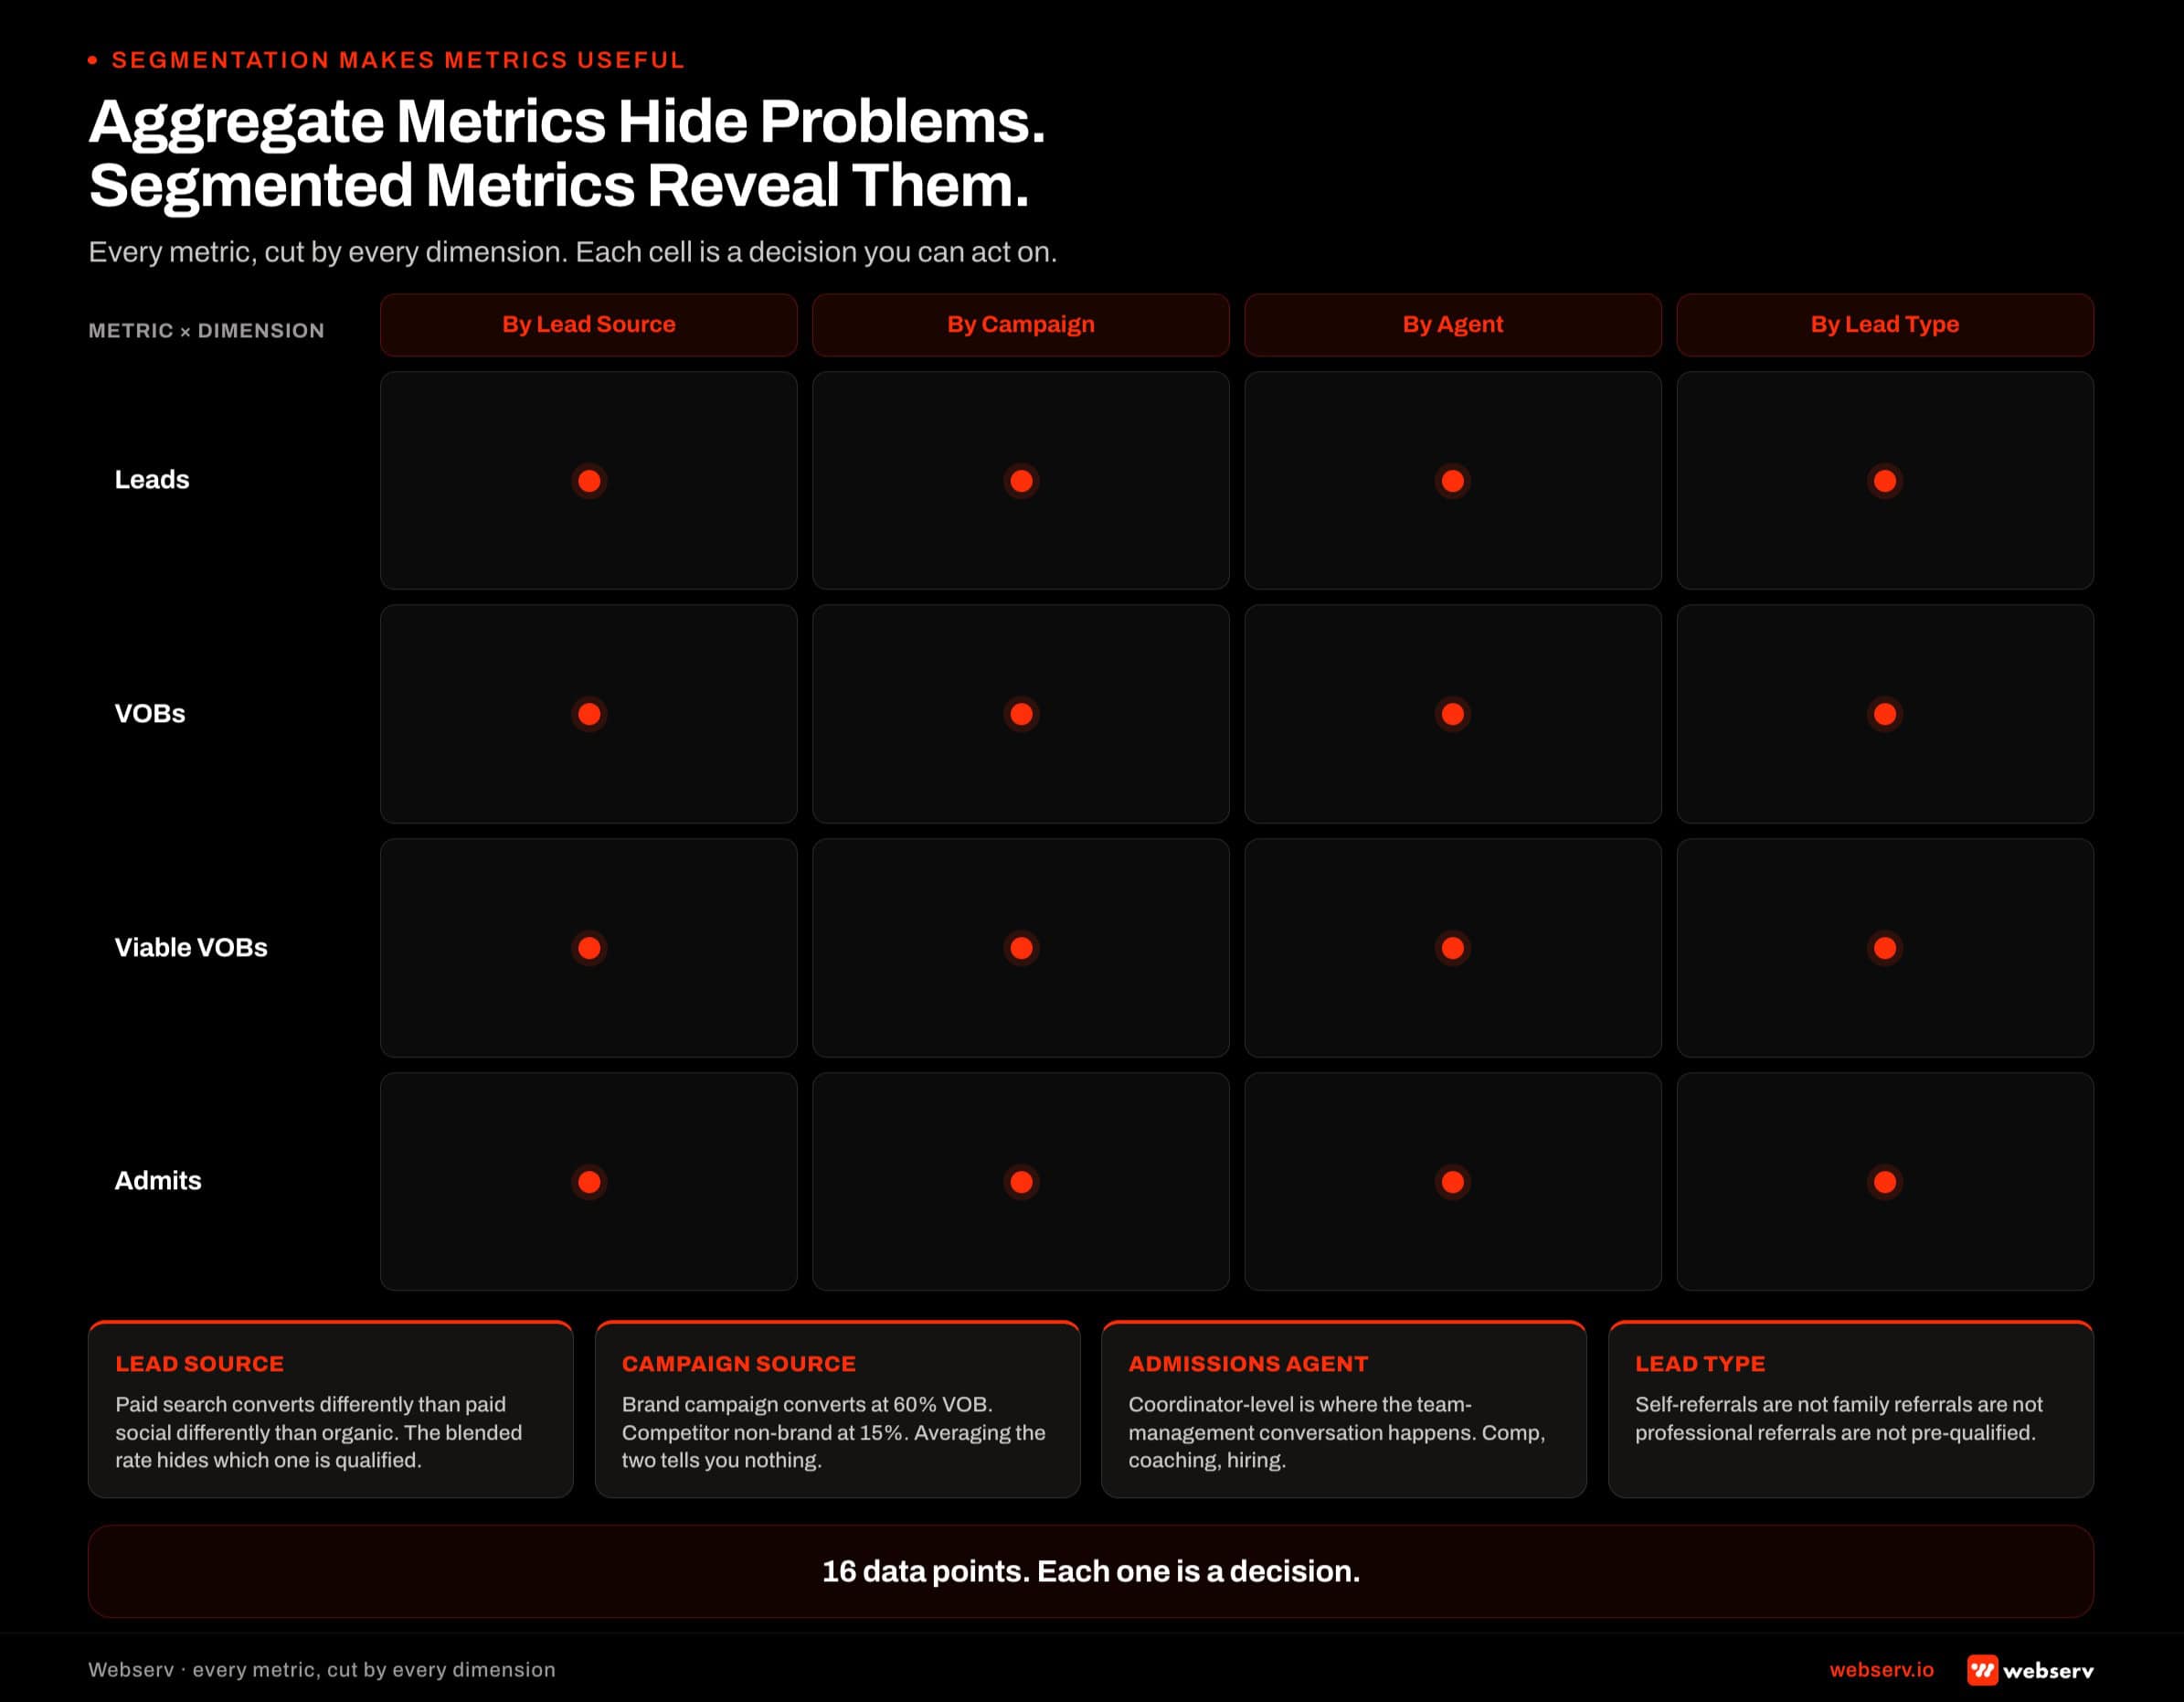
Aggregate metrics hide problems. A team-wide closing rate of 32 percent looks healthy. Break it out by coordinator and you might find one coordinator at 48 percent and another at 14 percent, dragging the average.
DEFINITION
Segmentation Dimensions
The four axes every core admissions metric needs to be broken out by: lead source (paid search, paid social, organic, referral, direct), campaign source (specific paid campaign or content piece), admissions agent (individual coordinator), and lead type (self-referral, family, professional referral, insurance-verified pre-qualified). Aggregate numbers without these dimensions produce averages that hide the coordinator, channel, or campaign actually driving performance.
Every core metric needs the four segmentation dimensions applied. This produces a lot of rows on the dashboard, but each row is actionable.
- Segment by Lead Source. Paid search leads convert differently than paid social leads, which convert differently than organic leads. If your dashboard shows a single blended lead-to-VOB rate, you cannot see which source is producing qualified leads and which is producing noise.
- Segment by Campaign Source. Inside paid search, different campaigns produce different lead quality. A brand campaign will convert at 60 percent lead-to-VOB. A non-brand competitor campaign will convert at 15 percent. Averaging them together gives you no information.
- Segment by Admissions Agent. Coordinator-level segmentation is where you identify your top performers and your underperformers. This is where the team-management conversation actually happens. Coordinator-level segmentation drives compensation, coaching, and hiring decisions.
- Segment by Lead Type. Self-referrals convert differently than family-referrals, which convert differently than professional referrals. Insurance-pre-qualified leads convert differently than raw form fills. Track lead type as a separate field so you can measure each channel of prospect against its own baseline.
Four segmentation dimensions across four core metrics and two rates produces a dashboard with a lot of rows. That is intentional. Each row is a decision.
What NOT to Track
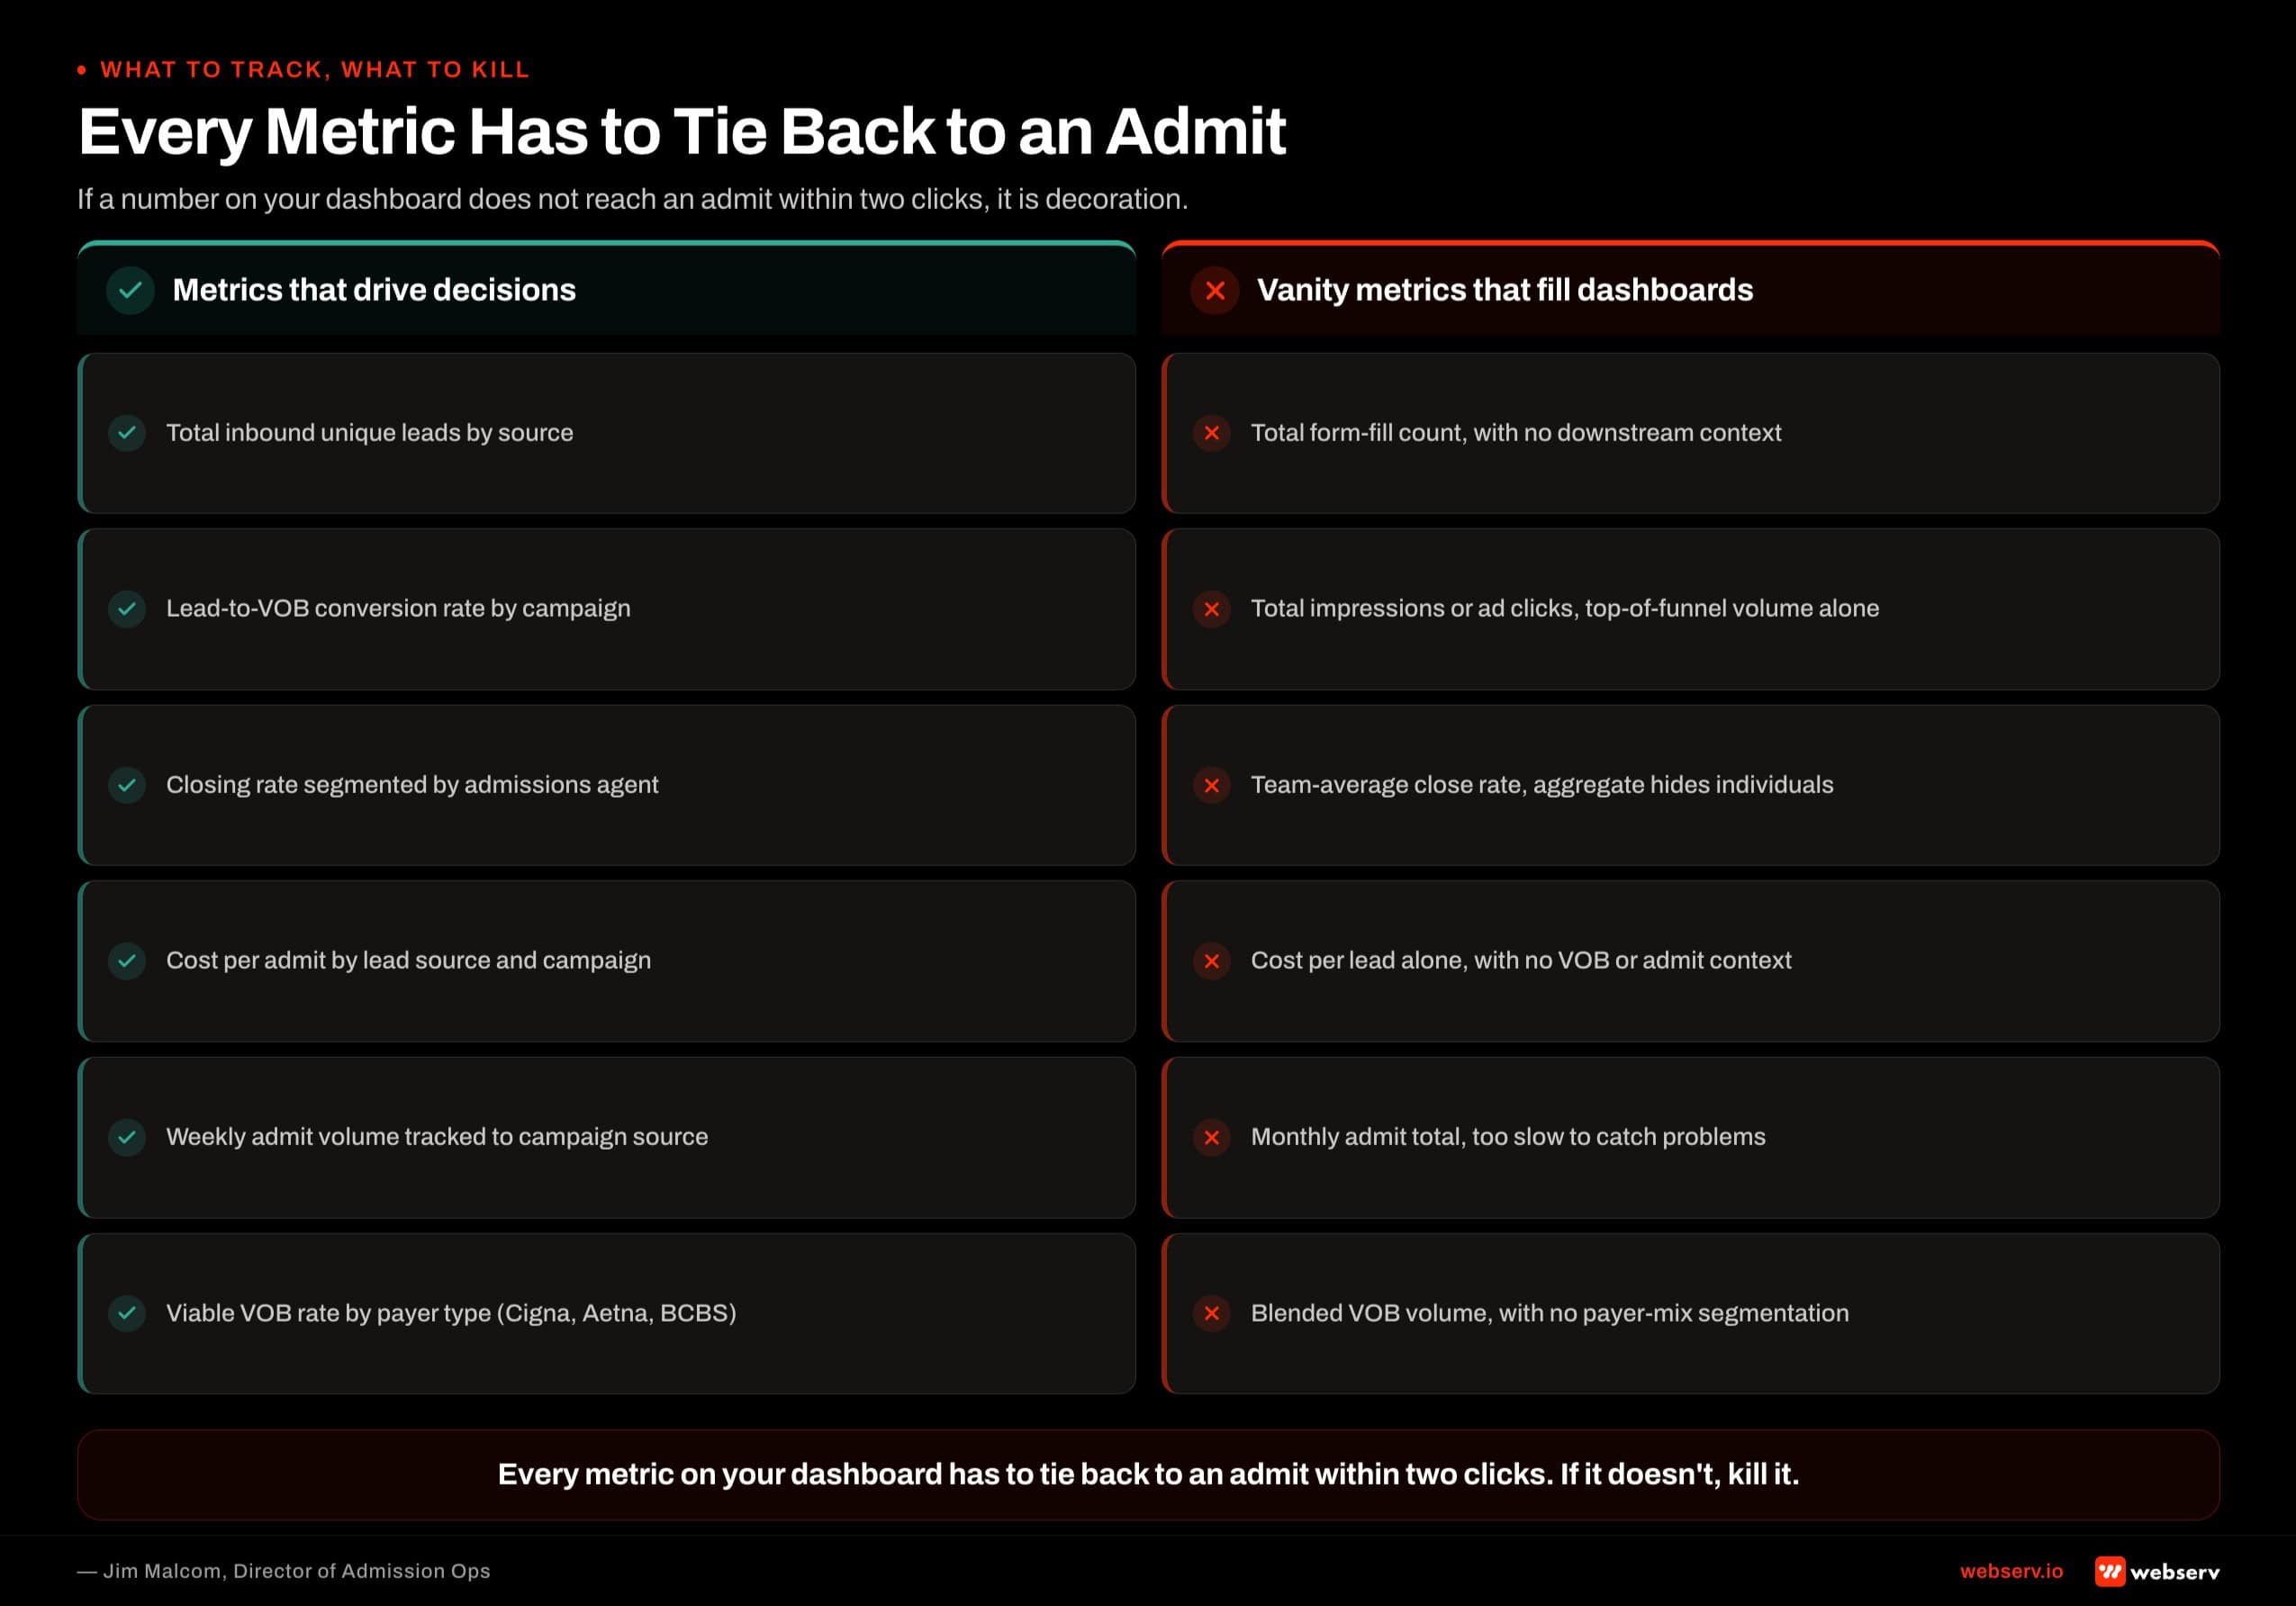
METRICS THAT DRIVE ADMISSIONS DECISIONS
- Total inbound unique leads by source
- Lead-to-VOB conversion rate by campaign
- Closing rate segmented by admissions agent
- Cost per admit by lead source and campaign
- Viable VOB rate by payer type (Cigna, Aetna, BCBS, etc.)
VANITY METRICS THAT FILL DASHBOARDS WITHOUT PRODUCING DECISIONS
- Total form fill count (without downstream conversion context)
- Total impressions or ad clicks (top-of-funnel volume in isolation)
- Team-average close rate (aggregate hides individual performance)
- Cost per lead alone (without VOB or admit context)
- Blended VOB volume (without payer-mix segmentation)
Every treatment center CRM I audit has vanity metrics. Numbers that look impressive but do not tie to admits. They fill dashboard real estate without producing decisions.
The vanity metrics are not always wrong. They are wrong when they replace the decision-driving metrics on the dashboard.
Cost per lead alone is not useless. It becomes useless when the operator reads it and does not have cost per admit in the next column to give it context.
The rule I use with treatment center operators: every metric on the dashboard has to tie back to an admit within two clicks. If it does not, kill it.
HubSpot has a useful feature where you can see how often a field is used across the CRM. If a field is used less than 5 percent of the time, delete it. Less is more. Keep it clean. Keep it lean.
The Reconciliation Test
THE NUMBER OF ADMITS IN YOUR CRM SHOULD MATCH THE NUMBER OF ADMITS IN YOUR BILLING SYSTEM WITHIN 5 PERCENT
If the gap is larger, one of the two systems is wrong, and half your reporting is built on an inaccurate foundation. Weekly reconciliation is the standard. Someone in your organization owns the reconciliation and runs it every week. Without that person, the gap compounds over months and eventually becomes a 20-admit-vs-15-admit conversation that nobody can explain.
I have caught this gap live on client calls more times than I can count. The CRM says 20 admits for the month. The billing system says 15.
Somebody has to answer where the five missing admits are, or where the five extra CRM records are, or where the data broke between the two systems.
The answer is always in one of three places: a coordinator forgot to update the CRM record when the admit fell through, an admit was logged in billing without a corresponding source record in the CRM, or a data-sync integration silently broke and nobody noticed.
Each of the three answers has an operational fix. But finding the answer requires the reconciliation to be running weekly, not quarterly. And requires someone to own it.
This is one of the pieces in the attribution arc that we treat as a required foundation for accurate reporting. The related deeper dive on the reconciliation process is a separate article in this cluster; the metrics side is what belongs on your dashboard.
What Most CRMs Do Not Track Out of the Box
DO NOT RELY ON CRM DEFAULTS
Every CRM vendor ships with a default field configuration designed for generic sales, not for behavioral health admissions. VOB status, viable VOB flag, admit attribution to campaign source, and lead-type taxonomy usually have to be built as custom fields. If you skip the custom configuration and rely on defaults, half your reporting will be wrong within 30 days of go-live. Configure the CRM against the KPI spine, not against the vendor’s template.
The gap between what a CRM ships with and what a treatment center needs is bigger than most operators expect. Dazos ships closer to the mark than most because it is built for behavioral health specifically.
Salesforce ships with a generic sales-cycle configuration that has to be substantially rebuilt. HubSpot lands somewhere in the middle.
Regardless of platform, the configuration work needs to happen at the front of the engagement. The KPI spine has to be present in the CRM as configurable fields. The segmentation dimensions have to be present as segmentation-capable fields.
The reconciliation with billing has to have a documented process. Without these pieces, the CRM is a filing cabinet, not a reporting engine.
The clinical framework for measurement in behavioral health has federal-level backing. SAMHSA publishes performance measurement guidance through the National Survey on Drug Use and Health that establishes the data quality and reporting standards national research uses for treatment providers.
The measurement discipline SAMHSA expects at the national level is the same discipline that has to happen inside every individual treatment center’s CRM.
When the CRM Becomes a Reporting Engine
The transition from CRM-as-filing-cabinet to CRM-as-reporting-engine takes about 60 to 90 days once the KPI spine is designed. The first 30 days are field configuration, custom object setup, integration wiring, and coordinator training.
The next 30 days are validation against live call data. The next 30 days are reconciliation calibration against billing.
By day 90, the operator can pull any of the four core metrics with any of the four segmentation dimensions at any time, without asking anyone for a report. That is the standard. The CRM is not a report. It is the source of truth that reports come from.
Every metric decision the operator makes from that point forward is downstream of the KPI spine and the segmentation layer.
If your CRM cannot produce a report on paid search closing rate by coordinator for the trailing 30 days in under a minute, the CRM is not doing the job. Book an intro meeting if you want to walk your current CRM configuration with our team.
Frequently Asked Questions
How do I know if my current CRM is actually being used correctly?
Pull the last 30 days of records and check three things. What percentage of records have a source captured? What percentage have a VOB status logged? What percentage of admits trace back to a specific campaign or channel?
If any of the three is below 90 percent, the CRM is not being used correctly, regardless of how many records are in it.
The follow-up test is asking your admissions team what fields they consider optional. If any coordinator can list five fields that they routinely skip, those fields are either not needed and should be killed, or they are needed and the team needs retraining on why to fill them.
The third test is the reconciliation gap. Run the CRM admit count against the billing admit count for the same 30-day window. Anything above a 5 percent gap means the CRM is not trusted as the source of truth. Fix that before you optimize anything else.
What are the fields that most treatment center CRMs are missing?
The most common gaps I see: a clean VOB status field with values beyond “yes/no” (should include no attempt, in progress, denied, viable, non-viable). A campaign source field that captures the specific paid campaign, not just “paid search.” A lead-type field that separates self-referral from family from professional referral. A commitment date field for the admit target.
Almost every CRM I audit is missing at least two of those. The fix is straightforward: add the fields, train the coordinators, and audit weekly for the first month to make sure they are being filled.
The related gap is that most CRMs lack the reporting side even when the fields exist. The dashboard rebuild is usually 40 percent of the CRM configuration work. Fields without reports produce data that nobody sees.
How often should our admissions team meet to review CRM data?
Weekly, minimum. Ideally the admissions leader reviews the week’s metrics with the team every Monday morning before calls start. The review does not need to be long. Fifteen minutes on the top three trends is enough.
Monthly reviews are too slow. At the volume most treatment centers operate at, four weeks of missed calibration is a month of coordinators drifting from the protocol. By the time you catch it in a monthly review, six to eight weeks of underperformance have already accumulated.
Daily reviews are usually overkill unless you are in an active turnaround. Once the protocol is stable and the numbers are moving in the right direction, weekly is the right cadence for both the team and the leadership tier.
Can we run these metrics on spreadsheets instead of a CRM?
Yes, if you have real data hygiene discipline. Some of the largest detox operations I have seen run their operations on spreadsheets, and they work as long as they are managed correctly. The metric is not the tool. The metric is the discipline of updating the data cleanly every time a call happens.
The problem with spreadsheets shows up at scale. Once you cross 100 admits a month, the manual data entry burden becomes overwhelming, and the segmentation dimensions become hard to filter without SQL-style capabilities.
If you are running under 50 admits a month with a small team, spreadsheets can work. If you are running above 100 admits a month, or if you have more than three coordinators, get to a proper CRM. The migration is worth the cost.
Jim Malcom is the Director of Admission Ops at Webserv, a digital marketing agency for treatment centers.