The 10 percent accuracy claim we make about PayerLenz rate estimates has a specific qualifier attached to it: the estimate lands within 10 percent of what the payer actually pays about nine times out of ten on high-confidence rate cells. That qualifier is not marketing hedging. It is a load-bearing part of how our rate intelligence platform works and how operators should use the data.
Every rate estimate PayerLenz returns carries a confidence score, and the workflow rules for handling that estimate change materially depending on whether the score comes back high, medium, or low.
Most operators evaluating rate intelligence for the first time miss the confidence layer entirely. They see the rate number, and they treat the rate number as a fact. In a category of tools that have historically returned single-number averages with no way to interpret how much to trust them, that assumption is reasonable. It is also wrong for how PayerLenz is designed to be used.
This piece walks what the confidence score actually measures, how the underlying formula works in plain language, the specific workflow rules operators should apply at each confidence tier, and why the confidence layer is what separates PayerLenz from single-number rate estimators that produce false-precision answers on thin data.
Key Takeaways
- Every PayerLenz rate estimate carries a confidence score that reflects how much data the pool has for the specific rate cell being queried. High-confidence cells are backed by many recent claims from multiple contributing facilities. Low-confidence cells are backed by thin data.
- The 10% accuracy claim applies specifically to high-confidence cells. Medium and low-confidence estimates are directional at best and should not be treated as planning-grade data.
- The confidence formula weights recent claims more heavily than older claims through a 12-month half-life decay and requires contributions from multiple distinct facilities before returning a high-confidence score. This prevents any single facility’s coding patterns from producing false-precision rates.
- The three-tier workflow rules: high-confidence rates are planning-grade and operators can commit admissions decisions against them; medium-confidence rates require admissions manager escalation before commit; low-confidence rates default to operator judgment with VOB as the primary input.
- The confidence layer is what prevents PayerLenz from returning a wrong estimate that looks right. A tool that returns a single rate number for every query without a confidence signal is producing false precision on cells where the underlying data does not support the specificity.
DEFINITION
Confidence score. A numerical representation of how much adjudicated claims data the PayerLenz pool holds for the specific rate cell being queried, weighted by how recent that data is and how many distinct facilities contributed to it. Returns as a normalized value mapped into three operational tiers: high, medium, and low. Each tier has a defined admissions workflow rule attached to it.
A rate cell is the specific combination of dimensions that identifies a unique rate context: payer, alpha prefix (for BCBS), home plan, state, level of care, network status, and reimbursement method. The confidence score tells the operator whether the estimate on that cell is planning-grade data or directional context, not a marketing decoration on the number.
What the Confidence Score Actually Measures
The confidence score is a numerical representation of how much adjudicated claims data the PayerLenz pool holds for the specific rate cell being queried, weighted by how recent that data is and how many distinct facilities contributed to it.
A rate cell is the specific combination of dimensions that identifies a unique rate context. The dimensions include payer, alpha prefix (for BCBS), home plan, state, level of care, network status, and reimbursement method. Our claims data pool network effect piece covers the underlying data infrastructure that produces the pool.
When a coordinator on an intake call runs a rate lookup for a specific patient, PayerLenz resolves the patient’s insurance card into a specific rate cell and queries the pool for that cell. The response contains two things: the expected reimbursement estimate and the confidence score attached to that estimate.
The score is not a marketing decoration on the number. It is the specific signal that tells the operator whether the number is planning-grade data or directional context.
How the Confidence Formula Works
The confidence formula has three inputs. Each input contributes to the final score, and low performance on any single input pulls the composite score down.
Claim volume in the cell. A rate cell backed by 500 recent claims produces a higher-confidence estimate than a cell backed by 5 claims. The relationship is not linear (the marginal information gain from claim 501 is smaller than the marginal information gain from claim 6), but the direction is clear.
Temporal recency. Recent claims count more than older claims through a 12-month half-life decay. A claim adjudicated last month contributes more to the confidence calculation than a claim adjudicated fourteen months ago, and a claim adjudicated three years ago contributes very little. This matters because payer adjudication patterns can shift over time (rate renegotiations, benefit design changes, policy updates), and older claims may not reflect current payer behavior.
Contributor diversity. The formula requires claims from multiple distinct facilities before returning a high-confidence score. A rate cell backed by 200 claims from one facility scores lower than a cell backed by 100 claims from three facilities, because the multi-facility signal reduces the risk that one facility’s coding or billing patterns are producing outlier claims that would not reproduce elsewhere.
The composite score returns as a normalized value that maps into three operational tiers: high, medium, and low. Each tier has a defined workflow rule attached to it.
The three confidence formula inputs
Claim volume
More claims in the cell produces a higher-confidence estimate; marginal information gain tapers
Temporal recency
12-month half-life decay weights recent claims more heavily than older ones
Contributor diversity
Requires claims from multiple distinct facilities to prevent single-source outliers
The Three-Tier Workflow Rules
The confidence score is designed to drive operational decisions, not to be a decorative metric on a dashboard. The specific workflow rules per tier are what turn the confidence signal into a functioning admissions ops discipline.

High confidence: planning-grade data
High-confidence estimates are backed by many recent claims from multiple contributing facilities in the specific rate cell. On these cells, the estimate lands within 10 percent of what the payer actually pays about nine times out of ten.
The workflow rule for high-confidence rates is that admissions decisions can commit against the estimate without additional escalation. The coordinator sees the rate on her screen alongside the VOB status, the admissions manager confirms the case aligns with program policy, and the admit lands.
Financial modeling can use high-confidence rates for revenue projections at the cell level. Payer strategy conversations with ownership can reference high-confidence rates as evidence of specific payer or plan performance. Billing team underpayment recovery can use high-confidence rates as the baseline for paid-versus-expected comparison.
Medium confidence: escalation required
Medium-confidence estimates are backed by some recent claims but the pool is not deep enough to support a high-confidence claim. The estimate is directionally useful but should not be treated as planning-grade data.
The workflow rule for medium-confidence rates is that the case escalates to the admissions manager before commit. The coordinator flags the case in the CRM, the admissions manager reviews the specific circumstances (payer history at the facility, alternative admit destinations, current census pressure), and the manager makes the admit decision with the medium-confidence estimate as one input among several.
Financial modeling should not use medium-confidence rates as the primary revenue projection driver. Payer strategy conversations can reference medium-confidence rates as context but should not commit strategy decisions solely on that data.
Low confidence: directional context only
Low-confidence estimates are backed by thin data, older claims, or claims from too few contributing facilities. The estimate is directionally useful for spotting outliers but is not defensible as a planning number.
The workflow rule for low-confidence rates is that the case does not commit against the rate estimate at all. The admissions manager treats the coverage confirmation from the VOB as the primary input, applies the program’s default policy for that payer or plan category, and admits or declines based on operator judgment rather than expected reimbursement math.
Financial modeling should not use low-confidence rates. Payer strategy conversations should not reference low-confidence rates as evidence. The value of a low-confidence signal is that it tells the operator “we do not have enough data on this specific cell to give you an operationally useful answer,” which is more honest than returning a single number that looks like planning-grade data.
OPERATOR INSIGHT
False precision is worse than no answer. A coordinator who commits an admit against a false-precision rate that came back at $2,800 per day, when the actual paid amount lands at $900 per day, has made an admissions decision that produces negative contribution margin.
The tool that gave the confident-looking number is worse than a tool that admitted “we do not have enough data on this cell” and required the manager to make a judgment call. The confidence layer forces the tool to acknowledge where the data supports operational decisions and where it does not.
What Produces High versus Low Confidence
The pool’s confidence coverage varies materially across the rate cell space. Some patterns explain where the coverage is strong and where it is thin.

High-confidence coverage is deepest in California and Florida because those two states account for roughly 85 percent of the pool. Within those states, common alpha prefixes with meaningful multi-facility claim volume produce high-confidence estimates. Common levels of care (residential SUD, PHP, IOP) with common network status (OON, in the case of many California facilities) produce high-confidence coverage.
Medium-confidence coverage tends to show up in the 21-state pool footprint on cells where the pool has enough data to produce a directional estimate but not enough multi-facility depth to support a high-confidence claim. States like Arkansas, Tennessee, Georgia, Arizona, and Texas have real data density on common cells but thinner coverage on uncommon plan-and-LOC combinations.
Low-confidence coverage appears at the edges. Rate cells outside the 21-state footprint. Rare alpha prefixes with few claims. Uncommon level-of-care and network-status combinations. Recent payer or benefit changes that have not yet accumulated enough contributed claims to update the confidence formula.
The pool grows over time. Cells that return low-confidence today will return medium or high confidence in future quarters as more facilities contribute claims and more time accumulates on the specific cell. Operators evaluating the pool for a specific payer mix should request a coverage check for their expected admit pattern to see where the confidence lands on the cells they will actually query in the workflow.
Why the Confidence Layer Prevents False Precision
The most important thing the confidence layer does is prevent PayerLenz from returning a wrong estimate that looks right.
A rate intelligence tool without a confidence layer returns a single rate number for every query. On cells where the underlying data is robust, that single number can be operationally useful. On cells where the underlying data is thin, the same single-number response produces false precision. The operator sees a specific rate number and treats it as fact, even though the underlying data does not support the specificity.
False precision is worse than no answer. A coordinator who commits an admit against a false-precision rate that came back at $2,800 per day, and the actual paid amount lands at $900 per day, has made an admissions decision that produces negative contribution margin. The tool that gave the confident-looking number is worse than a tool that admitted “we do not have enough data on this cell” and required the manager to make a judgment call.
The confidence layer forces the tool to acknowledge where the data supports operational decisions and where it does not. That honesty is what makes the 10 percent accuracy claim defensible on high-confidence cells and what protects operators from committing admissions decisions against false-precision rates on thin cells.
How Operators Use Confidence in Practice
The specific patterns we see across the client book on confidence usage are consistent enough to name.
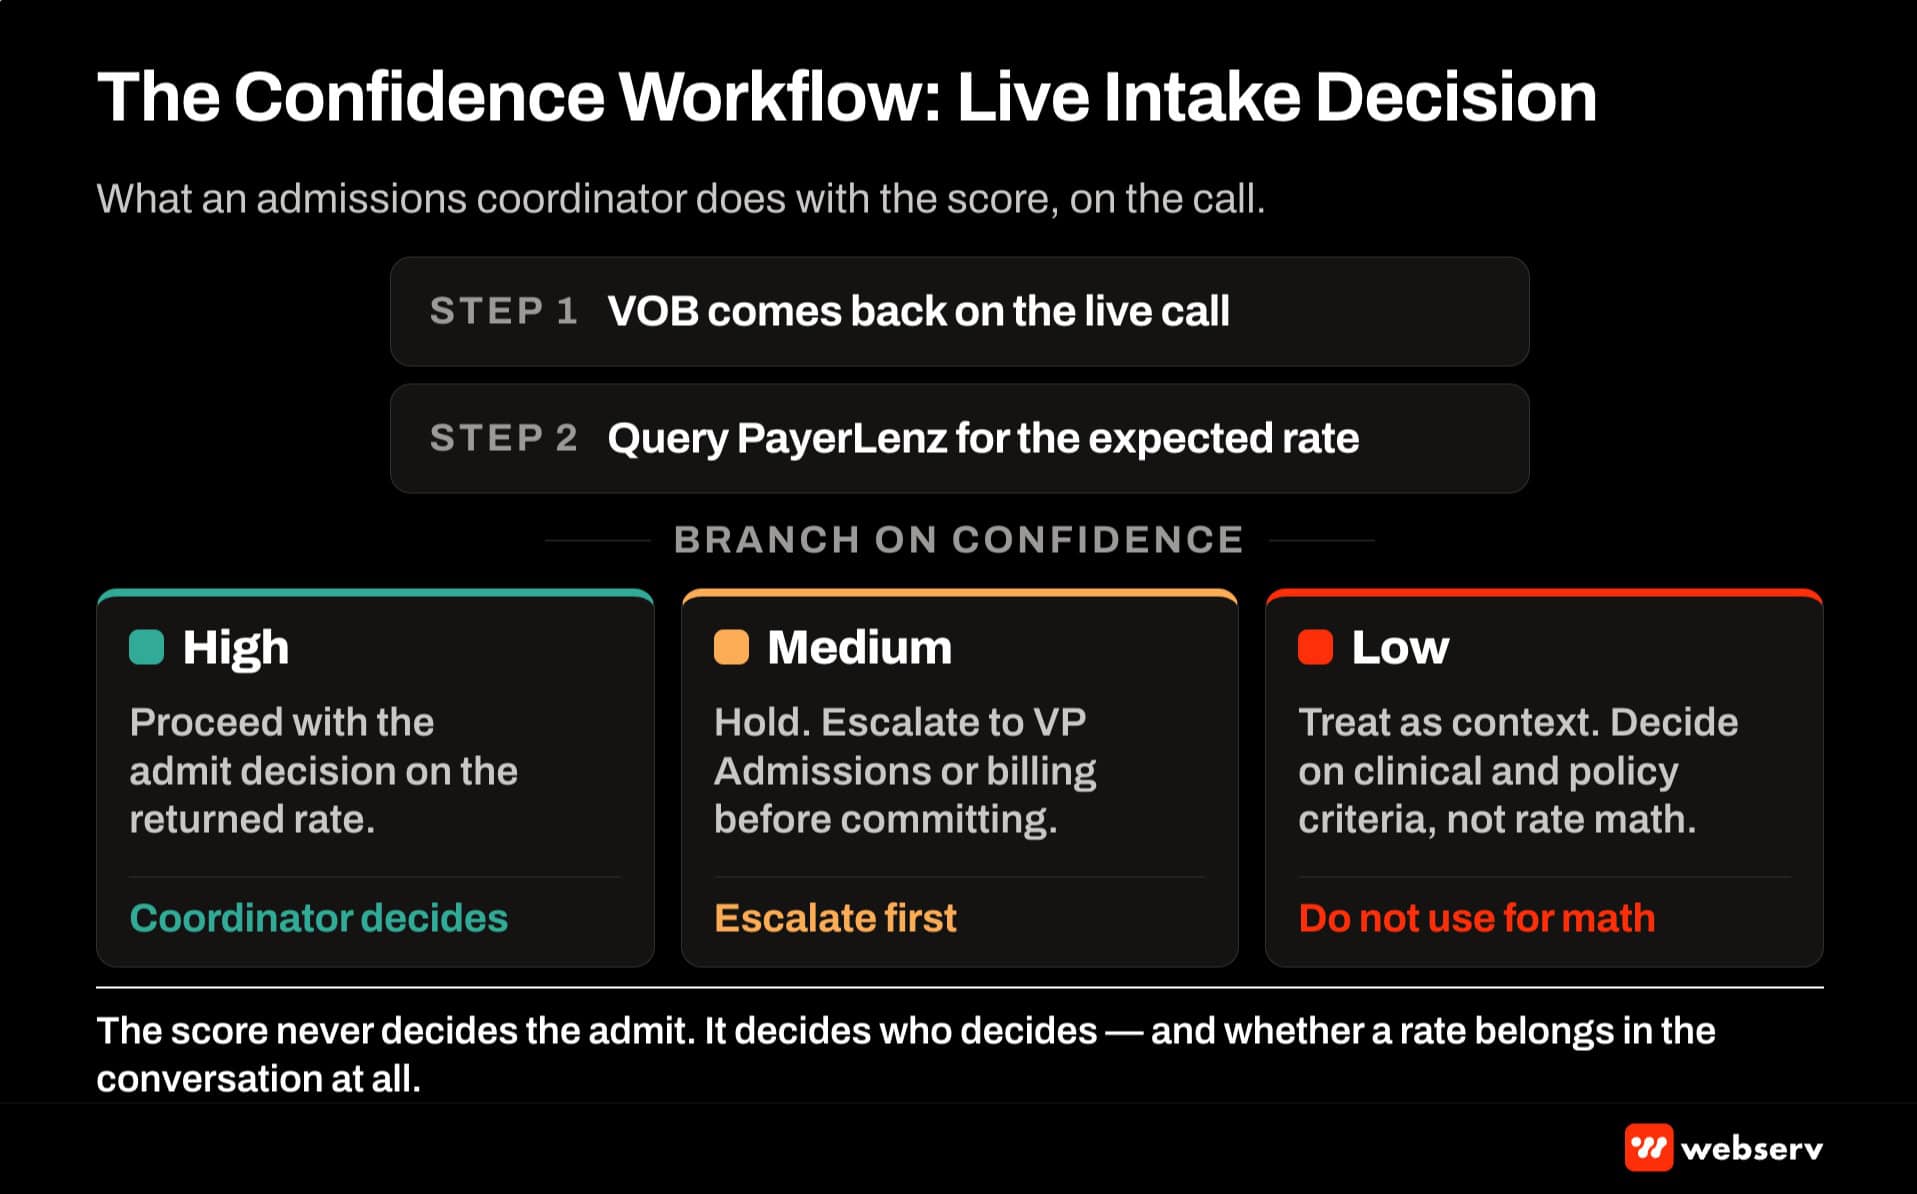
The best-in-class pattern is that the confidence score renders alongside the rate estimate on the coordinator’s screen at intake. High-confidence cells produce a green indicator and route through the normal admissions workflow. Medium-confidence cells produce a yellow indicator and trigger an automatic escalation to the admissions manager. Low-confidence cells produce a red indicator and default to operator judgment with the VOB data as the primary input.
The intermediate pattern is that the confidence score renders in the CRM but the admissions team treats all confidence tiers the same operationally. This produces some of the value of rate intelligence (visibility into what the payer typically pays) but loses the discipline that would prevent commit decisions against low-confidence estimates.
The failure pattern is that the confidence score is treated as decoration rather than as an operational signal. The team looks at the rate number, ignores the confidence indicator, and commits admissions decisions against the estimate regardless of how thin the underlying data is. This is the pattern that produces the “PayerLenz gave us $2,800 and the claim paid $900, so PayerLenz is wrong” complaint that occasionally surfaces from operators not using the tool correctly.
The rate intelligence in the admissions call script piece covers the specific CRM configuration and coordinator training that produces the best-in-class pattern.
DO
- Render the confidence score visibly on the coordinator’s screen alongside the rate estimate at intake.
- Use colored indicators (green/yellow/red) tied to high/medium/low confidence tiers.
- Trigger automatic admissions manager escalation on medium-confidence cases before commit.
- Default to operator judgment with VOB as the primary input on low-confidence cells.
- Re-query cells periodically to see how confidence and estimates trend over time.
DON’T
- Treat the confidence indicator as decoration and commit against all tiers the same way.
- Use medium or low-confidence estimates as the primary driver in financial modeling or revenue projections.
- Reference low-confidence rates as evidence in payer strategy conversations with ownership.
- Assume the confidence score is static — it updates nightly as new claims flow in.
- Blame the tool when low-confidence estimates miss; the confidence layer told you they might.
Frequently Asked Questions
What does a high-confidence versus a low-confidence rate cell actually look like?
A high-confidence rate cell is backed by many recent claims from multiple distinct contributing facilities in the specific dimensional combination being queried. A representative example: California, Anthem Blue Cross of California, residential SUD, out-of-network, with over 200 claims contributed in the past 12 months from three or more contributing facilities.
A low-confidence rate cell is backed by thin data or older claims. A representative example: Arkansas, a specific BCBS home plan with modest facility density in the state, PHP, in-network, with 8 claims contributed over the last 18 months from a single facility.
The specific thresholds that determine tier assignment are calibrated against observed accuracy against paid claims. Cells that historically produce estimates landing within 10 percent of actual reimbursement on nine of ten cases get the high-confidence classification. Cells that produce wider variance get the medium or low classification.
How does confidence change over time on the same cell?
Confidence changes as new claims flow into the pool and as older claims decay through the 12-month half-life. A cell that returns medium confidence today can return high confidence in three months if the contributing facilities add more claims in that cell during the interval.
The opposite direction is also possible. A high-confidence cell can drop to medium confidence if the specific payer changes its adjudication pattern (rate renegotiation, benefit design change) and the historical claims lose predictive power for the payer’s new behavior.
The pool tracks these transitions and updates the confidence score nightly. Operators evaluating a specific payer over time should query the same cells periodically to see how confidence and estimates are trending.
Can I trust a low-confidence estimate at all?
For directional context, yes. For financial commitment or planning-grade decisions, no.
A low-confidence estimate tells the operator “the pool has some data on this cell but not enough to produce a defensible planning number.” That signal is more useful than no signal at all because it points the admissions team toward manager escalation and VOB-primary decision-making rather than blind coordinator commitment against a false-precision rate.
The low-confidence estimate is also useful for identifying rate cells the operator should investigate further. If a low-confidence rate comes back materially different from what the operator expected based on other data sources, that discrepancy is worth understanding before the next similar admit lands.
What should I do when I get a medium-confidence rate on a live intake call?
The workflow rule is admissions manager escalation before commit. The coordinator finishes the intake conversation with the family, confirms coverage via VOB, and then routes the case to the admissions manager rather than scheduling the admit directly against the medium-confidence rate.
The manager reviews the specific circumstances: the medium-confidence rate estimate, the coverage confirmation, the program’s cost floor, the current census pressure, and any alternative admit destinations for the patient. The manager makes the admit decision with the medium-confidence estimate as one input among several rather than treating it as planning-grade data.
This escalation adds 5 to 15 minutes to the intake workflow on medium-confidence cases. The tradeoff is preventing coordinator-level commitment against rate estimates the pool cannot fully support.
How much of the pool is high-confidence versus lower-confidence coverage?
The specific breakdown varies by state, payer, and level of care. In California residential SUD OON cells (the deepest part of the pool), a materially high percentage of common alpha prefix and home plan combinations return high confidence. In the 21-state pool footprint on less common cells, confidence drops materially.
For any operator evaluating the pool, the useful question is not “what percentage of the pool overall is high confidence” but rather “what percentage of my expected admit pipeline maps to high-confidence cells in the pool.” That question is answerable through a facility-specific coverage audit run against the operator’s expected payer mix.
We run coverage audits during PayerLenz evaluation conversations for exactly this reason. Aggregate pool statistics matter less than facility-specific confidence coverage on the payer mix the operator actually admits.
Why not just return a single rate number without the confidence layer?
Because false precision does more damage than no answer. A rate intelligence tool that returns a single-number estimate on every query without a confidence signal produces confident-looking numbers on cells where the underlying data does not support the specificity.
Operators committing admissions decisions against those false-precision numbers make bad admits at rates they did not expect. The complaint that surfaces afterward is “the tool was wrong,” when the underlying issue is that the tool did not acknowledge its own thin data on the cell in question.
The confidence layer solves this by forcing the tool to be honest about which estimates operators can plan against and which are directional at best. The reimbursement intelligence guide covers the broader category framework this discipline sits inside.
Kyle McHenry is Co-founder of Webserv, Founder of Revenue Logic (a white-glove behavioral health revenue cycle firm), and Co-founder of the PayerLenz reimbursement intelligence product. He has been inside behavioral health verification, claims, and payer relationships for 15 years and works with treatment center operators on the rate intelligence discipline that closes the gap between admissions and collections.