A treatment center we work with came to me last quarter convinced their Google Ads creative had stopped working. The cost per inquiry had climbed 40 percent in six weeks.
We had already rebuilt the ad copy twice. The keywords were the same ones that had produced admits for two years.
I pulled the heatmap data for the landing page before we touched the campaigns again. The story was sitting in the click map.
The phone CTA had been pushed below a new alumni-story video block that someone on the web team installed without telling paid media. Mobile users were watching 14 seconds of the video, then bouncing without ever scrolling to the phone number.
The ad creative was fine. The campaign structure was fine. The page broke six weeks earlier and nobody saw it because nobody was looking at the heatmaps.
This is what most rehab paid media programs miss. Inside Webserv’s paid media program for treatment centers, heatmap data is one of the first three things we audit on any account that isn’t producing the admit volume it should.
The signal is almost always there. Most operators just don’t know which signals to look for, which tools to use, or how to configure them so they actually show conversion problems instead of generic mouse traces.
This guide walks through the modern heatmap stack, the five signals that matter for rehab landing pages, the patterns that show up consistently across behavioral health portfolios, and the four-step workflow we use to turn heatmap data into conversion lift.
Key Takeaways
- Most rehab landing page heatmap setups produce no conversion lift because operators install the tool once, never segment the data, never check it on mobile, and do not configure for HIPAA constraints.
- The 2026 default for most operators is Microsoft Clarity (free, AI session summaries, unlimited sessions). Hotjar still wins on survey capability if you can absorb the price. Neither is HIPAA-compliant out of the box.
- Five heatmap signals carry the conversion insight for rehab pages. Click maps reveal CTA visibility. Scroll maps reveal form-depth problems. Move maps reveal attention patterns. Rage and dead clicks reveal UX friction. Session recordings reveal the hesitation moments that aggregate data misses.
- Five behavioral-health-specific failure patterns show up across rehab portfolios. Mobile phone CTA invisibility above the fold. Forms buried below trust-signal content. Sticky CTA bars matching the background. Competing primary CTAs. Autoplay video pulling cursor attention away from the form.
- Heatmap data should trigger a redesign when the failure pattern is structural (form placement, CTA visibility, mobile breakage). It should trigger an A/B test when the failure pattern is interpretive (copy variation, value-prop ordering, trust-signal weighting).
Why Most Rehab Landing Page Heatmaps Don’t Produce Conversion Lift
MOST COMMON HEATMAP MISUSE
Reading heatmaps as decoration rather than as a hypothesis engine. A heatmap that shows visitors clicking on the header logo is not a bug — it is a signal that they want to escape the page. A heatmap that shows attention on a phone number instead of the form is not a form problem — it is a copy problem. Heatmaps only produce conversion lift when the reviewer names a specific hypothesis, tests one variant, and measures the delta against a control. Otherwise they are expensive wallpaper.
Most treatment centers I audit have a heatmap tool installed. Almost none of them are getting meaningful conversion insight from it. The failure modes are consistent.
The first failure is install-once neglect. The marketing team installed Hotjar or Clarity a year ago, looked at the data once, and never checked back.
The tools accumulate session recordings nobody watches. The aggregate click maps drift further from current account performance because the page has changed but the historical data hasn’t.
The second failure is no segmentation. Heatmap data with all traffic bundled together hides the conversion problem. Paid traffic from a Google Ads campaign behaves differently than organic traffic landing on service pages. Mobile users behave differently than desktop.
Insurance-verified users behave differently than first-time visitors. Without segmentation, the click map averages across all of them and shows nothing actionable.
The third failure is desktop-only review on mobile-heavy traffic. Most BH traffic is mobile, in crisis, time-pressured.
Reviewing the desktop heatmap when 75 percent of inquiries come from mobile produces conclusions that don’t transfer. Mobile heatmaps tell a different story, and they’re the one that matters.
The fourth failure is the HIPAA configuration gap. Out of the box, most heatmap tools record form field inputs in session replays. For rehab landing pages, that’s a compliance exposure. Operators who don’t configure masking either run the risk or shut the tool off entirely.
The fifth failure is no connection to test methodology. Heatmap data sits in a separate tool from the A/B testing platform. The insight doesn’t translate into a test hypothesis. The page stays the same because nobody ties the heatmap finding to a structured change.
Programs that fix these five failure modes typically see CRO insight quality jump within the first 60 days. The tools did not change. The discipline of using them did.
The 2026 Heatmap Tool Stack and the HIPAA Reality
Three tools cover most of the rehab marketing market in 2026. Each has tradeoffs.
Microsoft Clarity is the default for most operators. It is free with unlimited sessions, ships with AI Copilot session summaries, and runs on more than 2 million sites globally.
The data quality matches Hotjar Pro at zero cost. For treatment centers without a heavy CRO budget, this is the starting point.
Hotjar, now part of Contentsquare, retains the edge on surveys and feedback widgets. The full Observe and Ask suite runs around $200 per month after the Contentsquare pricing migration.
Programs that lean on post-form survey data or on-page feedback widgets to qualify intent often justify the spend. Programs that just need heatmap and session replay data are better served by Clarity.
FullStory’s free tier offers 30,000 sessions per month with 12-month retention, paired with enterprise-grade session search.
For programs that need to query “show me every session where the user clicked the phone CTA but did not dial,” FullStory’s search capability is the differentiator. Most treatment centers do not operate at this query depth, which makes FullStory overkill outside enterprise behavioral health networks.
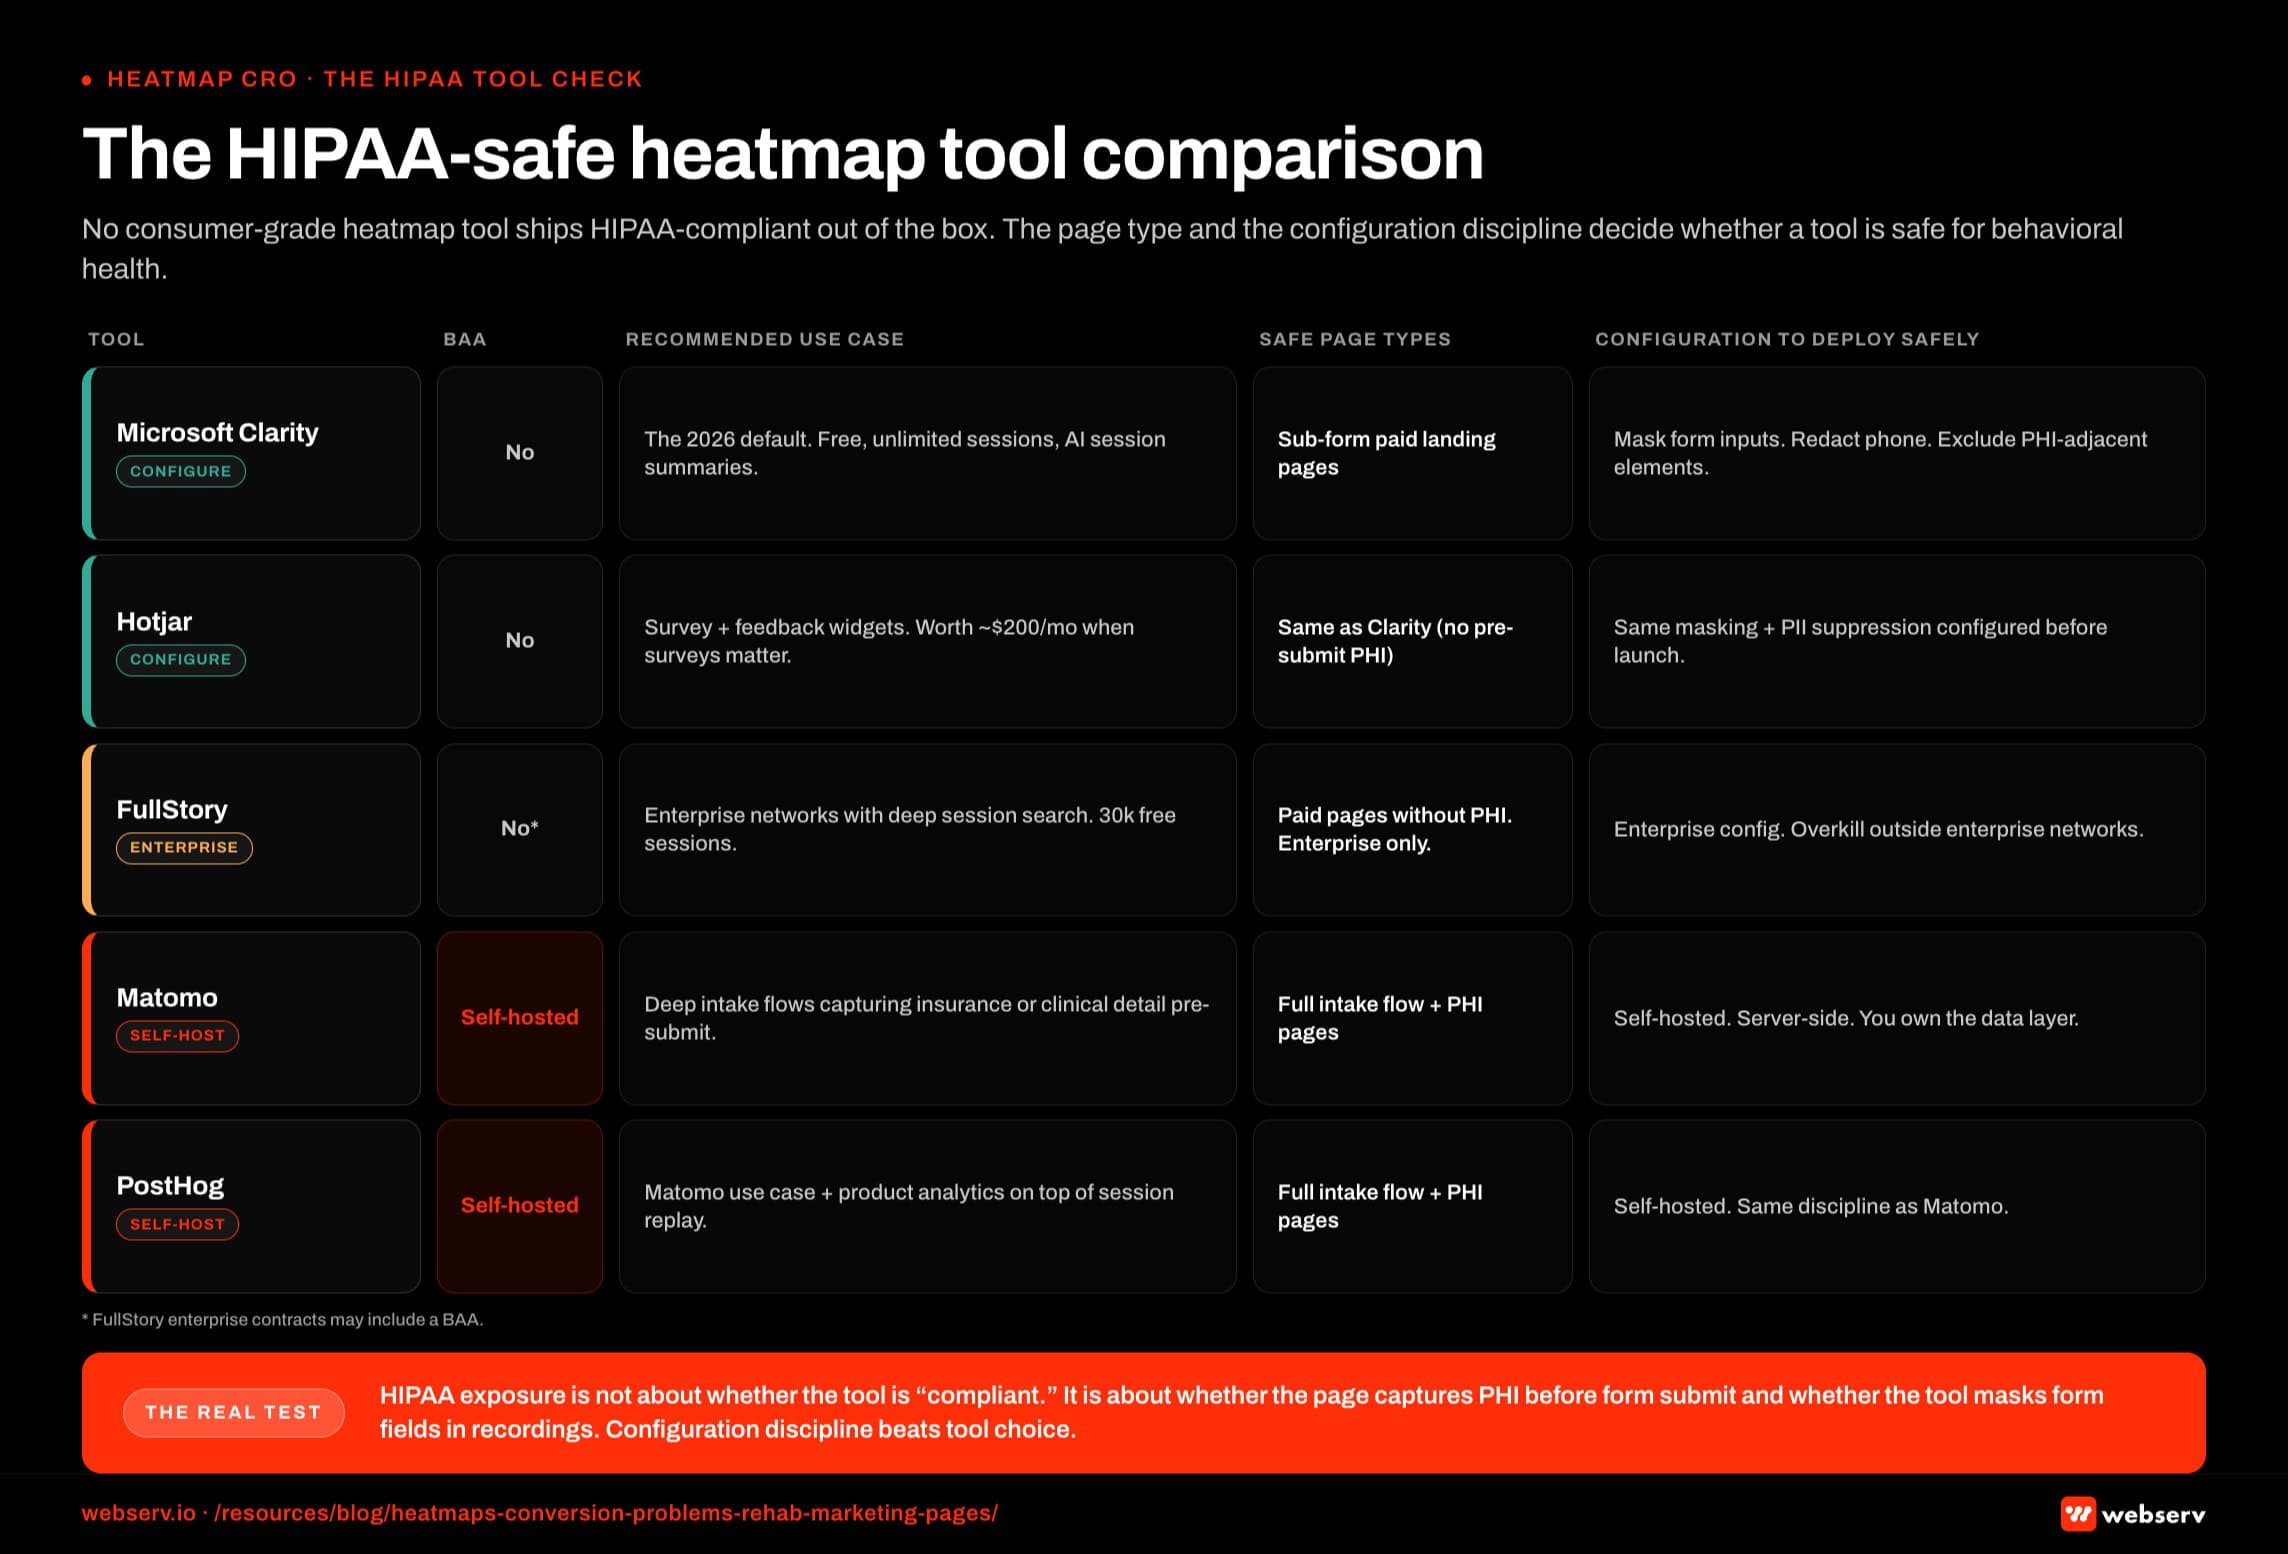
The HIPAA reality has to be addressed before any of these tools goes live on a rehab landing page. Microsoft Clarity, Hotjar, and FullStory are not HIPAA-compliant by default. None offers a Business Associate Agreement for standard use.
The good news is that most rehab paid landing pages do not collect protected health information before the form submit. Name, phone, and best-time-to-call are not PHI on their own.
That makes Clarity and Hotjar usable on landing pages if the tool is configured to mask form field inputs in session recordings, redact phone number entries, and exclude PHI-adjacent elements like insurance details and clinical questions from capture.
For deeper intake flows that capture insurance verification or clinical detail before the lead form submit, a self-hosted alternative (Matomo, PostHog) or a fully HIPAA-compliant analytics tool is the right call.
Our walkthrough of Meta Conversions API for treatment centers without violating HIPAA covers the broader compliance framework. The heatmap layer follows the same logic.
The Five Heatmap Signals That Matter for Rehab Landing Pages
Most heatmap dashboards show dozens of metrics. Five carry the conversion insight for rehab pages. Everything else is supporting context.
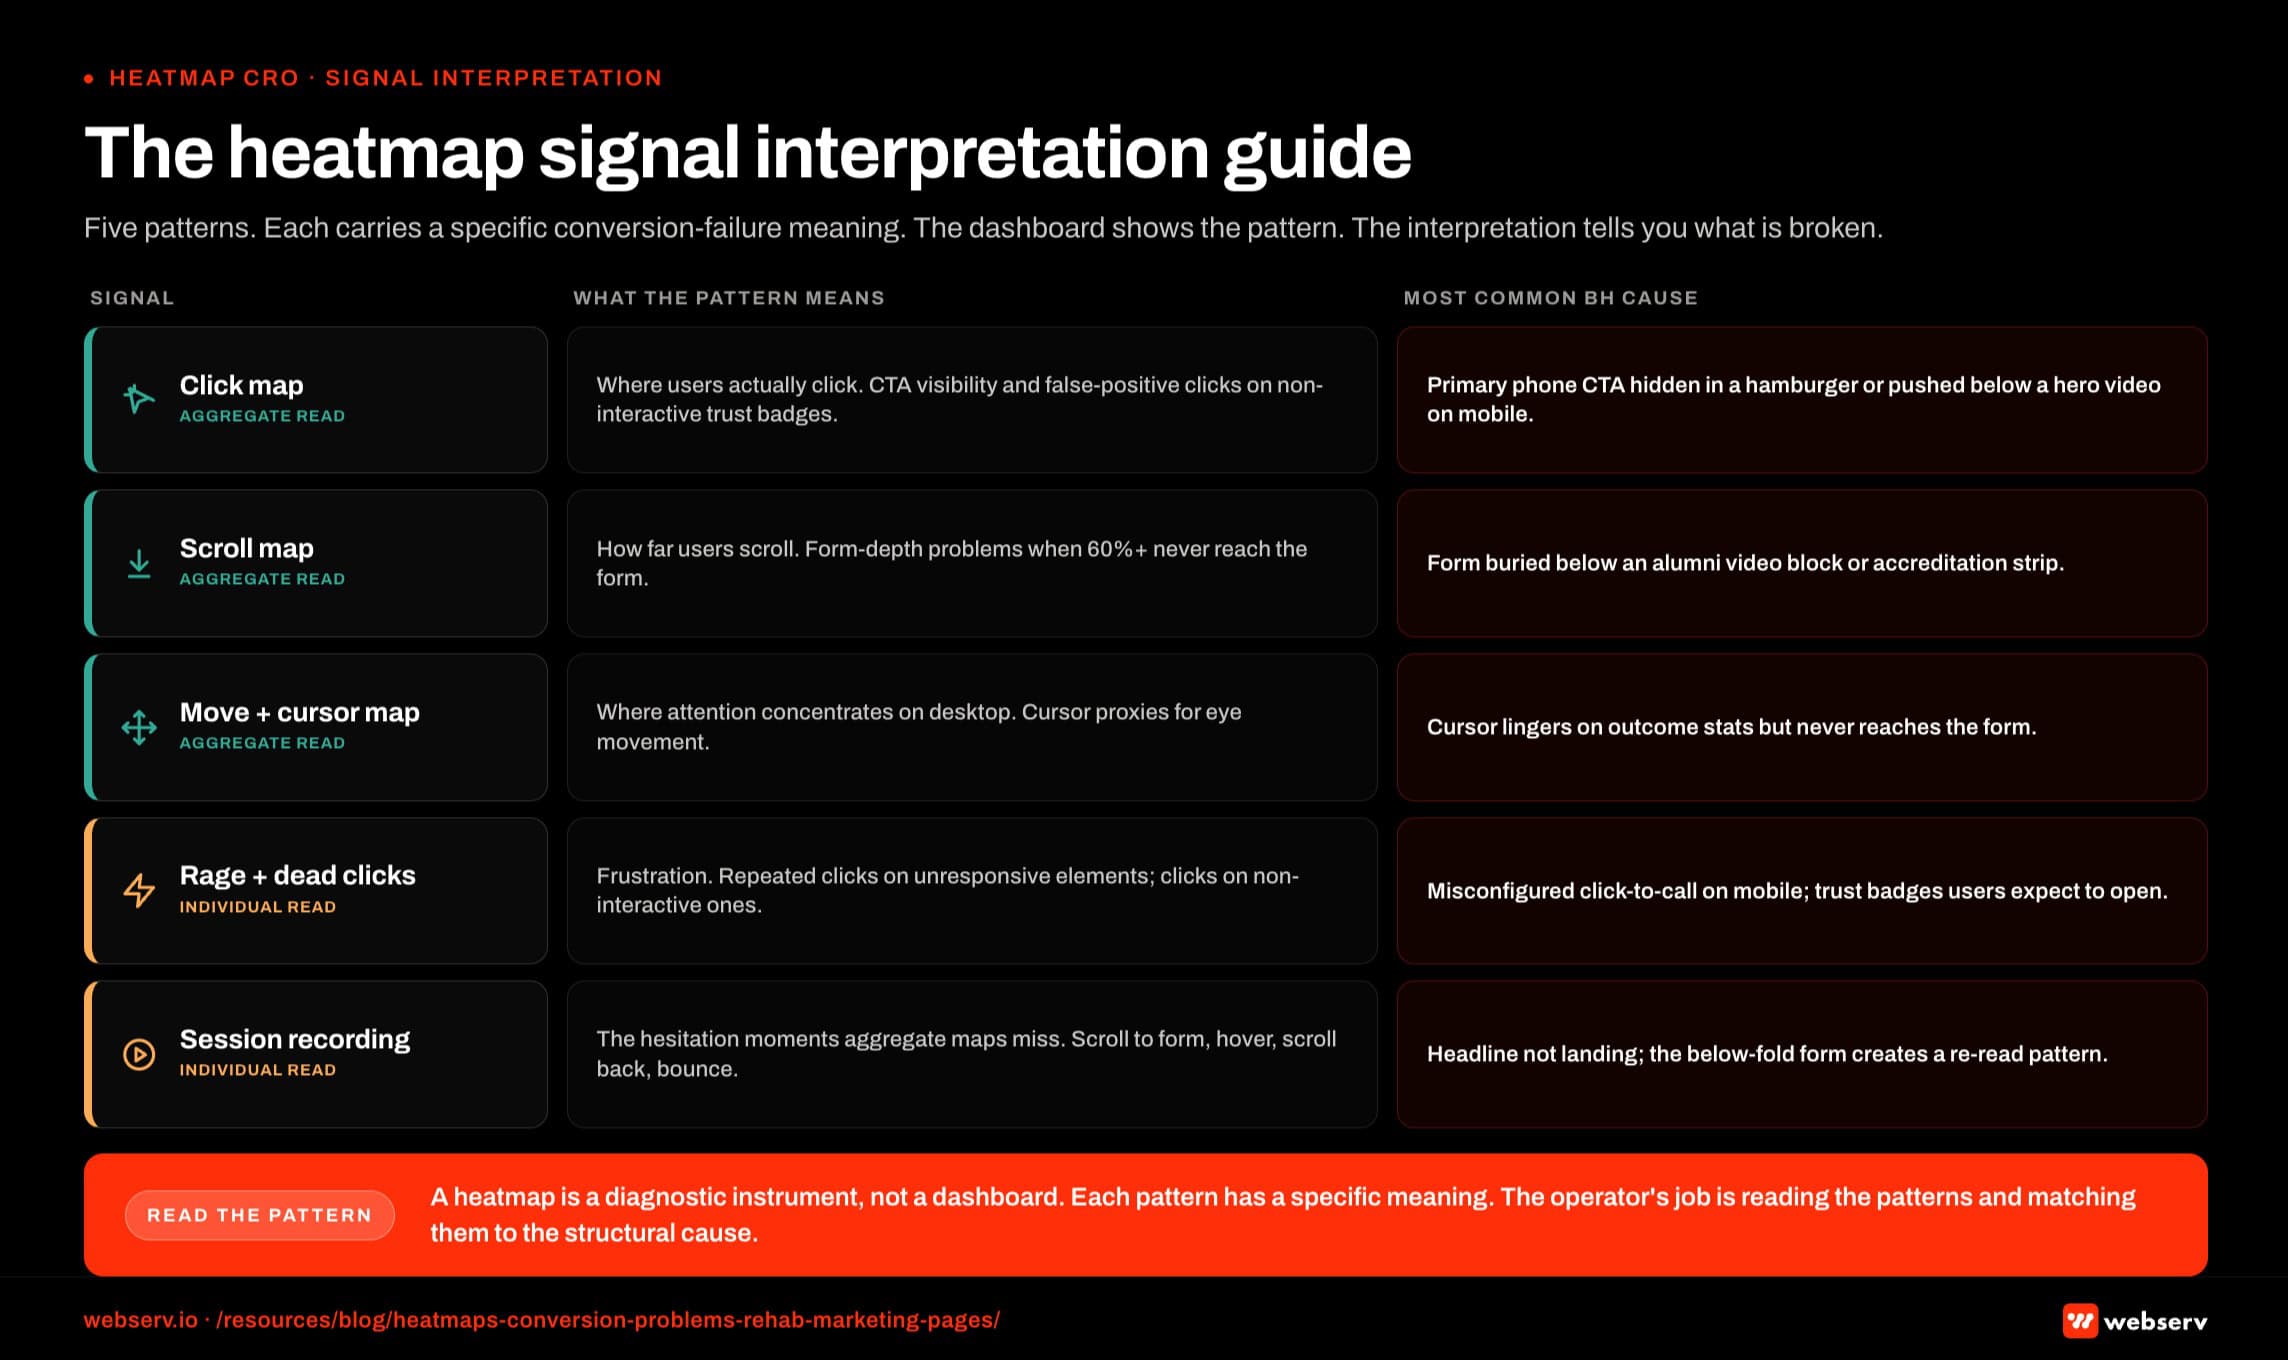
Click maps are the foundation. They show where users actually click, including the false-positive clicks on non-interactive elements that look clickable.
For rehab landing pages, click maps reveal whether the primary phone CTA is getting the click volume the campaign structure assumes, whether secondary CTAs are stealing click share from the primary, and whether users are clicking on non-interactive trust-signal badges expecting them to lead somewhere.
Scroll maps show how far down the page users scroll. For rehab landing pages, scroll maps reveal one of the most common conversion killers in the vertical: forms buried below content the operator considered essential.
If 60 percent of users never reach the form because they bounce at the alumni-story video block, no amount of form optimization produces lift. The fix is moving the form, not improving it.
Move and cursor maps show where attention lingers across the page. Cursor proxies for eye movement on desktop better than people expect.
Mobile move maps work differently (touch behavior, scroll velocity, momentum) but produce similar insight when interpreted correctly. For rehab pages, move maps reveal what content actually holds the family member’s attention before they decide to call.
Rage clicks and dead clicks are the frustration indicators. Rage clicks happen when a user clicks the same element repeatedly because nothing’s responding. Dead clicks happen on elements that look interactive but aren’t. Both signal broken UX.
For rehab landing pages, rage clicks on the phone CTA usually mean the click-to-call link is misconfigured on mobile. Dead clicks on trust badges mean users expected them to open verification details.
Session recordings are the full path replay. They reveal the moments of hesitation that aggregate maps miss.
The user who scrolls to the form, hovers for 12 seconds, scrolls back up to re-read the headline, scrolls back to the form, and then bounces.
That hesitation pattern does not show up in click maps or scroll maps. It shows up in the session recording, and it tells you the headline is not doing its job.
Programs that ignore session recordings in favor of aggregate maps miss roughly a third of the actionable insight in the data.
“The thing operators get wrong is treating the heatmap like a dashboard you look at once a quarter. Heatmaps work when you tie them to the specific question the account is trying to answer that month. The data answers questions. It does not generate them.”
Preston Powell, Chief Executive Officer, Webserv
Five Behavioral Health Specific Failure Patterns Heatmaps Surface
PATTERNS THAT NEED IMMEDIATE ATTENTION
- Concentrated clicks on privacy-adjacent copy. Visitors are testing whether the page is safe. Confidentiality framing needs to move higher.
- Sharp scroll drop-off right before the insurance step. The insurance widget is scaring people out before they engage. Move it below social proof.
- Rage clicks on the phone number. The CTA hierarchy is confusing form-vs-call intent. Add explicit language.
- Dead zones around clinical credentials. The proof stack is not resolving fast enough visually. Restructure for scannability.
PATTERNS THAT ARE NOT ACTUALLY PROBLEMS
- Broad attention on the hero image. Faces get looked at. That is expected, not a signal.
- Clicks on the logo. Standard exit behavior on any site. Fix the page, not the logo click.
- Scroll depth stopping at social proof. If they scrolled that far, they got the proof. Below the fold is for higher-intent visitors.
- Heatmap concentration on the CTA. That is the point. Attention on the CTA is a win, not a problem.
Across the treatment center accounts we run, the same five conversion problems show up in heatmap data repeatedly. They’re worth knowing in advance because they take three months to find blind and 30 minutes to find when you know what to look for.
Pattern 1: Phone CTA invisible on mobile above the fold. Most BH traffic is mobile, in crisis, time-pressured. Click maps surface this in the first session.
The user lands on the page, the phone CTA is hidden in a hamburger menu or pushed below a hero video, and the click rate on the primary action is half of what the page structure assumes.
The fix is moving the phone CTA into the persistent mobile header or as a sticky button. The data tells you when this is broken in under a day.
Pattern 2: Form buried below trust-signal content. Operators want to lead with accreditation badges, alumni stories, and clinical credentials. The intention is right. The placement breaks conversion.
Scroll maps consistently show 60 percent or more of users never reaching the form when it sits below three trust-signal blocks. The fix is moving the form into the hero section with the trust signals layered around it, not before it.
Pattern 3: Sticky CTA bar invisible against the background. Sticky CTAs that share color values with the page background get scrolled past.
Click maps reveal the actual click zone is far smaller than the visible button surface area. The fix is contrast adjustment, usually a darker background bar or a stronger button color.
Pattern 4: Insurance verification button competing with phone CTA. Two primary CTAs split attention. Heatmap data shows which one wins and which one creates analysis paralysis.
The fix is structural: pick one primary action per page, demote the other to secondary visual hierarchy. For most rehab pages, the phone CTA should be primary and insurance verification should be secondary unless the page is specifically built for an insurance-verification campaign.
Pattern 5: Autoplay video pulling cursor attention from the form. Autoplay videos pull cursor and eye movement. Session recordings show users pausing the video, watching 8-12 seconds, then bouncing without ever returning to the form.
The fix is replacing autoplay with click-to-play, or moving the video below the form so it functions as supporting content rather than the page’s first attention-grab.
Programs that fix these five patterns typically see conversion rate lifts in the 20 to 60 percent range without changing ad creative, bidding strategy, or campaign structure.
The Four-Step Heatmap Audit Workflow
The audit is a workflow, not a tool. The tool produces the data. The workflow turns the data into conversion lift. We run this inside Webserv’s paid CRO program for treatment centers against every paid media engagement that isn’t producing the admit volume the account structure should deliver.
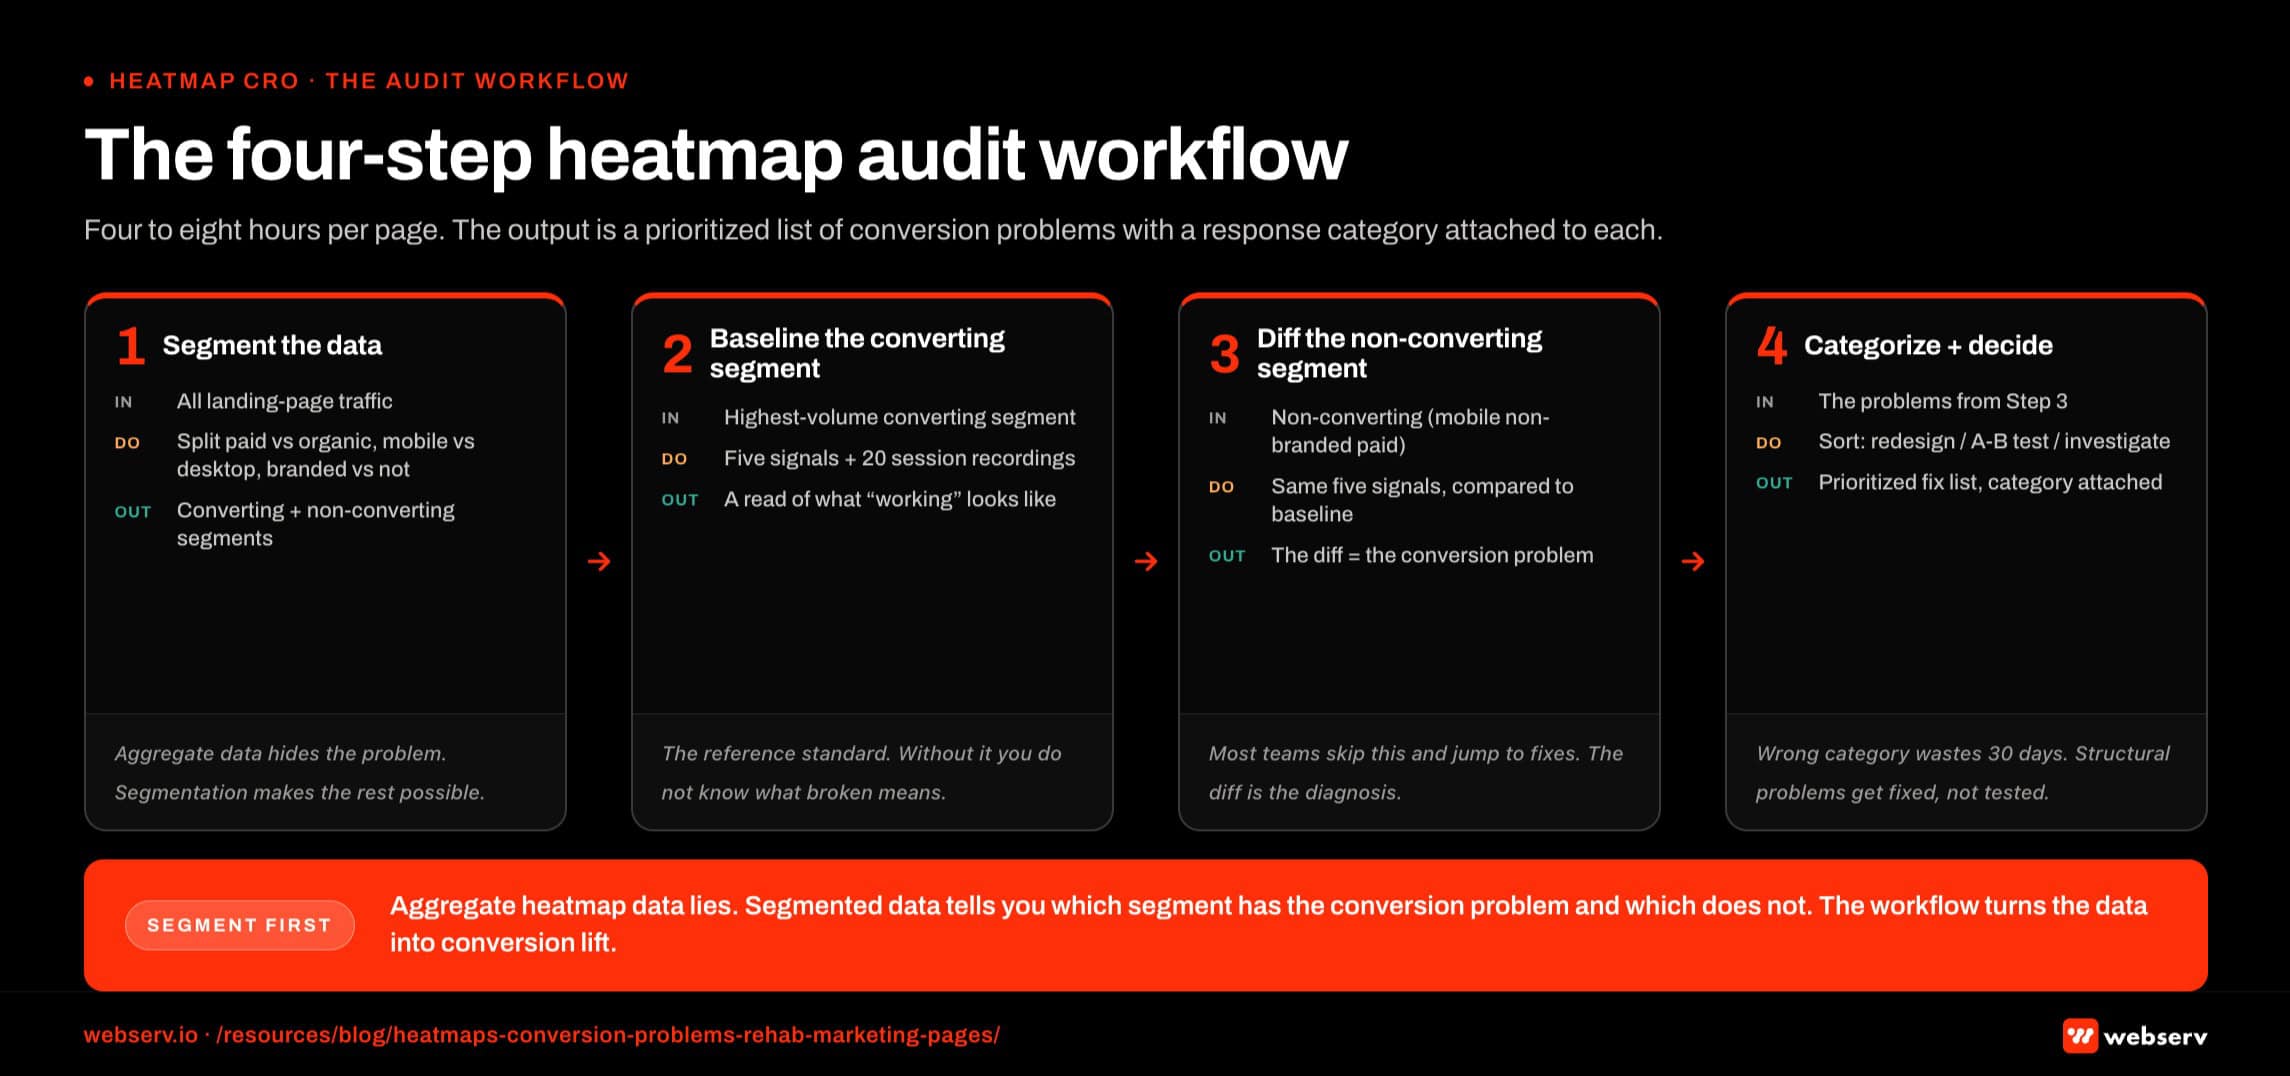
Step 1: Segment the data. Before looking at a single heatmap, segment the traffic. Paid versus organic. Mobile versus desktop. Branded versus non-branded keywords. New visitor versus returning.
Aggregate heatmap data lies to you. Segmented heatmap data tells you which user segment has the conversion problem and which doesn’t.
Step 2: Pull the five signals against the converting segment. Run click maps, scroll maps, move maps, rage/dead click data, and at least 20 session recordings against the highest-volume converting segment. This is your baseline. Document what working looks like for this audience.
Step 3: Pull the same five signals against the non-converting segment. Same five signals, applied to the segment that’s not converting (typically mobile non-branded paid traffic for treatment centers). Compare to the converting baseline. The diff is the conversion problem.
Step 4: Categorize the finding and decide on the response. Some findings trigger immediate redesigns (broken click-to-call link, buried form). Some findings trigger A/B tests (headline variation, value-prop ordering). Some findings trigger a deeper investigation (campaign structure question rather than landing page question).
Our companion piece on running A/B tests on treatment center contact forms covers the test methodology side of this.
The full workflow typically runs 4 to 8 hours per landing page audit. The output is a prioritized list of conversion problems with the response category attached to each.
When Heatmap Data Should Trigger a Test vs a Redesign
Heatmap data answers two questions. Is the conversion problem structural or interpretive. The answer determines whether the response is a redesign or an A/B test.
Structural problems are the obvious ones. The phone CTA isn’t visible on mobile. The form is buried below 3,000 pixels of trust-signal content. The click-to-call link doesn’t fire on Android. The sticky CTA matches the background color.
These don’t need testing. Fix them inside a structured rehab landing page rebuild and re-measure.
Interpretive problems are the ones where multiple solutions could work. The headline isn’t holding attention, but is the fix shorter copy, different value prop, or a stronger emotional hook.
The form converts but the field order might be suboptimal. The hero image conveys the wrong tone, but which tone is right. These need testing because the data shows a problem but does not show the solution.
The mistake most operators make is over-testing structural problems and under-testing interpretive ones.
Running an A/B test on whether the phone CTA should be visible above the fold wastes 30 days because there’s no version where it shouldn’t be.
Running an A/B test on whether the hero headline should focus on outcomes or on family pain produces real learnings because both versions are defensible.
Our landing page optimization guide for addiction treatment covers the broader redesign-vs-test decision framework. The heatmap audit is the input that determines which category each finding falls into.
Frequently Asked Questions
Which heatmap tool should a treatment center use for paid landing pages?
For most treatment centers, Microsoft Clarity is the right starting point. It’s free, includes AI session summaries that surface failure patterns automatically, and runs on unlimited sessions without rate-limiting smaller accounts. The data quality is on par with Hotjar Pro at zero cost.
The exceptions are programs that need on-page surveys and feedback widgets to qualify intent (Hotjar’s differentiator), programs running at enterprise scale with deep session-search requirements (FullStory), or programs that capture PHI before form submit and need self-hosted infrastructure (Matomo or PostHog).
For rehab paid media programs running a typical landing page set, Clarity covers 90 percent of the use cases. We use it on most accounts unless the program’s specific needs justify the spend or compliance lift of an alternative.
Are Microsoft Clarity and Hotjar HIPAA-compliant for rehab use?
Not by default. Neither offers a Business Associate Agreement for standard use, and neither’s terms of service support HIPAA-grade PHI handling.
For rehab paid landing pages that do not capture PHI before the form submit (name, phone, best time to call only), both tools are usable when configured to mask form field inputs, redact phone number entries in session recordings, and exclude PHI-adjacent elements from capture.
For pages that capture insurance verification, clinical questions, or any PHI before the lead form submit, a self-hosted alternative (Matomo, PostHog) or a fully HIPAA-compliant analytics tool is the right move. The configuration discipline matters more than the tool choice. Operators running Clarity or Hotjar without masking configuration have a compliance exposure even if the page doesn’t currently capture PHI.
How often should we run a heatmap audit on rehab landing pages?
A full heatmap audit should run when the account is producing unexpected results, when the landing page changes, when seasonal traffic patterns shift, or on a quarterly cadence even when nothing’s broken.
For active rehab paid media programs, we run a focused weekly review (15 minutes, mobile click map and rage clicks only) and a full audit quarterly. The weekly review catches sudden breakage. The quarterly audit catches drift.
Programs that run the audit annually almost always discover problems that have been compounding for months. The cost of those months in lost admit volume is materially higher than the cost of more frequent review.
What’s the difference between a click map and a session recording, and when do I use each?
Click maps aggregate every user click into a single visual overlay showing where attention concentrated. They’re best for diagnosing visibility problems (CTA missed, false-positive clicks on non-interactive elements) and for confirming that the page structure is producing the click distribution the campaign assumes.
Session recordings replay individual user sessions. They’re best for diagnosing the moments of hesitation that aggregate data misses (the user who scrolls past the form three times before bouncing) and for understanding the cognitive flow of users who don’t convert.
Most heatmap audits start with click maps and scroll maps for the aggregate diagnosis, then watch 10-20 session recordings of non-converting users to understand the specific friction points. Programs that try to skip directly to session recordings without the aggregate context often draw the wrong conclusion from individual outlier sessions.
How much conversion lift can heatmap-driven changes produce on a rehab landing page?
The range depends on starting baseline and how broken the page is. Pages with the structural failure patterns described above (buried form, invisible CTA, autoplay video pulling attention) typically see 20 to 60 percent conversion rate lift from fixing the structural issues alone. Pages already structurally clean see smaller lifts in the 5 to 15 percent range from interpretive optimizations.
The lift compounds with paid media performance. A 30 percent landing page conversion rate lift on a $40,000 monthly Google Ads budget can produce a meaningful admit volume increase without changing ad spend. The cost-per-admit math shifts proportionally.
Programs that combine heatmap-driven structural fixes with disciplined A/B testing on the interpretive layer typically see cumulative conversion rate lifts of 50 to 120 percent over a 6-month optimization cycle.
How does heatmap data fit alongside CallRail and conversion tracking for treatment centers?
Heatmap data covers the on-page user behavior. CallRail covers the call attribution layer. Google Ads and Meta conversion tracking cover the platform-side conversion signal. The three operate together and feed different decisions.
Heatmap data tells you where on the page the friction is. CallRail and conversion tracking tell you which campaigns and creatives are driving the highest-quality inquiries. The right paid media optimization workflow uses all three. Programs that look at only one tool make worse decisions than programs that integrate the three layers.
For rehab paid media specifically, the integration pattern is heatmap audit on the page, CallRail attribution on the inquiry, and Google Ads/Meta conversion tracking on the ad-platform optimization layer. Each layer informs the others. The disciplined paid CRO programs we run for treatment centers tie landing page benchmarks to heatmap insight and back into the broader landing page playbook on a structured cadence.
Fix Your Paid CRO Layer Before You Touch the Campaigns Again
Most rehab paid media programs that come to us already have ad creative quality and campaign structure in the right zone. The conversion problem is on the landing page, and the landing page problem is sitting in heatmap data that nobody’s looked at recently.
Before scaling ad spend on a treatment center program that isn’t producing the admit volume the structure suggests, audit the landing page. The heatmap workflow described above is the fastest path to the answer.
Pair the audit with landing page benchmarks, CallRail attribution, and the conversion tracking layer for a full picture of where each campaign’s friction lives.
Book an intro call to see what a heatmap audit on your treatment center’s paid landing pages would surface and what the conversion rate ceiling actually is once the structural problems are fixed.
For the broader picture of how paid media CRO fits inside a full treatment center marketing program, see our ultimate guide to behavioral health marketing.
Mitch Marowitz is Director of Paid Media at Webserv, where he leads Google Ads, Meta, and emerging paid channel strategy for behavioral health treatment centers. He has overseen more than $45M in managed media spend across the addiction treatment category and writes about paid acquisition for treatment operators.