Denial management is the specific revenue cycle discipline that determines whether treatment center admissions convert into collected revenue at rates that support facility economics or leak revenue through denials that never get appealed or that get appealed too late. It lives inside our eligibility and reimbursement capability.
Facilities with strong denial management processes typically collect 80 to 90 percent of billed revenue on claims that initially face denial. Facilities without denial management processes typically collect 40 to 60 percent of the same billed revenue.
The eligibility and reimbursement capability at Webserv operates on the specific pattern that denial management runs alongside the pre-admission and admission workflows, not after them. Denial patterns get detected during pre-authorization submission and clinical documentation review, before they escalate to full claim denial.
The pattern I see across treatment center billing operations: denials get treated as a downstream problem the billing team solves through appeals rather than as an upstream problem the clinical and admissions teams prevent through documentation quality.
The specific downstream cost: facilities with strong appeals processes still collect meaningfully less than facilities with strong prevention processes because appeals produce partial collections at best while prevention produces full collections.
This piece walks the denial management playbook for behavioral health treatment centers. The specific denial categories that produce most BH revenue leakage, the prevention framework that reduces initial denial rates, and the appeal workflow that overturns initial denials at 40 to 65 percent.
It also covers the specific timing standards that separate collectible appeals from time-barred appeals, the concurrent review coordination that prevents mid-stay denials, and the measurement patterns that isolate denial management performance from other revenue cycle variables. Related workflow pieces: our revenue cycle management guide, pre-admission eligibility verification playbook, VOB vs pre-authorization guide, OON reimbursement math, and the downstream reimbursement intelligence hub. Broader context in our ultimate guide to behavioral health marketing.
Key Takeaways
- Denial management determines whether admissions convert to collected revenue at 80 to 90 percent (strong denial management) or 40 to 60 percent (weak denial management). The 30 to 40 percentage point spread compounds over annual admit volume to produce meaningful facility economics differences.
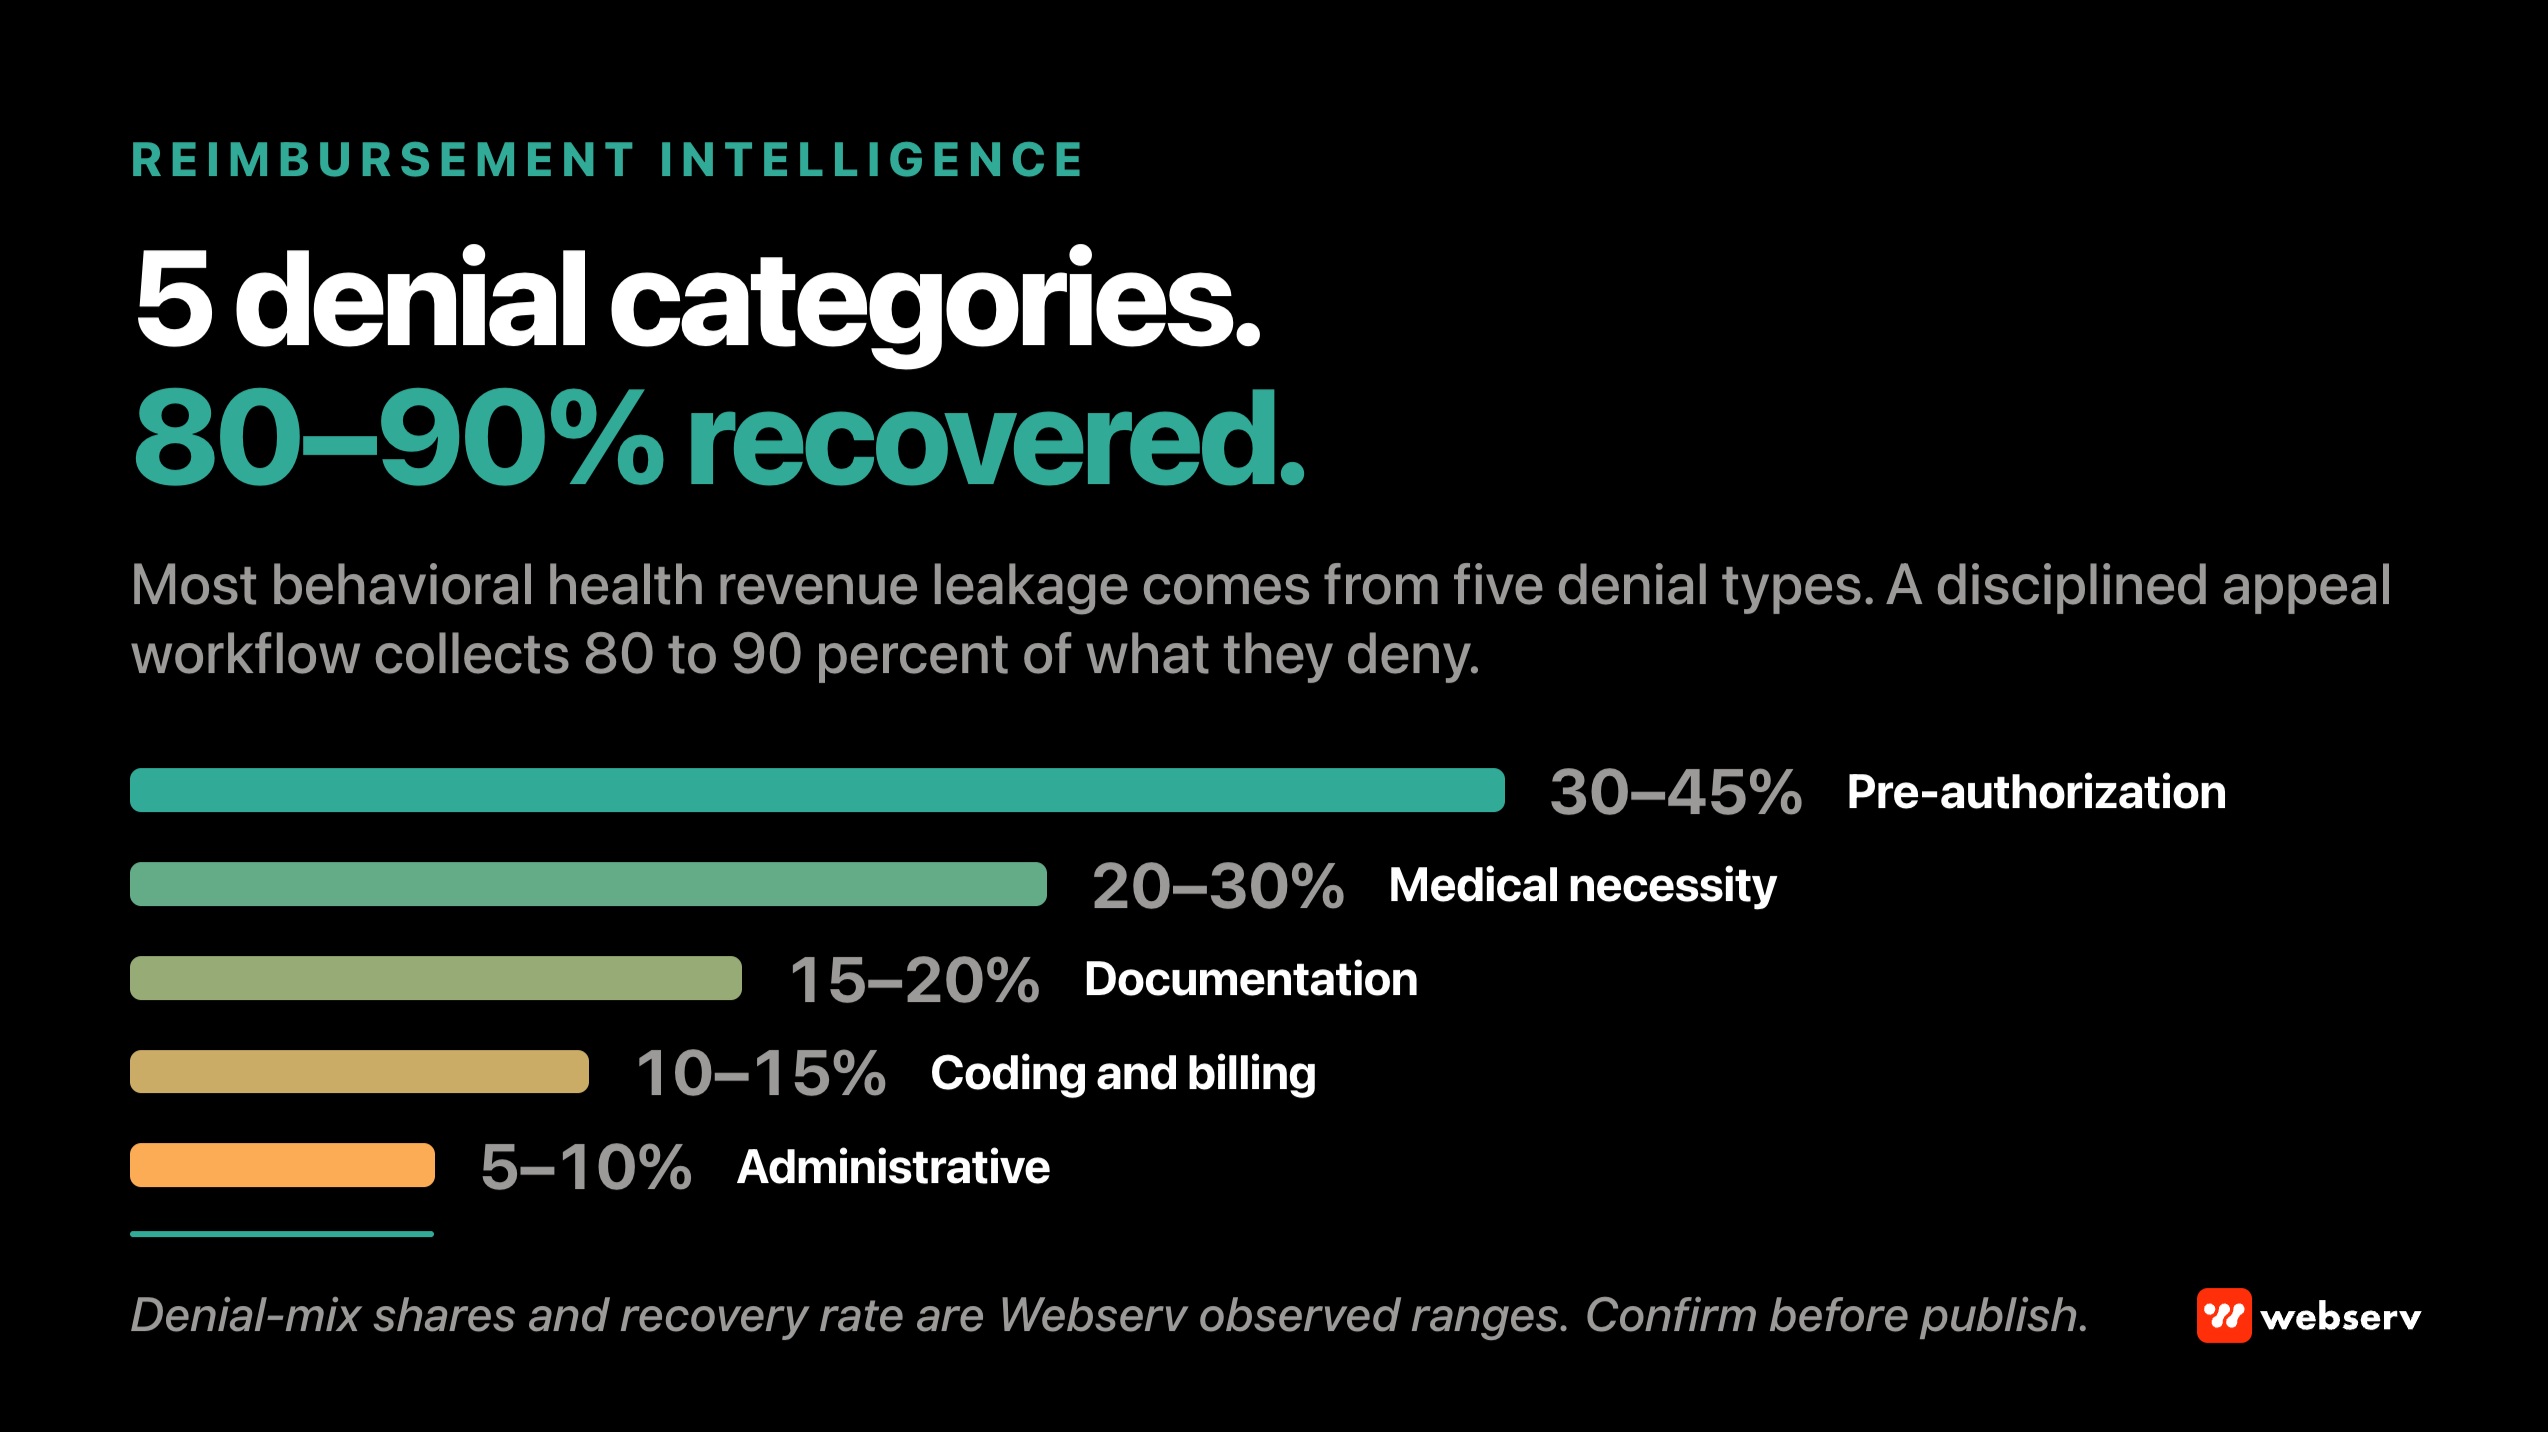
- The five denial categories that produce most BH revenue leakage: pre-authorization denials (30 to 45 percent of denials), medical necessity denials at concurrent review (20 to 30 percent), documentation-insufficient denials (15 to 20 percent), coding and billing denials (10 to 15 percent), and administrative denials (5 to 10 percent).
- Prevention framework reduces initial denial rates by 30 to 50 percent through clinical documentation quality, pre-authorization workflow discipline, concurrent review coordination, and specific coding accuracy. Prevention is meaningfully cheaper than appeals workflow that recovers denied claims.
- Appeal workflow overturns initial denials at 40 to 65 percent depending on payer, denial category, and appeal quality. Appeal timing standards vary by payer (typically 60 to 180 days from denial notice), with some payers requiring specific appeal formats and clinical documentation packages.
- Concurrent review coordination during treatment stay prevents mid-stay denials that force early discharge or length-of-stay reduction. Facilities with weak concurrent review typically produce 15 to 25 percent of admissions with mid-stay LOS reduction denials.
DEFINITION
Denial management for behavioral health treatment centers. The revenue cycle discipline that converts payer resistance into collected revenue. Runs on prevention (clinical documentation quality, pre-authorization workflow discipline, concurrent review coordination, coding QA) that reduces initial denial rates by 30 to 50 percent, an appeal workflow that overturns 40 to 65 percent of the denials that still land, and a measurement layer (initial denial rate, appeal overturn rate, collection rate on initially-denied claims, days to appeal submission, denial category distribution) that isolates denial management from other revenue cycle variables.
Distinct from general accounts receivable management (which handles collectible-but-slow claims, not disputed ones), distinct from pre-admission eligibility verification (which prevents coverage-based denials before treatment), and distinct from claim scrubbing (which catches format errors, not clinical or medical-necessity denials).
OPERATOR INSIGHT
Denials get treated as a downstream problem the billing team solves through appeals rather than as an upstream problem the clinical and admissions teams prevent through documentation quality.
The specific downstream cost: facilities with strong appeals processes still collect meaningfully less than facilities with strong prevention processes, because appeals produce partial collections at best while prevention produces full collections. Denial management runs alongside the pre-admission and admission workflows, not after them — denial patterns get detected during pre-authorization submission and clinical documentation review, before they escalate to full claim denial.
The five denial categories that produce most BH revenue leakage
Five specific denial categories account for most of the revenue leakage we audit across treatment center billing operations. Each category has specific root causes and specific prevention patterns.
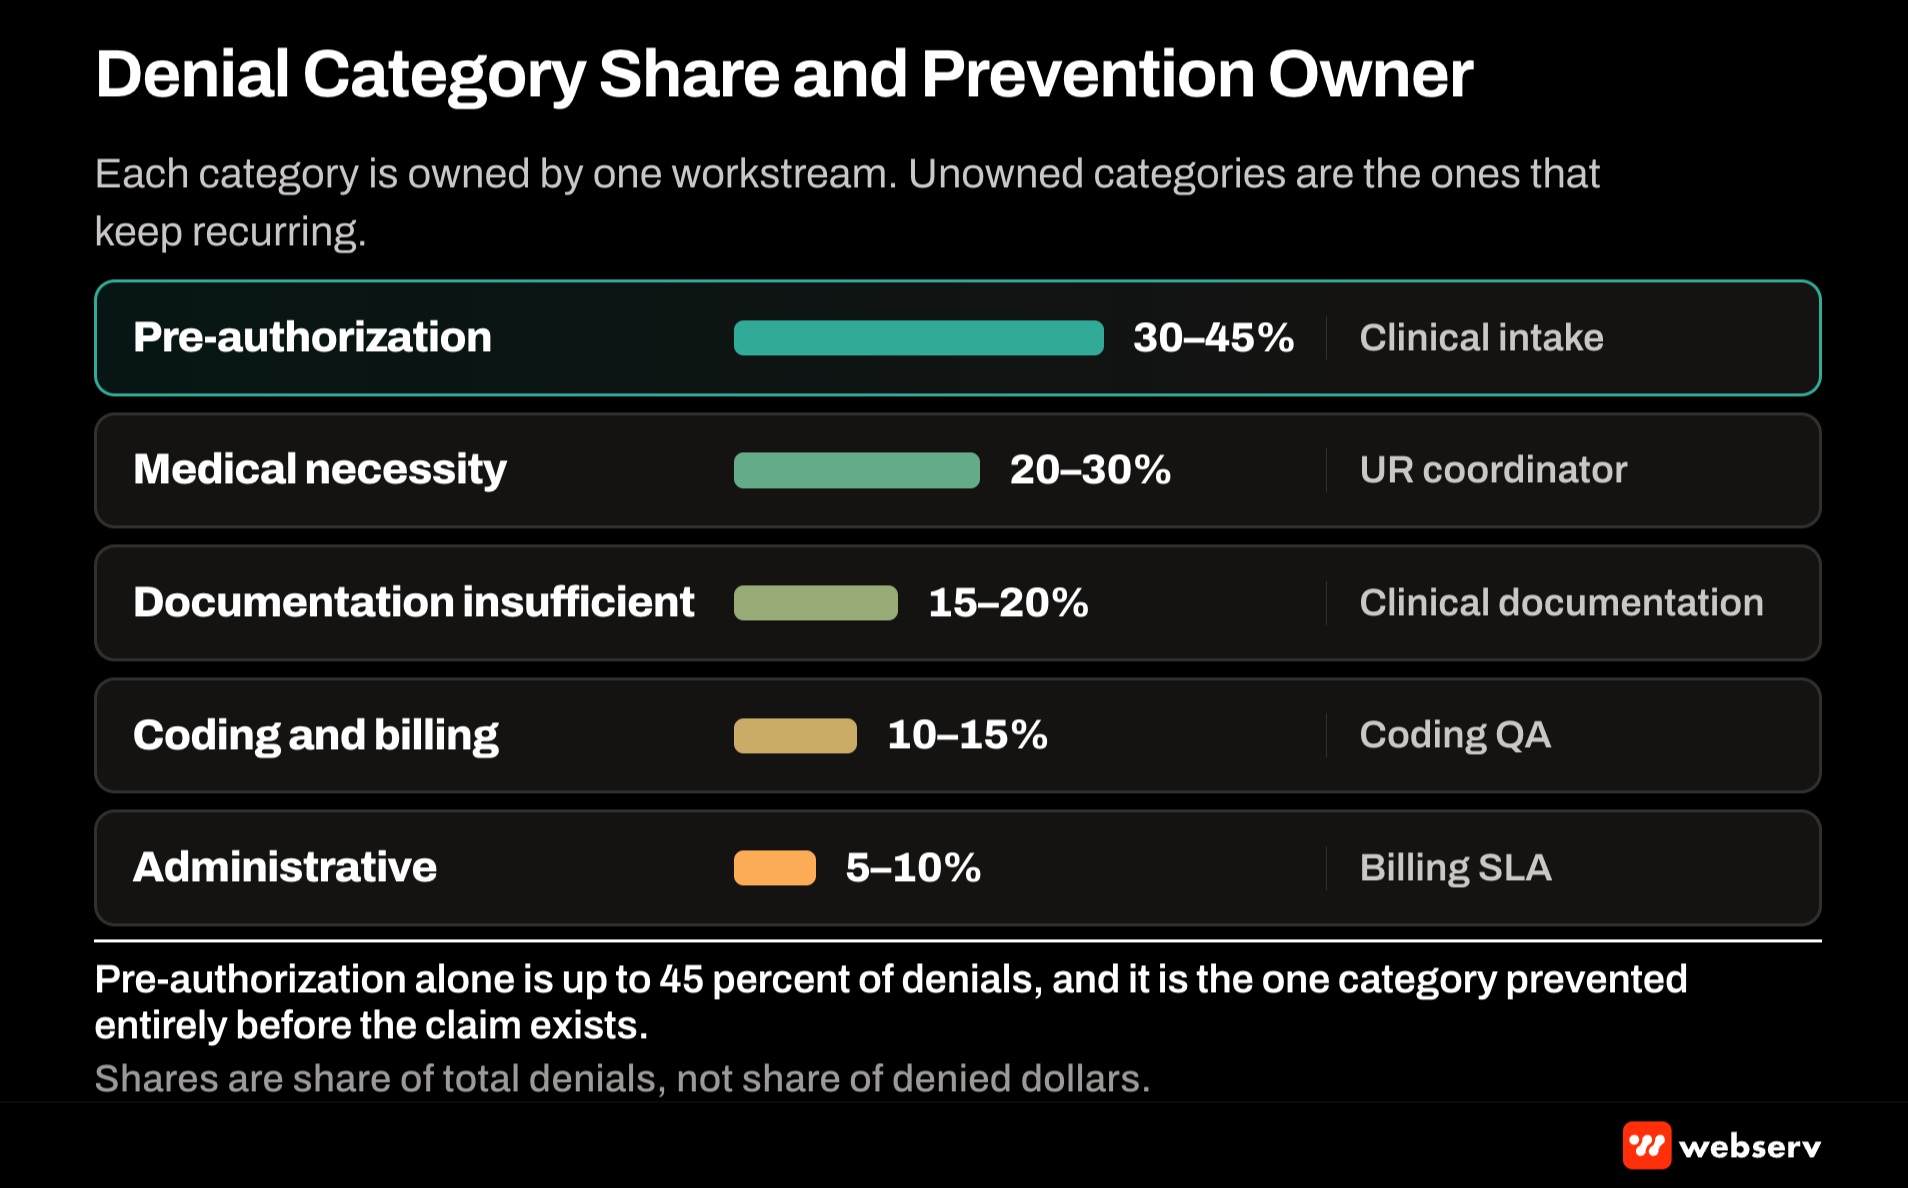
Category 1: Pre-authorization denials (30 to 45 percent of denials)
Denials that happen at pre-authorization stage before treatment begins. Root causes: incomplete clinical documentation supporting the requested level of care, ASAM criteria assessment not aligned to LOC being requested, prior treatment history not documented, or medical necessity not established through the payer’s specific documentation standards.
Prevention: intake clinical assessment produces the specific documentation package payer UM teams require. Documentation aligns to payer-specific medical necessity criteria (BCBS, Aetna, Cigna, UHC all use somewhat different criteria).
Category 2: Medical necessity denials at concurrent review (20 to 30 percent of denials)
Denials that happen during treatment stay when concurrent review determines the patient no longer meets medical necessity for the current level of care.
Root causes: clinical progress notes not documenting continued need for current LOC, treatment plan not updated to reflect current clinical status, or genuinely improved clinical status that supports LOC step-down that facility does not want to implement.
Prevention: concurrent review coordination discipline with clinical team documentation matching what payer UM teams evaluate.
Category 3: Documentation-insufficient denials (15 to 20 percent)
Denials that happen at claim submission because clinical documentation submitted with the claim is insufficient to support the billed services.
Root causes: progress notes missing required elements, treatment plans not signed within required timeframes, or clinical documentation not attached to specific claim submissions.
Prevention: clinical documentation quality standards enforced at the point of clinical service, not at billing.
Category 4: Coding and billing denials (10 to 15 percent)
Denials from incorrect procedure codes, incorrect diagnosis codes, or coding-payer mismatch.
Root causes: coding staff without BH-specific expertise, coding software without BH-specific rule sets, or manual coding processes without quality assurance.
Prevention: BH-specific coding expertise plus coding quality assurance review before claim submission.
Category 5: Administrative denials (5 to 10 percent)
Denials from timely filing violations, missing member information, incorrect billing entity information, or other administrative errors.
Root causes: billing team workflow gaps, claim processing delays, or missing verification data.
Prevention: billing workflow discipline with specific SLAs on claim submission timing, plus verification data completeness at admission.
The denial management program at a glance
80-90%
Collection rate on initially-denied claims for facilities with strong denial management
30-45%
Share of BH denials from pre-authorization — the single biggest category
40-65%
Appeal overturn rate range depending on payer, category, and appeal quality
60-180
Days from denial notice for most payer first-level appeal windows
Prevention framework
The specific prevention framework reduces initial denial rates by 30 to 50 percent through four workstreams.
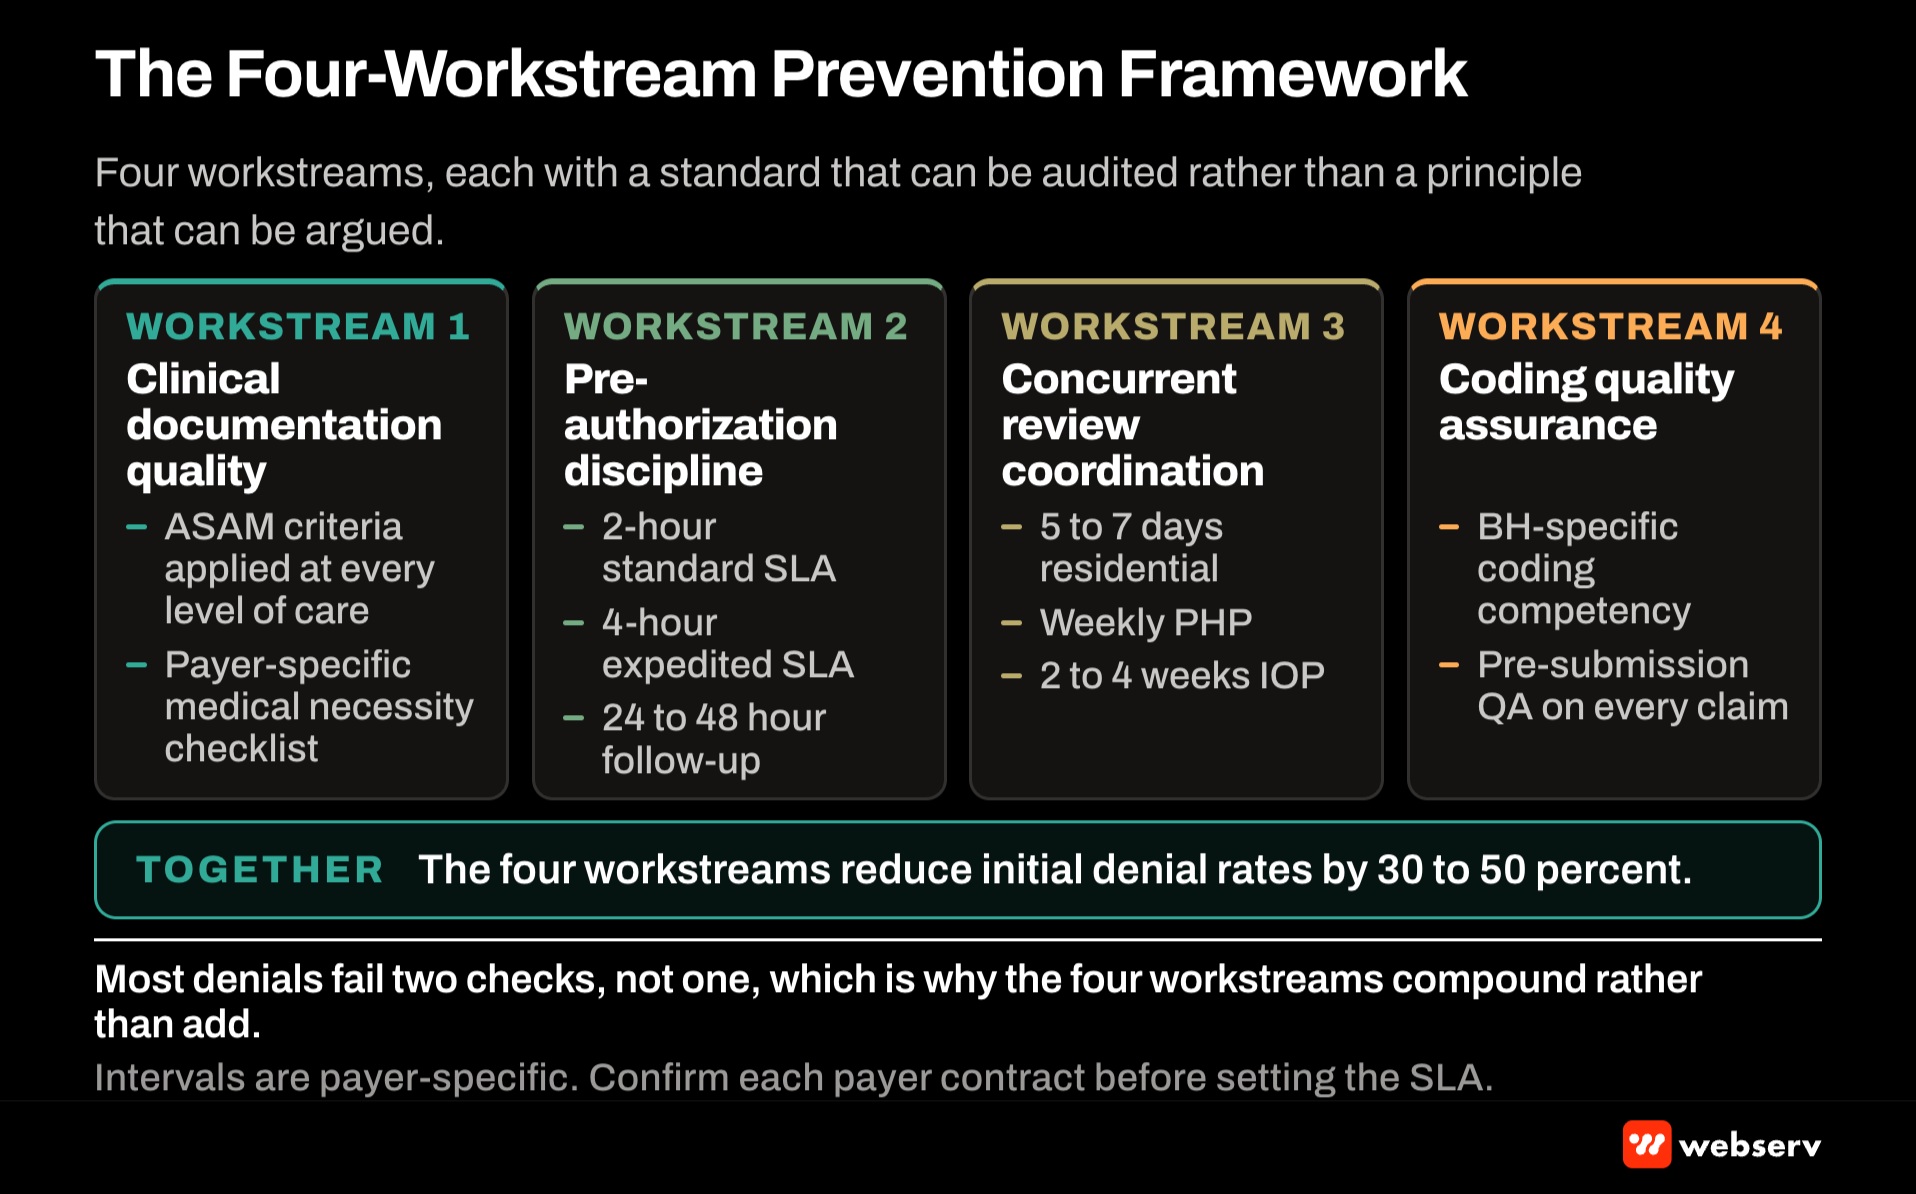
Workstream 1: Clinical documentation quality. Intake clinical assessment produces the specific documentation payer UM teams require. ASAM criteria assessment aligned to requested LOC. DSM-5 diagnosis with specific severity documentation. Prior treatment history when applicable. Current medications and medical clearance for detox or residential.
The specific pattern that works: clinical documentation checklist for each level of care and each payer type. Intake clinician runs the checklist during initial assessment. Missing elements get flagged and completed before pre-authorization submission.
Workstream 2: Pre-authorization workflow discipline. Pre-authorization submitted within 2 hours of clinical assessment completion for standard admissions, within 4 hours for expedited admissions. Documentation package includes the specific payer-required elements.
Follow-up on pre-authorization decisions within 24 to 48 hours. Escalation to payer UM management when initial decision is questioned or delayed.
Workstream 3: Concurrent review coordination. Concurrent review scheduled at payer-required intervals (typically every 5 to 7 days for residential and detox, weekly for PHP, every 2 to 4 weeks for IOP).
Clinical team prepares concurrent review documentation showing continued medical necessity: current progress notes, updated ASAM assessment, treatment plan modifications, medication management updates.
Communication with payer UM team about specific clinical trajectory to reduce surprise denials.
Workstream 4: Coding quality assurance. BH-specific coding expertise applied to claim preparation. Procedure codes matched to actual clinical services delivered. Diagnosis codes aligned to clinical documentation.
Quality assurance review before claim submission catches coding errors that would otherwise produce denials.
The four workstreams together reduce initial denial rates by 30 to 50 percent compared to facilities running only ad-hoc denial handling.
Appeal workflow for initial denials
Appeals overturn initial denials at 40 to 65 percent depending on payer, denial category, and appeal quality. The specific workflow that produces the higher-end recovery rates.
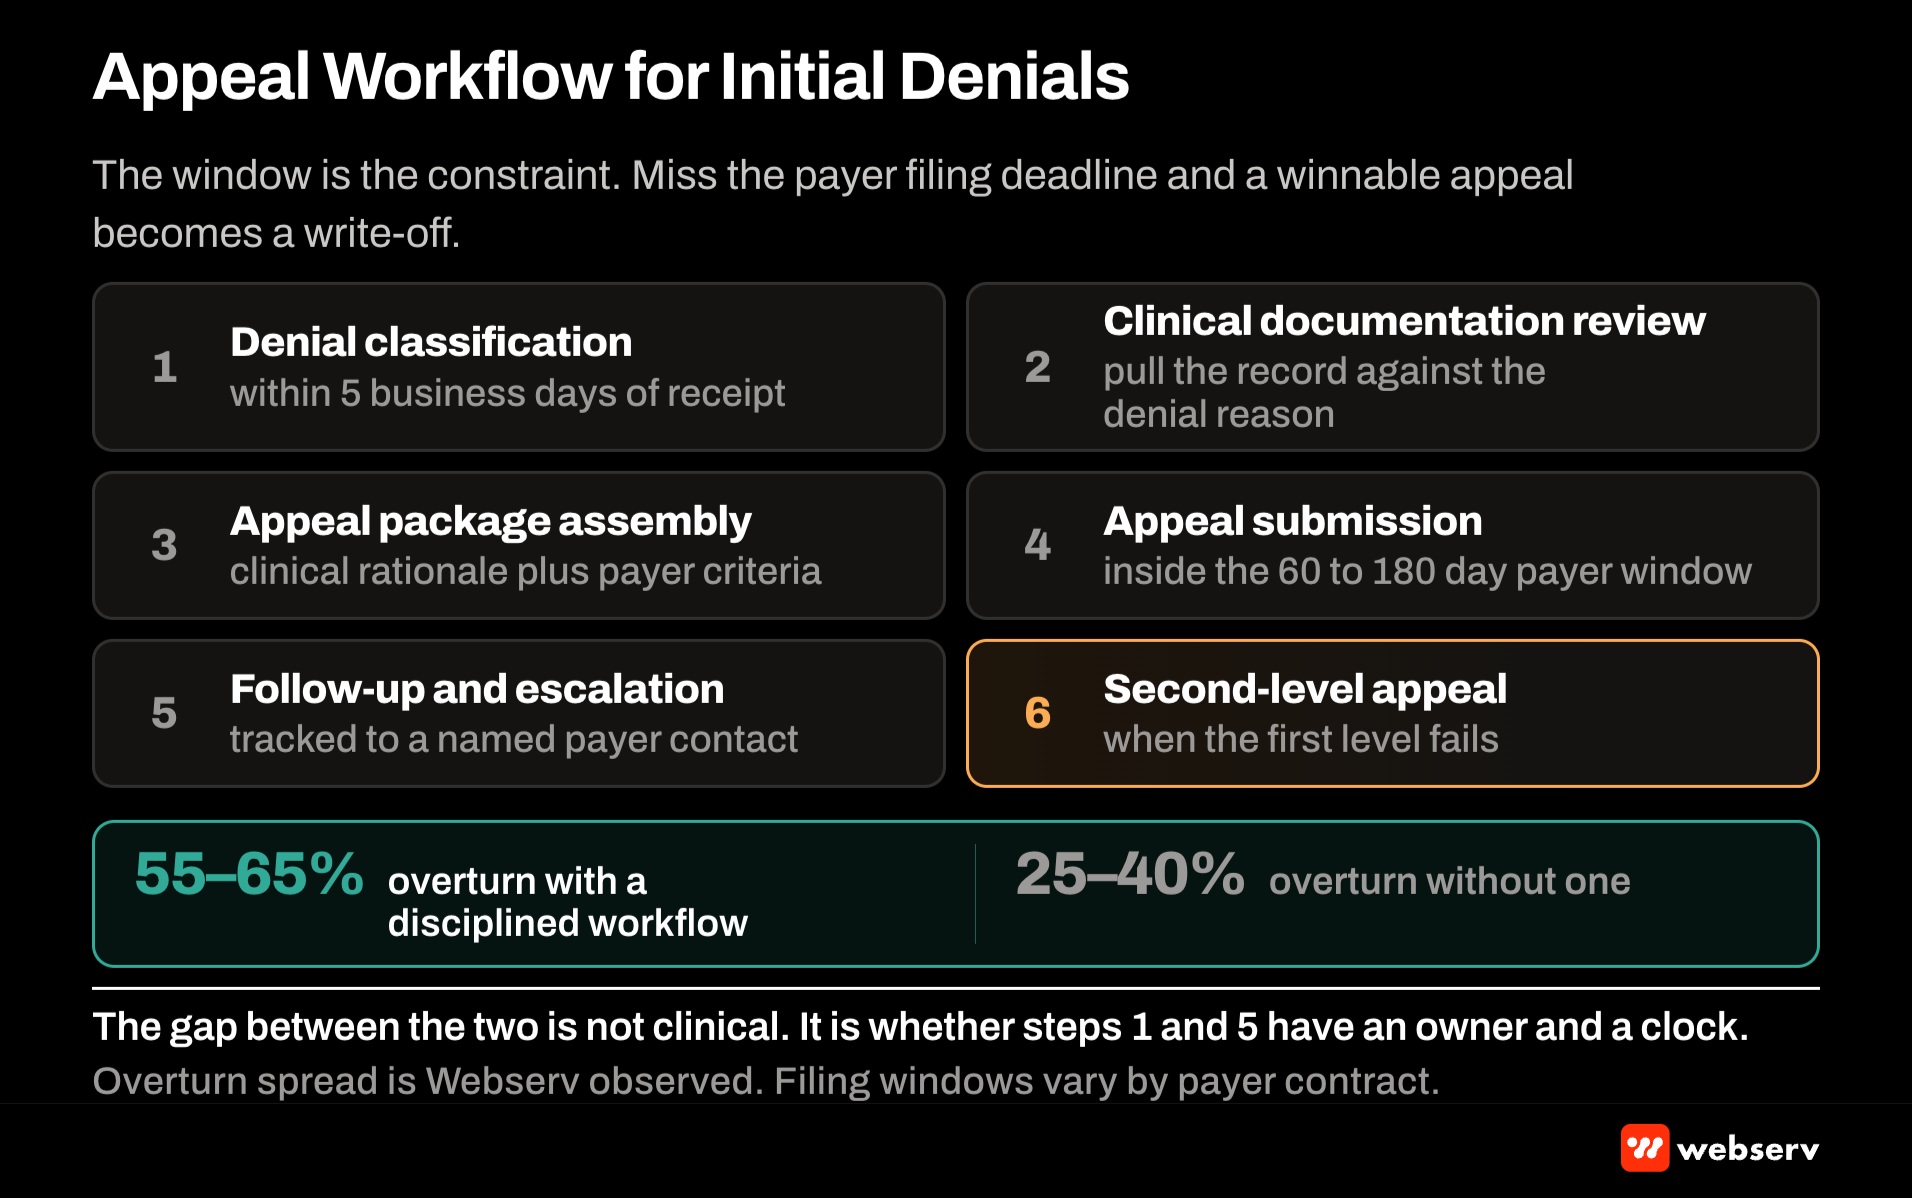
Step 1: Denial classification within 5 business days of denial notice. Categorize each denial into the five categories above. Assign appeal priority based on denial amount, appeal timing window, and probability of overturn.
Step 2: Clinical documentation review for appeal. Pull clinical documentation from the denial episode. Identify specific evidence supporting the appeal position. Document specific payer criteria that the appeal will address.
Step 3: Appeal package assembly. Structured appeal letter with specific payer criteria referenced, clinical documentation attached, and specific requested outcome (full overturn, partial overturn, alternative approval).
Step 4: Appeal submission within payer timing window. Most payers require appeals within 60 to 180 days of denial notice. Some payers require specific appeal formats (formal appeal letter versus reconsideration request versus peer-to-peer review).
Step 5: Appeal follow-up and escalation. Track appeal timelines. Follow up at payer-specific SLA intervals. Escalate to payer UM management or medical director when appeals stall.
Step 6: Second-level appeal when first-level fails. Most payers offer two-level or three-level appeal processes. Second-level appeals typically require additional clinical evidence and often involve external medical review.
Facilities with disciplined appeal workflow typically overturn 55 to 65 percent of initial denials. Facilities without appeal workflow typically overturn 25 to 40 percent.
Timing standards for appeals
Timing standards vary meaningfully by payer and by denial category. Missing timing windows produces time-barred appeals that cannot be recovered.
Payer-specific appeal windows. BCBS commercial plans typically allow 60 to 180 days for first-level appeal. Aetna commercial typically 60 to 90 days. Cigna commercial typically 90 to 180 days. UHC commercial typically 90 to 180 days.
Medicaid managed care plans vary meaningfully by state and by specific MCO. State-level Medicaid typically follows federal minimum timeframes.
Denial category timing considerations. Pre-authorization denials typically have the shortest appeal windows because the denial happens before treatment begins and payers want quick resolution.
Concurrent review denials typically require expedited appeals during ongoing treatment because the denial affects current level of care.
Documentation-insufficient denials sometimes allow supplementation without formal appeal if the documentation is provided within a specific window.
Administrative denials typically have longer windows but also lower overturn rates because the underlying issue is procedural rather than clinical.
Timing tracking pattern. Denial tracking system with denial date, payer-specific appeal deadline, appeal status, and appeal outcome. Facilities without denial tracking typically miss 10 to 25 percent of appeals due to timing violations.
DO
- Run intake clinical documentation against a payer-specific checklist (BCBS, Aetna, Cigna, UHC each have different medical necessity criteria) before pre-authorization submission.
- Schedule concurrent review at payer-required intervals (5-7 days residential/detox, weekly PHP, 2-4 weeks IOP) and prepare updated ASAM + treatment plan documentation for each cycle.
- Classify every denial into one of the 5 categories within 5 business days and prioritize appeal work by dollar amount + timing window + probability of overturn.
- Submit appeals within 14 days of denial notice — appeals filed early consistently produce higher overturn rates than appeals filed near the deadline.
- Request peer-to-peer review when payer UM signals a concurrent-review denial — real-time clinician-to-medical-director discussion overturns more than post-denial written appeals.
DON’T
- Treat denials as a billing-team-only problem — prevention lives at the clinical and admissions layer where documentation quality is set.
- Skip denial tracking — facilities without denial tracking miss 10-25% of appeals to timing violations alone.
- File appeals at the payer deadline — late-filed appeals correlate with meaningfully lower overturn rates than appeals filed inside 14 days.
- Write off denied claims without workflow feedback — the write-off documentation should inform prevention improvements, not just close the ledger entry.
- Ignore concurrent review pressure until the denial lands — mid-stay LOS reduction denials cost 15-25 percent of admits at facilities without proactive UM coordination.
Concurrent review coordination
Concurrent review coordination during active treatment prevents mid-stay denials that force early discharge or LOS reduction.
The specific coordination pattern. Weekly or biweekly clinical documentation review by the facility’s utilization review coordinator. Progress notes evaluated against payer-specific medical necessity criteria.
Communication with payer UM team about clinical trajectory. Documentation updates aligned to payer expectations for continued LOC.
Signals of concurrent review risk. Progress notes showing rapid clinical improvement without documented continued need for current LOC. Treatment plan not updated to reflect current clinical status. Medication changes without documented rationale. Family involvement documentation missing.
Each signal indicates increased denial risk that concurrent review coordination can address.
Concurrent review escalation. When payer UM team signals potential denial, escalate to peer-to-peer review with facility clinician. Peer-to-peer typically produces higher overturn rates than post-denial appeals because the clinical discussion happens in real time.
Facilities with strong concurrent review coordination typically produce 5 to 10 percent mid-stay LOS reduction rates. Facilities without concurrent review coordination typically produce 15 to 25 percent mid-stay LOS reduction rates.
Measurement patterns for denial management performance
The specific measurement patterns that isolate denial management performance from other revenue cycle variables.
Initial denial rate. Percentage of claims initially denied divided by total claims submitted. Target: under 15 percent initial denial rate for well-managed facilities. Above 25 percent initial denial rate signals prevention workflow gaps.
Appeal overturn rate. Percentage of appealed denials that get overturned divided by total appeals submitted. Target: 55 to 65 percent overturn rate for well-managed facilities.
Collection rate on initially-denied claims. Percentage of billed revenue collected on claims that initially face denial. Target: 80 to 90 percent for well-managed facilities.
Days to appeal submission. Average days from denial notice to appeal submission. Target: under 14 days for standard appeals. Longer delays typically correlate with lower overturn rates.
Denial category distribution. Percentage of denials by category. Shifting distribution over time signals workflow improvements or workflow gaps. Increasing pre-authorization denial share typically signals prevention workflow degradation.
Frequently Asked Questions
How much does denial management cost to run at facility level?
Between $80,000 and $250,000 annually for most single-facility treatment center operators, depending on admit volume and payer mix complexity.
The specific breakdown: dedicated denial management staff (typically 1 to 3 FTE at $55,000 to $95,000 loaded cost), clinical documentation review time, appeal preparation time, and technology tools (denial tracking systems, clinical documentation platforms, coding software).
Portfolio operators produce meaningful economies of scale. Per-facility denial management cost typically drops to $50,000 to $150,000 for the second and subsequent facilities in a portfolio because appeal expertise and technology transfer across facilities.
Should we outsource denial management or run it in-house?
Depends on facility scale and internal expertise. Facilities with 50+ monthly admits typically benefit from in-house denial management because the volume supports dedicated staff and internal expertise development.
Facilities with under 30 monthly admits typically benefit from outsourced denial management because volume does not support dedicated staff and outsourced vendors bring specialized expertise.
Hybrid approaches work for facilities in the middle range: in-house team handles pre-authorization and prevention, outsourced vendor handles complex appeals and concurrent review coordination.
How do we improve our appeal overturn rate?
Three specific improvements produce meaningful overturn rate increases. First: clinical documentation quality at the time of clinical service. Better documentation supports stronger appeals.
Second: appeal timing discipline. Appeals submitted within 14 days of denial notice typically produce higher overturn rates than appeals submitted at the deadline.
Third: peer-to-peer review requests when clinical circumstances warrant. Facility clinician discussion with payer medical director often produces overturns that written appeals cannot achieve.
What causes concurrent review denials that pre-authorization did not catch?
Clinical trajectory that differs from what pre-authorization anticipated. Patients who improve faster than expected trigger concurrent review pressure toward LOC step-down. Patients whose complexity was not fully documented at pre-authorization can face concurrent review questions.
The specific prevention pattern: pre-authorization documentation includes anticipated clinical trajectory and specific factors that would extend LOC. Concurrent review documentation updates the trajectory based on actual clinical progress.
Facilities with strong concurrent review coordination typically prevent 60 to 75 percent of the concurrent review denials that facilities without coordination experience.
How does denial management interact with our overall revenue cycle operations?
As the specific quality assurance layer that determines whether admissions convert to collected revenue. Revenue cycle covers the full workflow from patient identification through cash posting. Denial management focuses specifically on the point where claims face payer resistance.
The specific integration: denial data feeds back to prevention workflows. Categories with rising denial rates trigger prevention workflow investigation. Successful appeals inform documentation and coding pattern improvements.
Facilities that separate denial management from prevention workflows typically produce lower overall collection rates than facilities that integrate the two through shared feedback loops.
How does the denial management workflow relate to the pre-admission eligibility verification playbook?
Directly. Pre-admission eligibility verification identifies coverage and pre-authorization requirements. Strong verification produces admissions that are properly authorized, which reduces pre-authorization denials at the back end.
The specific integration pattern: eligibility verification catches issues at the front. Pre-authorization workflow ensures proper approval. Concurrent review maintains approval through treatment. Denial management handles cases where the front-end and mid-stream workflows did not prevent the denial.
Our pre-admission eligibility verification playbook covers the front-end workflow, our VOB vs pre-authorization guide covers the specific pre-auth workflow, and our reimbursement intelligence hub covers the analytical layer that connects denial patterns to revenue outcomes.
What happens if we cannot recover a denied claim through appeals?
Three paths. First: pursue additional appeal levels (most payers offer 2 or 3 appeal levels with different evidence requirements at each level).
Second: pursue external review through state insurance commissioner processes or independent medical review programs where applicable.
Third: write off the claim and update revenue cycle records. Cases that reach write-off should generate documentation that informs prevention workflow improvements. Facilities that maintain disciplined write-off documentation typically identify prevention improvements that reduce future denial rates. Facilities that treat write-offs as accounting entries without workflow feedback typically repeat the denial patterns.
Kyle McHenry is the founder of Revenue Logic and co-founder of PayerLenz and Webserv. His work focuses on the reimbursement intelligence and eligibility workflows that treatment center admissions and billing teams run.