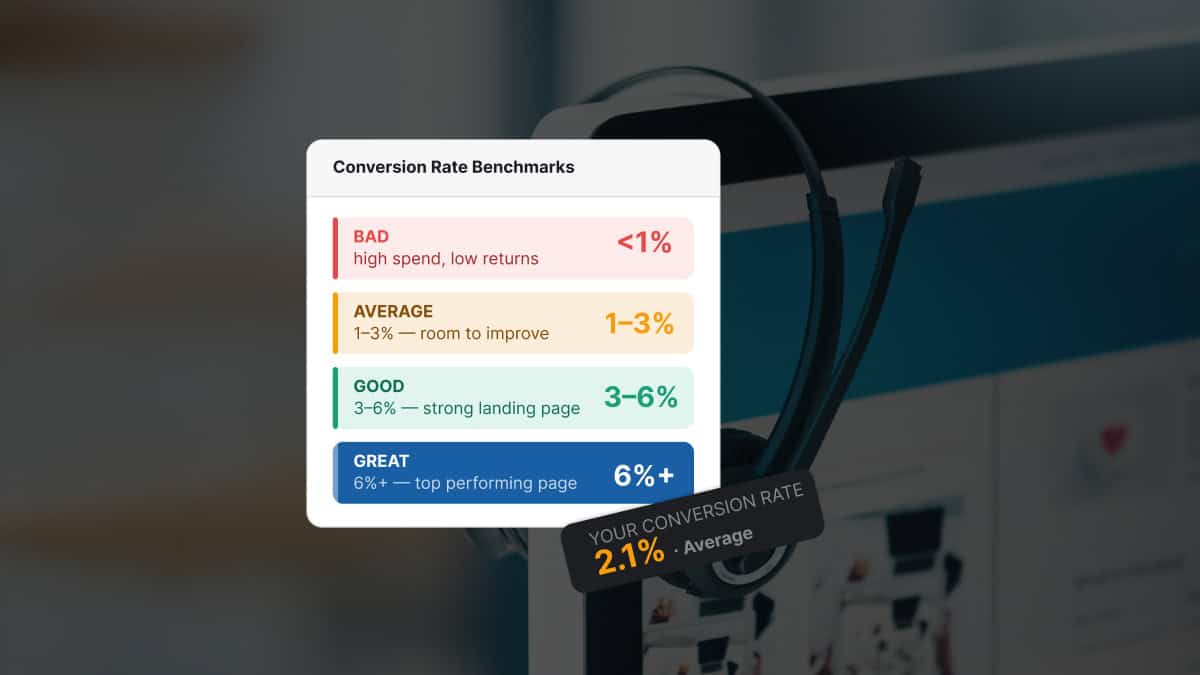
A good conversion rate for a drug rehab landing page is 8% to 12% on paid search traffic and 4% to 7% on paid social traffic. Below those ranges, the page is leaving admissions calls on the table. Above them, the page is doing the conversion work the media spend is paying for.
The healthcare-wide median for paid landing pages is 4.2%.
Treatment center pages should be running well above the healthcare average for three reasons. Visitor intent is higher (someone searching “alcohol rehab near me” is much further along the decision path than someone searching for a general physician). The call CTA is the right primary action for crisis traffic. And the conversion event is a phone call rather than a multi-step ecommerce checkout.
Most treatment center landing pages convert at 2% to 3%. The benchmark we see across well-built rehab pages on Webserv-managed accounts is 8% to 12% on paid search. The 2x to 5x gap is almost always a landing page problem, not a traffic problem.
Mitch Marowitz, Director of Paid Admissions, Webserv
Key Takeaways
- Working benchmarks for a well-built rehab landing page in 2026: 8-12% on paid search, 4-7% on paid social, 6-10% on organic, 12-20% on direct. The same page across traffic sources will converge if the targeting or the page is over-broad and under-tuned.
- Benchmarks vary by program type too. OON detox/residential: 6-10%. INN local outpatient: 8-14%. Population-specific (veteran, adolescent, executive) on a matched-population page: 10-16%. Mental health or dual diagnosis: 5-9%.
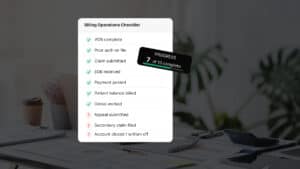
- Three different conversion definitions are in use: initial (call + form), qualified (admissions-screened), and admit (verified-policy through to admission). Each is roughly half the previous. A 10% initial → 5% qualified → 1-2% admit conversion rate is the typical full-funnel decay.
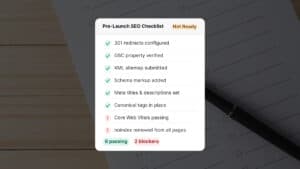
- Seven highest-impact fixes, ordered by lift: sticky mobile call button, confidentiality assurance above the fold, mobile page speed (LCP <2.0s), specific hero rewrite, trust signal stack above the fold, three-field form, real facility imagery. First three usually account for the largest share of the lift.
- Cost per private-policy VOB and cost per admit by landing page matter more than initial conversion rate. A 6% page producing $1,800 cost per VOB beats a 10% page producing $4,500 cost per VOB every time. The full funnel is the picture.
This article is the operator-facing version of how we think about conversion rate benchmarks for rehab landing pages. It covers the right numbers by traffic source, by program type, what “conversion” actually means in this category, why most pages underconvert, and the seven highest-impact fixes that close the gap.
The short answer, in numbers
For a treatment center landing page in 2026, the working benchmarks are:
| Traffic source | Working benchmark | Underperforming below |
|---|---|---|
| Paid search | 8% to 12% (call + form) | Below 6% is underperforming. Below 4% is broken. |
| Paid social | 4% to 7% | Below 3% is underperforming. |
| Organic search | 6% to 10% | Below 4% is underperforming. |
| Direct | 12% to 20% | Direct should be the highest conversion rate in your mix. |
These ranges apply to a well-built landing page. The same media buy routed to a poorly built landing page produces materially lower conversion across every traffic source. The gap between a good page and a mediocre one is usually 2x to 3x. The gap between a good page and a broken one is 5x to 10x.
Why benchmarks vary by traffic source
Visitor intent shapes conversion rate more than any design decision. A page that converts at 12% on paid search traffic might convert at 3% on paid social traffic and 1% on display traffic. Same page. Different visitors. Different intent. Different outcomes.
Paid search visitors typed the query. They are actively looking for the thing the page sells. A family member who searched “alcohol detox Texas in network” arrived on the page because they have a specific problem and a specific decision to make. The conversion rate is high because the visitor selected themselves into the audience.
Paid social visitors did not search. They were reached. Meta showed them an ad inside a feed they were scrolling for other reasons. The visitor may be relevant (the targeting put them there) but their intent at the moment of the click is lower than a search visitor’s intent. The conversion rate is correspondingly lower.
Direct visitors typed the URL or clicked a referral. They came with the highest intent. The conversion rate ceiling for direct traffic is well above paid traffic because the visitor is closer to the decision.
If your conversion rate is flat across traffic sources, the targeting or the landing page is over-broad and under-tuned. A page that converts the same on paid social as on paid search is usually a page that is built generically for both audiences and optimized for neither.
Benchmarks by program type
Conversion rates also vary by program type because the family member’s qualifying questions vary. The benchmarks for a well-built page within each program type:
| Program type | Working benchmark | Notes |
|---|---|---|
| Out-of-network detox or residential | 6% to 10% | OON families have insurance verification anxiety before they call. Pages that surface “out-of-network coverage accepted, free verification” prominently convert. Pages that hide the insurance signal underconvert even with strong design. |
| In-network local outpatient | 8% to 14% | INN outpatient visitors have higher intent because they are typically further down the decision path (already insured, already in market). Pages benefit from a tighter geographic match between ad and landing page than OON campaigns. |
| Population-specific (veteran, adolescent, executive) | 10% to 16% when matched | Generic pages addressed to population-specific campaigns underconvert at 3% to 5%. Matched-population pages are one of the highest-impact variants an operator can build. |
| Mental health or dual diagnosis | 5% to 9% | Lower than SUD-specific pages because the search and social intent in mental health is more diffuse. Pages targeting depression, anxiety, or eating disorders specifically perform better than broad “mental health treatment” pages. |
The variance between program types matters because operators reporting “our landing page converts at 5%” without breaking out program type may be averaging a 12% OON detox page with a 2% generic mental health page.
The averaged metric tells the operator the page is fine. The unaveraged data shows where the conversion work needs to happen.
What counts as a conversion
The conversion rate measurement is only useful if everyone agrees on the definition. Three different definitions are in common use, and they produce three different numbers.
Initial conversion (call or form submit). The most common definition. Includes any inbound call or form submission attributed to the landing page. Easy to measure with CallRail or CallTrackingMetrics on calls and standard form tracking on submissions. This is what the 8% to 12% paid search benchmark refers to. The full setup pattern for the call-tracking side is in our CallRail setup guide for addiction treatment marketing.
Qualified conversion (admissions-team-screened). Includes only the calls and forms that the admissions team screened as qualified leads (right population, right insurance type, right location, right level of care need). Drops the conversion rate by roughly half. A 10% initial conversion rate becomes a 5% qualified conversion rate at most operators.
Admit conversion (verified policy and clinical fit through to admission). Includes only the leads that became admits. Drops the conversion rate further to 1% to 2% on most pages. The most honest metric. Also the slowest to measure because admit timing extends 30 to 90 days after the original visit. The intermediate step (verified policy) is in our verification of benefits explainer.
For most operators, the right primary metric is initial conversion at the landing page level (because it isolates the page’s contribution), with qualified conversion and admit conversion tracked separately as the downstream funnel metrics.
The mistake operators make is reporting initial conversion only and treating it as the whole picture. A page that produces 12% initial conversion and 0.5% admit conversion is a page that is producing high lead volume of the wrong leads. A page that produces 8% initial conversion and 2.5% admit conversion is a better page even though the initial number is lower. The full attribution architecture is in our conversion tracking guide for addiction treatment Google Ads.
Why most treatment center landing pages underconvert
The conversion rate gap between a well-built rehab landing page and the average rehab landing page is large because the average page is missing several specific elements. The most common missing elements, in order of conversion-rate impact:
The call button is below the fold. The family member in crisis taps the first call button they see. If the call button is below the hero, half the conversion event is lost before the visitor scrolls.
The confidentiality assurance is not above the fold. Family members hesitate to call because they assume the call is not confidential. Saying so above the fold removes the hesitation. Most rehab landing pages bury this in a footer paragraph.
The page is slow on mobile. Per Google’s Core Web Vitals LCP guidance, Largest Contentful Paint above 4 seconds on mobile loses 25% to 40% of the inbound traffic before the page renders. Most rehab landing pages were designed in desktop browsers and have never been tested on a mid-tier Android phone over LTE.
The hero is generic. “Compassionate, individualized addiction treatment” is interchangeable with the next forty rehab pages the family member has seen. The hero needs to be specific to the facility’s actual positioning. Generic hero copy converts at half the rate of specific hero copy.
The trust signals are buried. Joint Commission accreditation, named medical director credentials, and accepted insurance information often sit below the fold on rehab landing pages. They should be above the fold because they answer the family member’s gating question about clinical legitimacy.
The form is too long. Eight-field forms with insurance, location, condition, and urgency questions convert at half the rate of three-field forms that capture name, phone, and contact time. The qualifying questions belong on the callback, not on the form.
The stock imagery is shared with every other rehab page. The hands-in-a-circle, the silhouette-on-the-beach, the generic clinical setting. The visitor has seen the same imagery on every other rehab page they have visited. Real facility imagery is a differentiator. The same authenticity discipline drives creative performance on the paid social side.
Each one of these is a fixable problem. Most operators can audit their own pages against the seven-item list above and identify three or four that apply. Fixing all of them typically takes a 30-day sprint and produces a 2x conversion rate lift.
The numbers agencies quote you mean very different things depending on payer mix.
Before you benchmark your performance or compare quotes from other agencies, read this. Real data from real OON treatment center campaigns with no cherry-picked numbers.
Read the report → Free and ungatedThe seven highest-impact fixes
Ordered by impact. The first three usually account for the largest share of the conversion-rate lift.
1. Add a sticky call button. A floating call button on mobile that stays visible during scroll. The call button is a single line of code or a theme-builder element on most platforms. It produces a 30% to 60% conversion rate lift on mobile traffic, by itself.
2. Move the confidentiality assurance above the fold. The five-sentence framing we recommend: “Your call is 100% confidential. We do not contact your employer, your insurance company, or any family member without your explicit permission. Our admissions counselors are clinicians, not salespeople. The conversation is private and at no obligation.” Above the fold or in the first visible section.
3. Fix mobile page speed. Largest Contentful Paint under 2.0 seconds on mobile. The 2026 Core Web Vitals “Good” threshold dropped from 2.5 to 2.0 seconds. The fixes are image optimization, CDN delivery, font preloading, and removing render-blocking scripts from the critical path. See Google’s Core Web Vitals overview for the full metric set.
4. Rewrite the hero to be specific. The unique selling proposition has to be specific to the facility. Population, level of care, accreditations, payer contracts. “Veteran-built residential program in Texas with TRICARE West and VA CCN Region 1 coverage” outconverts “Compassionate, individualized addiction treatment” at every tier. The headline-language patterns connect to our compliant ad headlines guide.
5. Move the trust signal stack above the fold. Joint Commission seal, named medical director with credentials, accepted insurance list. The trust signals answer the family member’s gating question about clinical legitimacy before they call.
6. Compress the form. Three fields: name, phone, preferred contact time. Qualifying questions move to the callback. Multi-step forms with a single qualifying question on step 2 convert higher than single-step forms with the same content.
7. Replace stock imagery with real facility photos. A 30-minute phone-shot of the actual facility produces stronger conversion than studio-grade stock. Bedrooms, common areas, clinical team in real settings. The authenticity cues differentiate the page from every other rehab page in the category.
The order matters. Operators who start with the imagery refresh and skip the sticky call button leave the largest gain on the table. The fixes compound when run in sequence, but each one produces measurable lift independently.
Metrics that matter beyond conversion rate
Conversion rate at the landing page level is the primary metric, but two downstream metrics matter as much for measuring whether the page is doing the right work:
Cost per private-policy VOB by landing page. The downstream truth. A landing page that produces a 10% initial conversion rate with a $4,500 cost per VOB is worse than a page that produces a 6% initial conversion rate with a $1,800 cost per VOB. The second page is converting fewer visitors but converting the right ones.
Cost per admit by landing page. Even further downstream. The metric that aligns directly with operator revenue. Most operators do not track cost per admit at the landing page level because the attribution chain is hard to maintain through admissions software. The operators who do build the attribution have a meaningful advantage over the ones who do not.
The right operator-facing report shows conversion rate at the landing page level alongside cost per VOB and cost per admit. The full funnel is the picture. The conversion rate by itself is half the story.
How to actually improve conversion rate
The conversion rate is the result of dozens of small design and copy decisions, each of which can be tested and improved. Static benchmarks understate the role of ongoing optimization. The operators who consistently outperform on conversion rate run a continuous testing program rather than building the page once and leaving it.
A reasonable cadence: a major refresh of the hero, the trust signals, and the call-to-action every six months. Two to three smaller A/B tests per quarter. Annual technical audit of mobile speed and Core Web Vitals. Monthly review of conversion rate by traffic source and by population segment to surface drift before it becomes a problem.
The work compounds. A page that improved from 4% to 6% in Q1 and 6% to 8% in Q2 is producing twice the admissions calls on the same media spend by Q3. That is the compounding return on a landing page program done well.
Operators who never touch the page after launch tend to see conversion rate erode rather than improve. Creative fatigue applies to landing pages too. The page that worked in 2022 stops working in 2026 because mobile behavior shifted, family member expectations evolved, competitor pages improved, and the page got passed by while staying static. The same dynamic is what we built our creative capability around — ongoing pipeline rather than one-off launches.
Frequently asked questions about rehab landing page conversion rates
What conversion rate should we expect on branded traffic versus non-branded?
Branded traffic on a treatment center landing page typically converts at 18 to 30 percent, sometimes higher. Non-branded paid search traffic on the same page converts at 8 to 12 percent. Non-branded paid social converts at 4 to 7 percent. The variance is intent, not page quality: a visitor who searched your facility by name already decided to call before they clicked.
The implication is that branded conversion rate is a poor proxy for landing page quality. A page can convert at 25 percent on branded and 3 percent on non-branded simultaneously, which means the page works for visitors who already trust the facility and fails for visitors who do not. Most operators measuring blended conversion rate miss this distinction.
The metric to optimize is non-branded conversion rate, broken out by traffic source. That is the number that measures whether the landing page is doing real conversion work versus capturing demand that would have converted on any page.
How fast can we move conversion rate from 3 percent to 8 percent?
Most treatment centers can move from a 3 percent baseline to an 8 percent landing page in 60 to 90 days when the optimization work addresses structural issues rather than cosmetic ones. The first 30 days are typically diagnostic and high-impact fixes (mobile-first redesign, sticky call button, confidentiality framing above the fold). Days 30 to 90 produce the compounding optimization across trust signals, copy, form design, and page speed.
The fastest wins come from fixing the most expensive single friction first. A mobile page-speed fix can lift conversion 30 to 50 percent in the first week. A click-to-call placement fix can lift call volume 20 to 40 percent in the same window. Stacked across the trust signal stack, the cumulative lift typically reaches 2x to 3x in 90 days.
Programs that take 6 months or more to see a 2x lift usually have a structural problem the optimization did not address. Either the diagnostic missed something foundational (HIPAA tracking, real conversion event definition, audience-page mismatch) or the operator slow-rolled the work. The right pace is fast diagnosis, fast first-fix shipping, and continuous testing past the first lift.
Should we benchmark against industry average or against our own historical?
Both, with different purposes. Industry benchmarks tell you whether the page is competitive in the category. Historical benchmarks tell you whether the page is improving over time. A page converting at 6 percent is below industry top quartile (8 to 12 percent) but above the median (4.2 percent), and whether that is good or bad depends on where it was 90 days ago.
The benchmark that matters most operationally is cost per private-policy VOB, not raw conversion rate. A landing page converting at 10 percent on low-value Marketplace policy traffic costs more per qualified admit than a page converting at 6 percent on private-policy traffic. The conversion rate is an input; the qualified VOB cost is the outcome.
We track all three for clients (industry benchmark, historical baseline, cost per private-policy VOB) and use them in combination. Industry benchmarks frame the ambition. Historical baselines frame the progress. Cost per private-policy VOB frames whether the work translates to admits.
What conversion rate should we expect on organic traffic versus paid?
Organic traffic typically converts at 10 to 18 percent on a well-built treatment center page versus the 8 to 12 percent for paid search and 4 to 7 percent for paid social. The variance is intent depth: organic visitors typically arrive after more research and pre-qualification than paid social visitors, so they convert at a higher rate on the same page.
The implication for landing page design is that the same page does not have to serve all three traffic sources equally. A page optimized for paid social (heavier on confidentiality framing, faster click-to-call, lower information density) can be different from a page optimized for organic (heavier on educational content, deeper trust signal stack, expanded clinical leadership detail). Most operators serve all three with one page and underconvert on at least two of them.
The fix is segmented landing pages: at minimum one for paid search, one for paid social, one for organic. The operational cost is higher (more pages to maintain, more testing surface). The conversion lift is usually 30 to 60 percent across the affected traffic versus a single shared page.
Is conversion rate the right metric, or should we use cost per VOB instead?
Cost per private-policy VOB is the better operational metric. Conversion rate is useful as a diagnostic for the page itself, but it does not measure whether the page is producing the right kind of conversion. A page can have a high conversion rate on form fills from non-monetizable policies and still produce zero admits.
The right measurement stack is conversion rate by traffic source (page-level diagnostic), conversion rate to qualified VOB (lead quality diagnostic), and cost per qualified VOB by landing page (outcome diagnostic). The first two are intermediate metrics. The third is the metric the program is actually optimizing against.
Most treatment center landing page optimization programs we audit measure only conversion rate. The result is incremental lifts on a metric that does not correlate strongly with admits. Operators who measure cost per qualified VOB at the landing page level see meaningfully different optimization decisions than operators who do not, and the decisions correlate with actual census growth.
What this means for treatment center operators
The right conversion rate benchmark for a drug rehab landing page is 8% to 12% on paid search and 4% to 7% on paid social. Operators below those ranges have a landing page problem. The fix is concrete, the work is known, and the lift compounds against the media spend that is already running.
If your current paid media account is producing a 3% landing page conversion rate, doubling it to 6% cuts the cost per admit roughly in half without changing the media budget.
If your current account is at 5% and the benchmark is 10%, the upside is 2x admits at the same cost. The math on landing page work in this category is more favorable than the math on most other paid media improvements.
If you want to know where your current pages sit against the benchmarks, book a discovery call. We will run the landing page audit, measure conversion rate by traffic source and segment, and tell you honestly where the leaks are. The audit is free. The honest answer is the deliverable, not the pitch.
The perspective in this article comes from 9 years working exclusively inside behavioral health.
We are a team built by people in recovery who understand that behind every admission is someone asking for help. If that resonates, get to know us.
Mitch Marowitz is the Director of Paid Admissions at Webserv. Webserv works with behavioral health and addiction treatment centers on paid media, performance creative, SEO, and full-funnel admissions strategy.