Most treatment centers stay with an underperforming billing partner for two to three years longer than they should. The reasons operators give me when they finally make the switch are consistent.
Fear of the migration. A long relationship with the account manager. The assumption that all BH billing operations run more or less the same way. The general belief that “it can’t be that different somewhere else.”
What operators rarely quantify before they switch is the cost of staying.
A billing partner losing 3 to 8 percent of realizable revenue to preventable denials, missed underpayments, and delayed collections costs a mid-size treatment center (roughly 150 admits per month) somewhere between $80,000 and $220,000 per month in unrealized revenue.
Over two or three years of hesitation, that is $2M to $8M left on the table. Recovery is possible during that window. Recovery on cases that have hit timely filing limits or fallen out of the payer’s appeal window is not.
The $1.36M in missed payments we surfaced across 23,000 claims using PayerLenz’s claims data pool is not an unusual result. It is a representative result at operating scale.
Facilities with mature RCM partners recover most of that revenue quarterly. Facilities without recover almost none of it. The gap is where the switching-cost math actually lives.
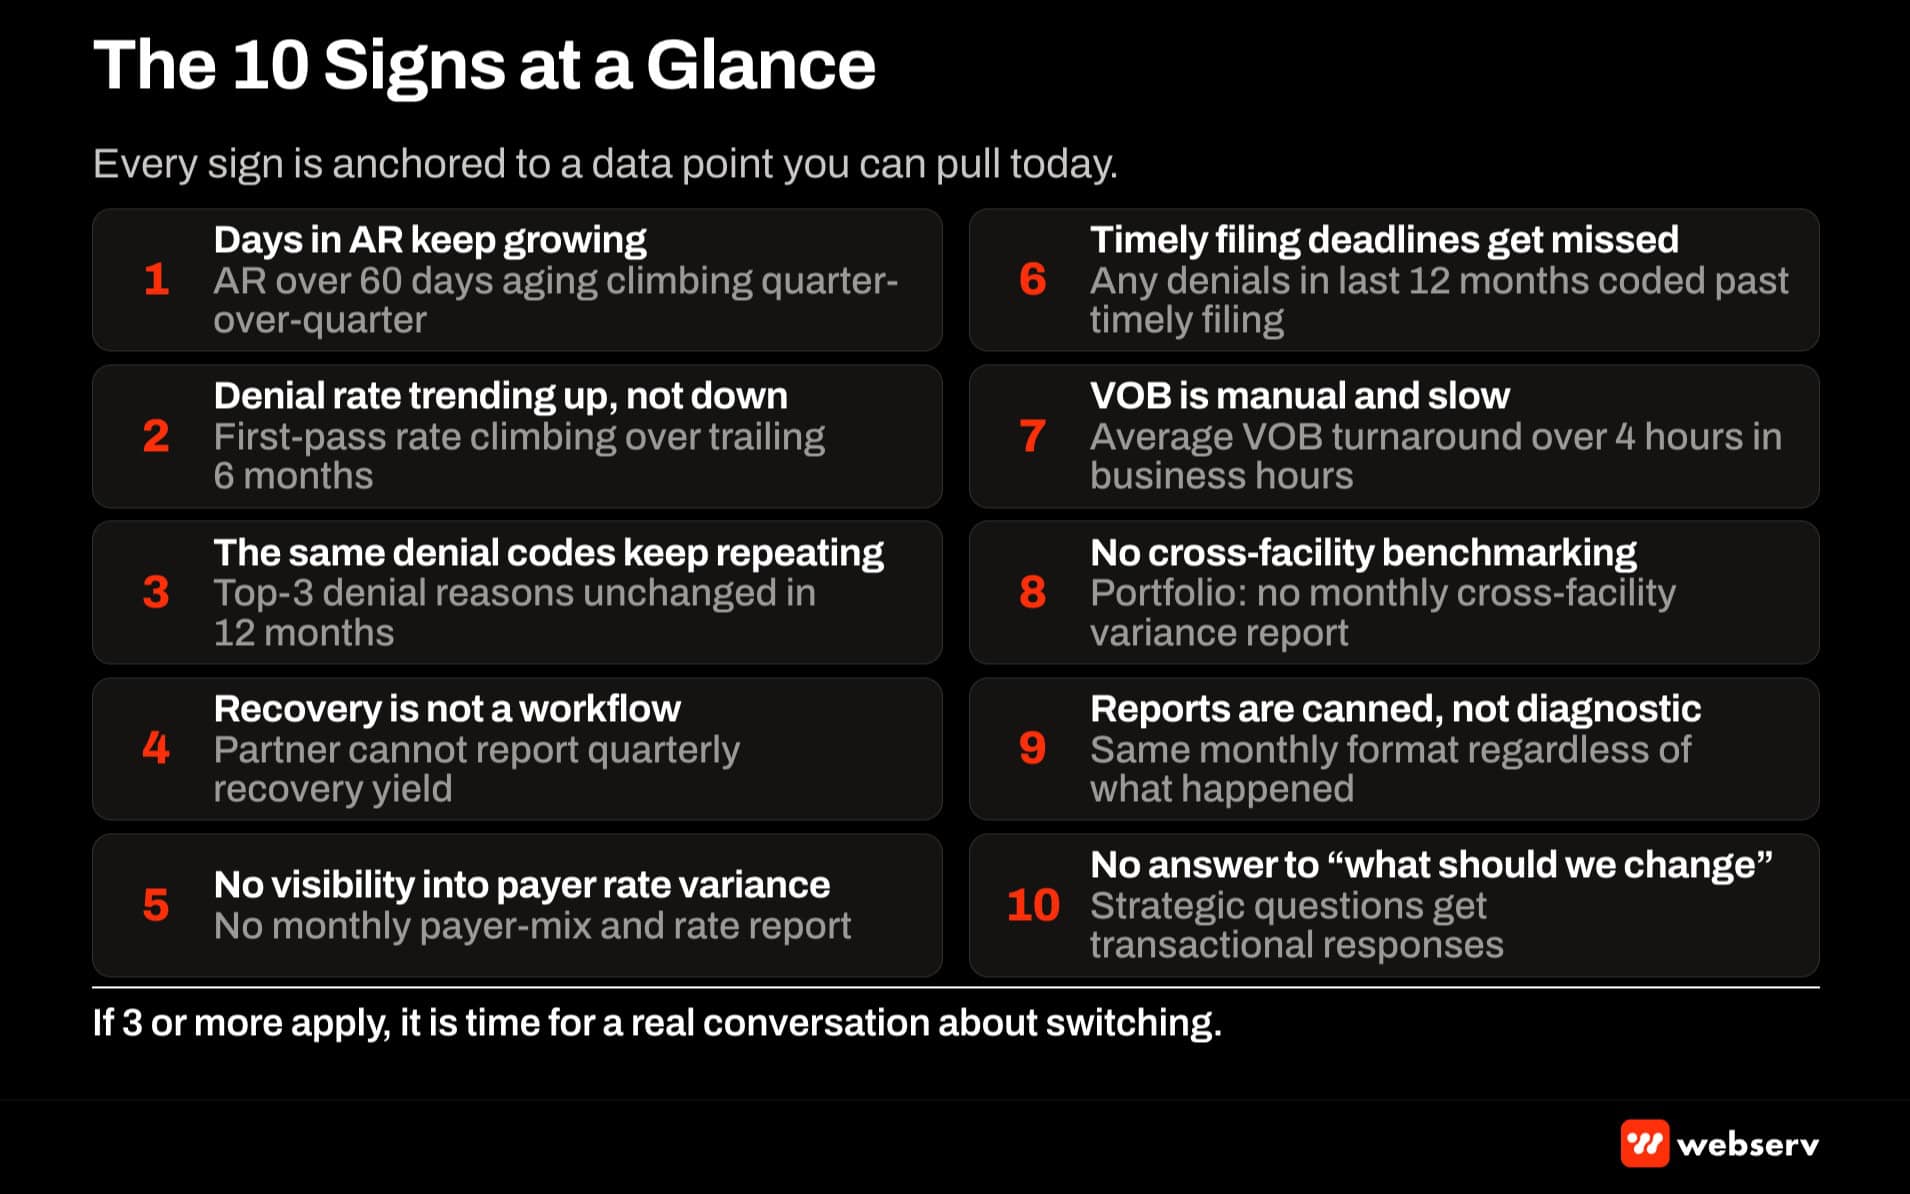
This piece is the diagnostic I use when a treatment center CFO or VP of Revenue Cycle asks me how to evaluate whether their billing partner is underperforming. It walks 10 signs, each anchored to data the operator can pull from their current billing platform today.
If more than three of these apply, it is worth a real conversation about your options. Not a switching decision yet. Just an honest look at what your current data is telling you.
The framework complements our reimbursement intelligence hub guide that covers the operational discipline layer.
Key Takeaways
- Treatment center CFOs and VPs of Revenue Cycle underestimate the cost of staying with an underperforming billing partner. A partner losing 3 to 8 percent of realizable revenue costs a mid-size facility $80,000 to $220,000 per month in unrealized revenue. Over the 2 to 3 years operators typically hesitate before switching, that compounds into $2M to $8M left on the table.
- The 10 diagnostic signs in this piece are anchored to operator-owned data you can pull from your current billing platform today. Days in AR, denial rate, denial code repetition patterns, underpayment recovery yield, payer-specific rate variance visibility, timely filing performance, VOB turnaround, cross-facility benchmarking, report quality, and strategic responsiveness at QBR.
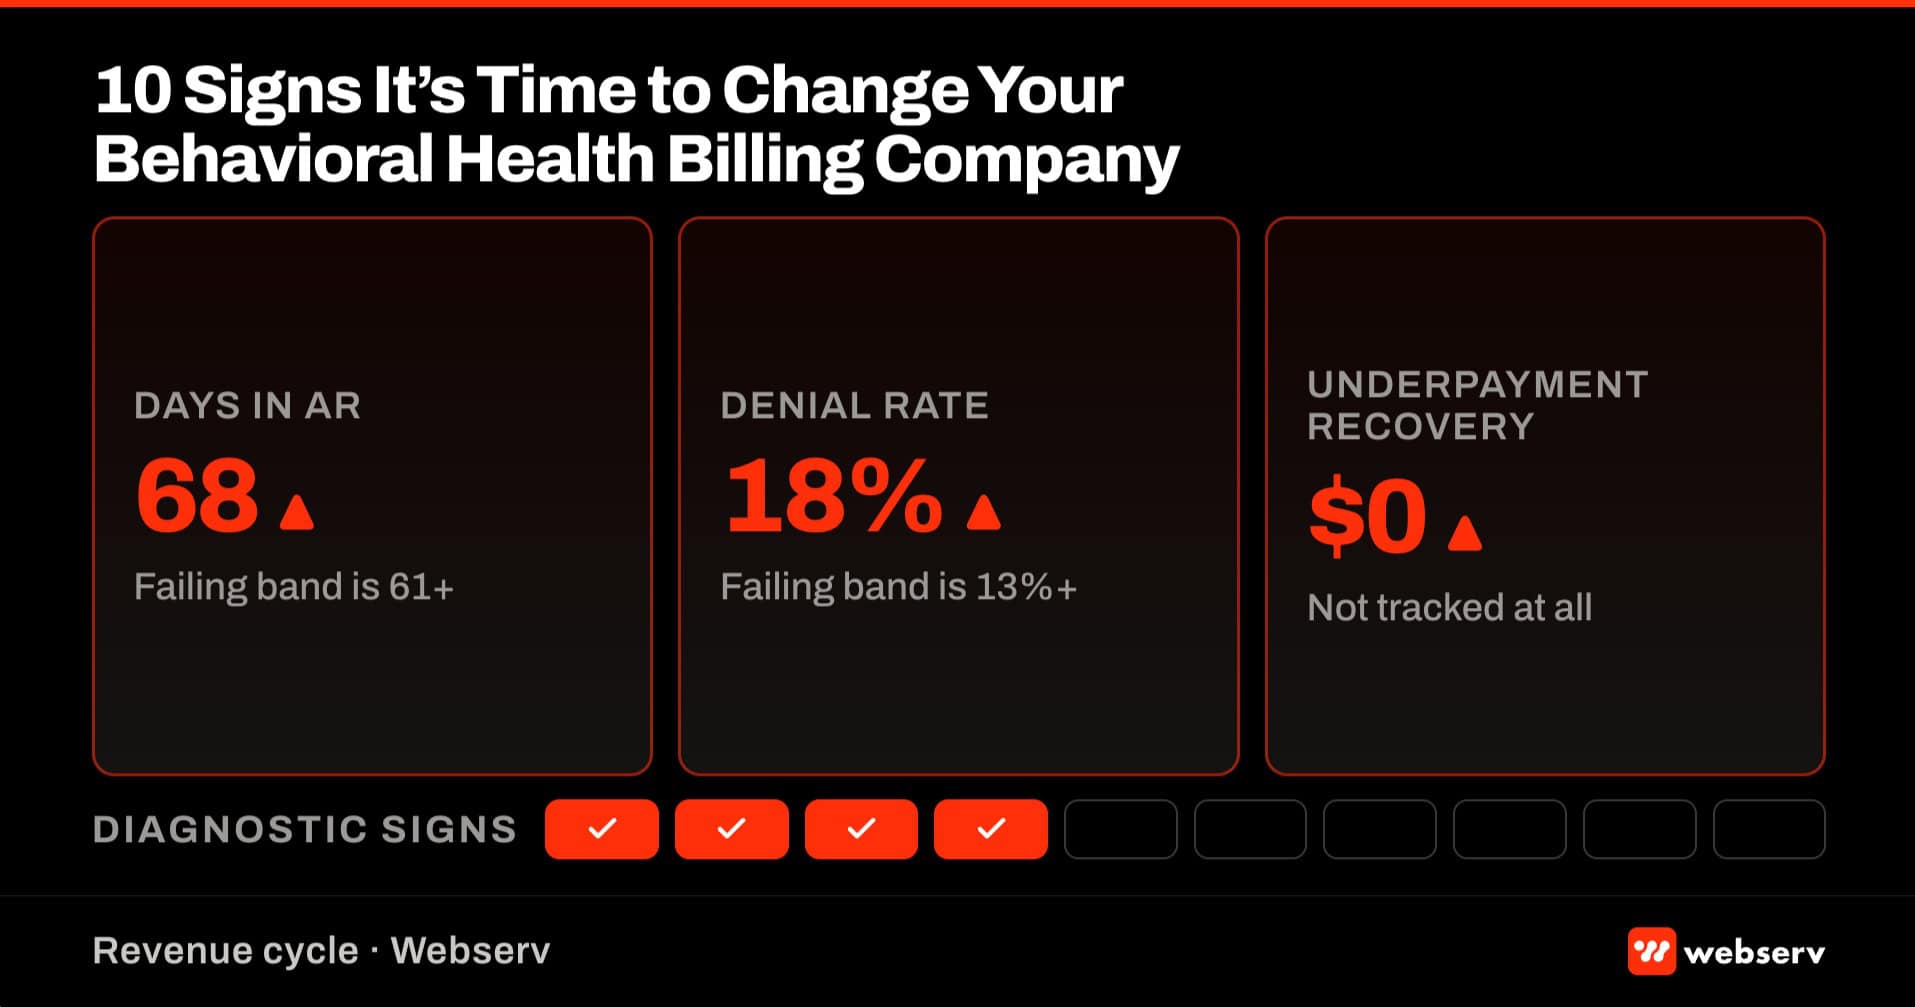
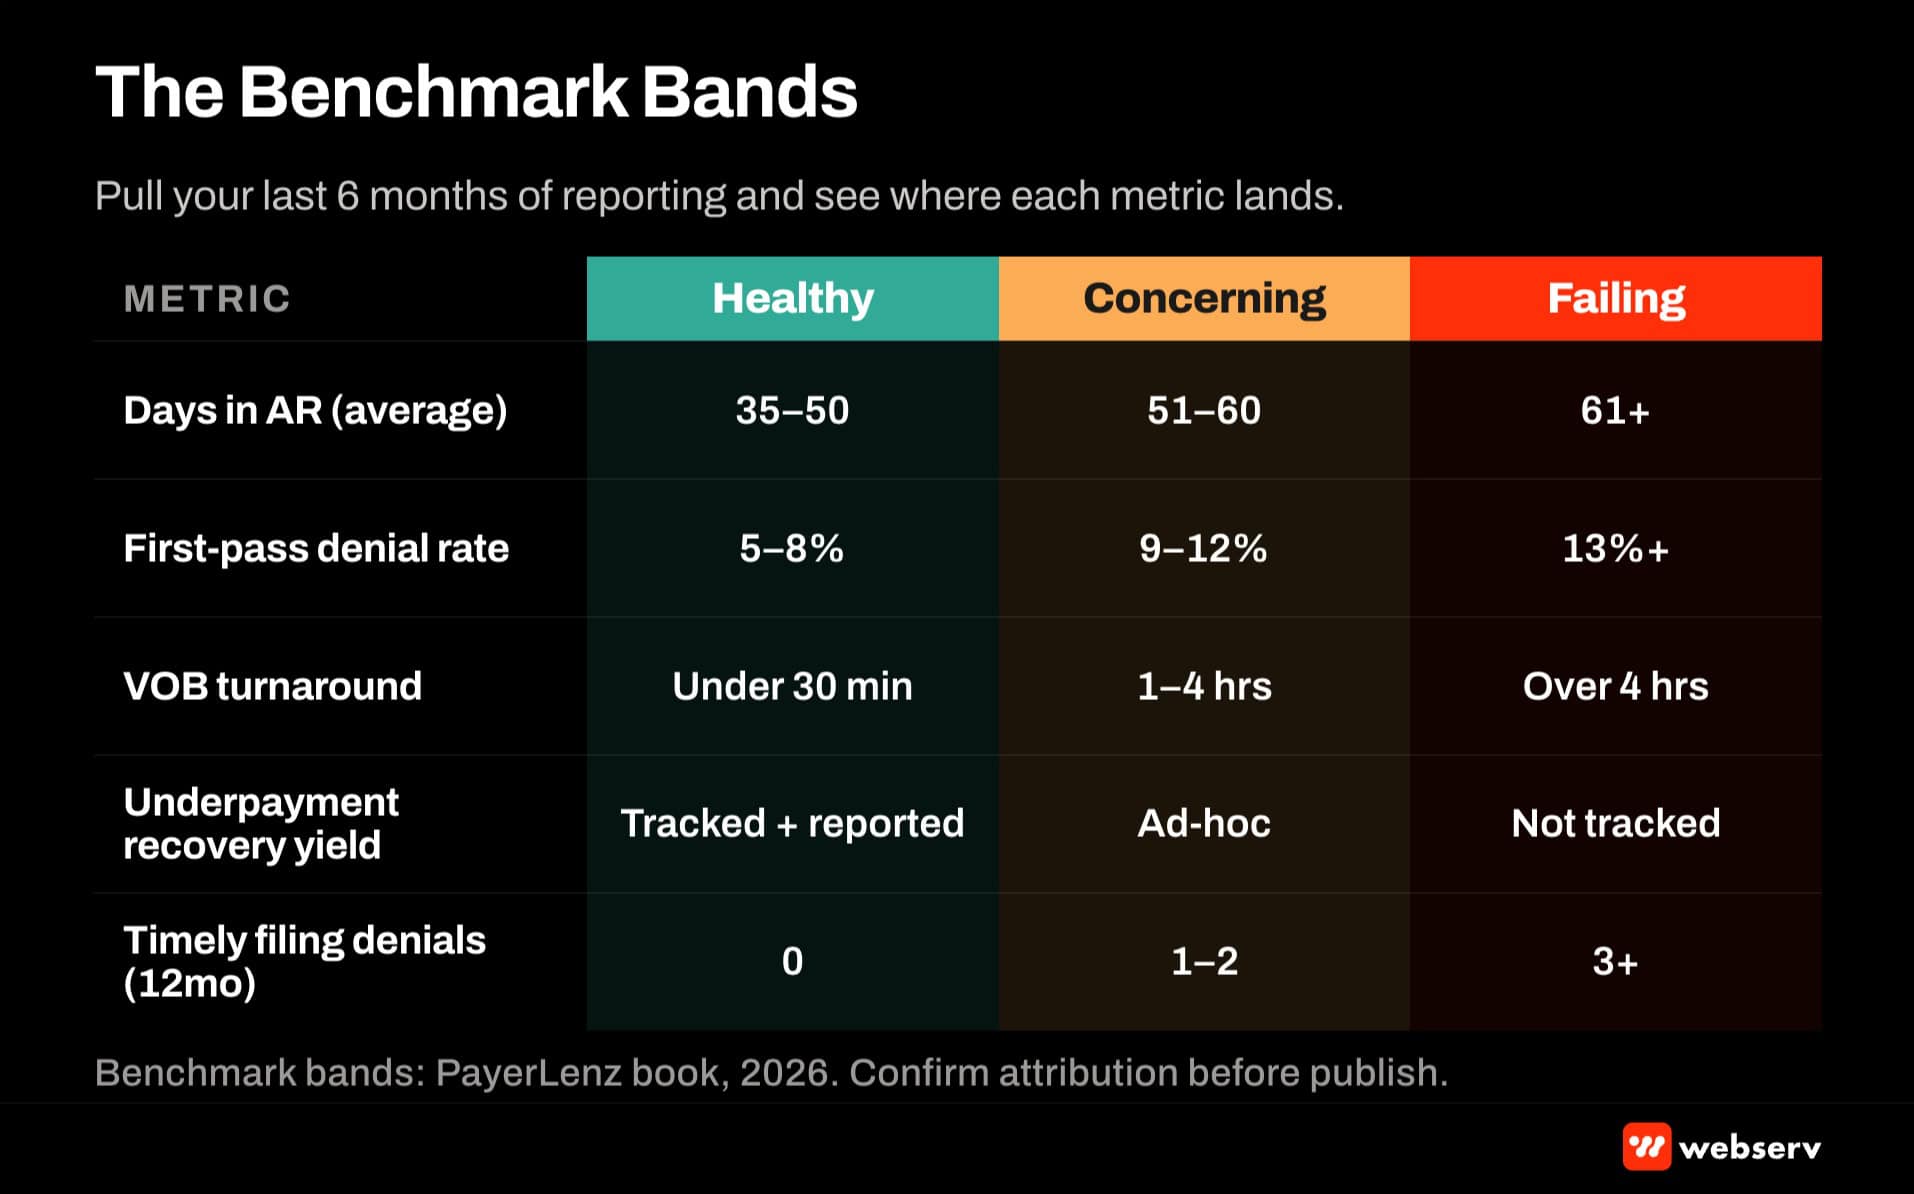
- Industry benchmarks published by HFMA and referenced in behavioral health-specific reporting anchor most of the signs. First-pass denial rate of 5 to 8 percent is normal, 12 to 20 percent is concerning, above 20 percent signals the billing team is processing denials rather than preventing them. Days in AR of 35 to 50 is healthy, above 60 is a warning, above 90 is a serious operational problem.
- Switching cost is typically overestimated. The migration itself is a 60 to 90 day disruption for a 12 to 36 month improvement. AR does not have to migrate. Credentialing follows the facility, not the billing partner. The new partner starts fresh on Day 1 for new admits while the old partner works out remaining AR under the existing agreement.
- The new billing partner evaluation framework covers eight criteria: rate intelligence, underpayment recovery workflow, portfolio-level reporting, root-cause QI cadence, transparency of methodology, payer relationship depth, cross-functional data flow, and reference conversation quality. Facilities that evaluate on price alone typically end up in the same position 18 months later.
DEFINITION
10-sign billing partner diagnostic. A structured data-first diagnostic for evaluating whether a treatment center’s current billing company is producing the operational output a competitive RCM partner should produce. Ten signs anchored to metrics the operator can pull from the current billing platform: Days in AR, denial rate, denial code repetition, underpayment recovery yield, payer-specific rate variance visibility, timely filing performance, VOB turnaround, cross-facility benchmarking, report diagnostic quality, and QBR-level strategic responsiveness.
Distinct from a price comparison (which misses operational quality) and distinct from a general RCM audit (which inventories every possible issue). Uses the same symptom-first logic a diagnostic framework uses: pull the operator’s own data, confirm the signs against industry benchmarks, and reach a defensible decision. Three or more signs applying is the threshold for a real evaluation conversation.
OPERATOR INSIGHT
What operators rarely quantify before they switch is the cost of staying.
Facilities with mature RCM partners recover most of that revenue quarterly. Facilities without recover almost none of it. Recovery is possible during the hesitation window. Recovery on cases that have hit timely filing limits or fallen out of the payer’s appeal window is not. The gap is where the switching-cost math actually lives.
Sign 1: Days in AR keep growing
What it looks like in your data. Pull the trailing 12-month Days in AR trend from your current billing platform, broken out by aging bucket (0-30, 31-60, 61-90, 90+). If the 60+ days aging bucket has been growing quarter-over-quarter for two or more consecutive quarters, this sign is confirmed.
Why it happens. Days in AR growth is the composite output of collection velocity failure. It surfaces when the billing team is filing claims but not aggressively following up on aged claims, when denial workflows are producing backlog faster than resolution, or when payer follow-up cadence has slipped.
How to verify. Your billing platform’s AR aging report is the primary source. Cross-reference against the trailing 90-day CRM admit count to confirm the AR growth is not just admit volume growth outpacing collections cycle time. If admit volume is flat and AR is growing, the collection velocity is the problem.
What good looks like. HFMA industry benchmarks place healthy Days in AR for treatment centers in the 35 to 50 day range. Above 60 days is a warning sign. Above 90 days is a serious operational problem that compounds with age because the probability of collecting on a claim degrades sharply after 90 days.
Sign 2: Denial rate is trending up, not down
What it looks like in your data. Pull your trailing 6-quarter first-pass denial rate. Plot the trend. If the rate is flat or climbing, the billing partner is not producing operational improvement over time. A functional partner should be trending denial rate down through denial prevention work.
Why it happens. Denial prevention requires monthly root-cause analysis of denial reasons, workflow changes to prevent repeat denials, and payer-specific pre-submission checks. Partners without this discipline process denials as they come rather than preventing them at the front end.
How to verify. Your billing platform’s denial reporting broken out by month over the trailing 6 quarters. Compare against the trailing 12-month admit volume to normalize for volume growth. Denial rate should be a percentage, not an absolute count.
What good looks like. HFMA benchmarks place healthy first-pass denial rates for behavioral health at 5 to 8 percent. Rates of 12 to 20 percent are workable but concerning. Rates above 20 percent signal the billing team is processing denials rather than preventing them, which multiplies operational cost and delays revenue realization.
Sign 3: The same denial codes keep repeating
What it looks like in your data. Pull your top 3 denial reasons for each of the last 4 quarters. If the same 2 or 3 denial reasons appear across all 4 quarters at similar volumes, this sign is confirmed. A billing partner running closed-loop quality improvement eliminates repeating denials within 1 to 2 quarters.
Why it happens. Same-denial repetition indicates the billing team is closing denials without addressing the root cause. Each recurrence produces the same operational cost, the same delayed revenue realization, and the same eventual write-off risk if timely filing closes.
How to verify. Denial reason ranking report from your billing platform, run per quarter for the trailing 4 quarters. Common repeating codes for BH include CO-16 (missing information), CO-97 (payment adjusted), and CO-45 (charge exceeds fee schedule). If the same top codes appear quarter after quarter, denial prevention is not happening.
What good looks like. A functional billing partner runs monthly root-cause analysis on top denial reasons, implements process changes at the front end, and shows measurable reduction in those specific denial codes within 60 to 90 days. Denial mix should shift over time as prevention work eliminates preventable categories.
Sign 4: Underpayment recovery is not a workflow
What it looks like in your data. Ask your billing partner directly: “What did we recover from underpayments last quarter?” If the answer is “we don’t specifically track that” or “we recover what we can,” this sign is confirmed. A functional partner has a defined multi-stage underpayment recovery workflow with monthly yield reporting.
Why it happens. Underpayment recovery requires claims-data intelligence to detect underpayments (comparing actual paid amounts against expected reimbursement rates), a defined appeal workflow, and a follow-up cadence. Partners without underpayment intelligence data pools cannot systematically detect underpayments in the first place.
How to verify. Ask for a trailing 12-month underpayment recovery yield report. If the partner cannot produce one, they do not have a workflow. If they can produce one but it shows recoveries under 1 percent of gross revenue, the workflow exists but is not effective. Healthy operations recover 3 to 8 percent of gross revenue through underpayment work.
What good looks like. Our underpayment recovery workflow piece covers what a defined 5-stage workflow looks like. The specific stages: detection, verification, appeal preparation, payer engagement, and recovery documentation. Each stage produces measurable output that rolls up into monthly yield reporting.
Sign 5: No visibility into payer-specific rate variance
What it looks like in your data. Ask your billing team which payer pays you the most versus least for the same level of care. If they cannot answer with specific numbers, or if the answer is “it depends on the case,” rate variance visibility is missing.
Why it happens. Payer-specific rate reporting requires claims-data analytics that most BH billing operations do not run. Without rate variance visibility, admissions cannot make rate-adjusted admit decisions, payer contract negotiations lack defensible data, and payer mix strategy runs on intuition rather than economics.
How to verify. Request a payer-specific reimbursement report by LOC for the trailing 12 months. Healthy operations produce this monthly and use it in QBR reporting. Facilities running without it typically discover during a payer contract negotiation that they cannot substantiate the rate ask because they never captured the historical performance.
What good looks like. Monthly payer-mix plus rate-variance reporting that connects admissions decisions to reimbursement outcomes. The admissions team should see rate confidence data before making admit-day decisions on borderline cases. Our reimbursement intelligence hub covers the specific data architecture that produces this output.
Sign 6: Timely filing deadlines get missed
What it looks like in your data. Pull denial reports for the trailing 12 months. Filter for any denial reason coded as “past timely filing” or the equivalent (CO-29 is the standard code). If any claims have been denied for timely filing in the last year, this sign is confirmed.
Why it happens. Timely filing failures are 100 percent preventable operational failures. Every payer publishes a filing window (typically 90 to 180 days from date of service). A billing team missing that window is failing at the most basic operational task the partner exists to perform.
How to verify. CO-29 denial code report from your billing platform, run for the trailing 12 months. Zero occurrences is the expected result. Any occurrence is a red flag. Multiple occurrences signal systematic operational failure.
What good looks like. Zero timely filing denials, ever. Full stop. A billing partner producing timely filing denials at any volume is failing at the load-bearing function of the operation. This is one of the few signs on this list that has no acceptable non-zero threshold.
Sign 7: VOB is manual and slow
What it looks like in your data. Track average VOB turnaround time from patient inquiry to VOB completion during business hours. If the average is over 4 hours, VOB is manual or the workflow has serious operational drag.
Why it happens. Automated VOB tools (Availity, pVerify, bundled EMR VOB modules from Kipu or Sunwave) return coverage confirmation and benefits data in under 30 minutes for most payers. Manual VOB requires coordinator time to log into payer portals, review coverage screens, and document benefits by hand. That process costs hours per case and delays admit decisions.
How to verify. Your CRM should log the timestamp between initial inquiry and VOB-completed status. Calculate the average across the trailing 90 days during business hours. Under 30 minutes indicates automated VOB. Over 4 hours indicates manual VOB or workflow drag.
What good looks like. Automated VOB completing under 30 minutes for standard payer verifications during business hours, with manual escalation only on complex cases (multi-plan coordination, secondary insurance, out-of-network verification requiring plan-level appeals research).
Sign 8: No cross-facility benchmarking for portfolio operators
What it looks like in your data. If you operate multiple facilities and cannot tell whether Facility A’s collections are outperforming Facility B on the same payer mix, cross-facility benchmarking is missing. Portfolio operators need this reporting to identify which facilities are producing operational drag and where the operational learning transfers across the portfolio.
Why it happens. Cross-facility variance reporting requires the billing partner to standardize data across facilities and produce comparative analytics. Partners running each facility as an independent client relationship without portfolio-level view treat each facility’s problems in isolation, which prevents the operator from applying learning across the portfolio.
How to verify. Request a monthly cross-facility variance report for the trailing quarter. Should include denial rate by facility, Days in AR by facility, and payer-specific reimbursement performance by facility. If the partner cannot produce this without significant custom work, portfolio-level visibility is missing.
What good looks like. Standard monthly reporting that includes facility-level comparison across the core RCM metrics. Portfolio-level operators can identify which facility is outperforming on which metric and apply the learning across the portfolio. This is standard practice at portfolio scale. Not having it is inexcusable at that scale.
Sign 9: Reports are canned, not diagnostic
What it looks like in your data. Look at your last three months of billing reports side by side. If they follow the same format with the same tables and the same commentary regardless of what actually happened operationally, your reporting is canned. Healthy reporting is diagnostic: it explains what changed, why, and what to do about it.
Why it happens. Canned reporting reflects a billing operation running on templates rather than analysis. Each month, the same PDF gets generated with updated numbers. No one is reading the numbers, interpreting them, or connecting them to operational recommendations. The report becomes a compliance artifact rather than a decision tool.
How to verify. Compare three consecutive months of reporting. If the narrative sections are identical or nearly identical, the reporting is not diagnostic. If specific metrics changed materially month over month with no commentary explaining the change, the reporting is not diagnostic.
What good looks like. Reporting that identifies month-over-month changes greater than 5 percent, provides root-cause analysis of the change, and recommends specific operational responses. Diagnostic reporting is the interface between the billing data and the operator’s strategic decisions. Without it, the CFO is looking at numbers without a story.
Sign 10: The billing partner cannot answer “what should we do differently”
What it looks like in your data. In your next quarterly review, ask your billing partner what you should do differently based on the last quarter’s data. If the answer is transactional (“we will keep filing claims and appealing denials”), the partner is not a strategic revenue cycle operator. They are a claims processor.
Why it happens. Strategic RCM requires the partner to interpret data across the operation and recommend changes at the operator level: payer mix adjustments, contract renegotiation targets, LOC investment decisions, admissions workflow changes. Claims processors do not do this because it is outside their operational scope and outside their commercial incentives.
How to verify. Ask directly at the next QBR. The response tells you the operating posture of the partner. A strategic response references specific data patterns, recommends specific operator-level changes, and provides an ROI estimate. A transactional response describes ongoing operational work without connecting it to strategic decisions.
What good looks like. A billing partner that runs QBR-level strategic reviews with the operator team, brings specific recommendations to each review (with dollar-impact estimates), and connects RCM performance data to marketing spend, admissions workflow, and payer strategy decisions. This posture is what separates a revenue cycle partner from a claims processor.
Benchmarks anchoring the diagnostic
5-8%
HFMA healthy first-pass denial rate for behavioral health
35-50 d
Healthy Days in AR range per HFMA benchmarks
$1.36M
Missed payments surfaced across 23K claims via PayerLenz data pool
$80-220K
Monthly unrealized revenue at a mid-size 150-admit facility
The switching cost math
Most operators overestimate what a billing partner migration actually costs. The specific components matter.
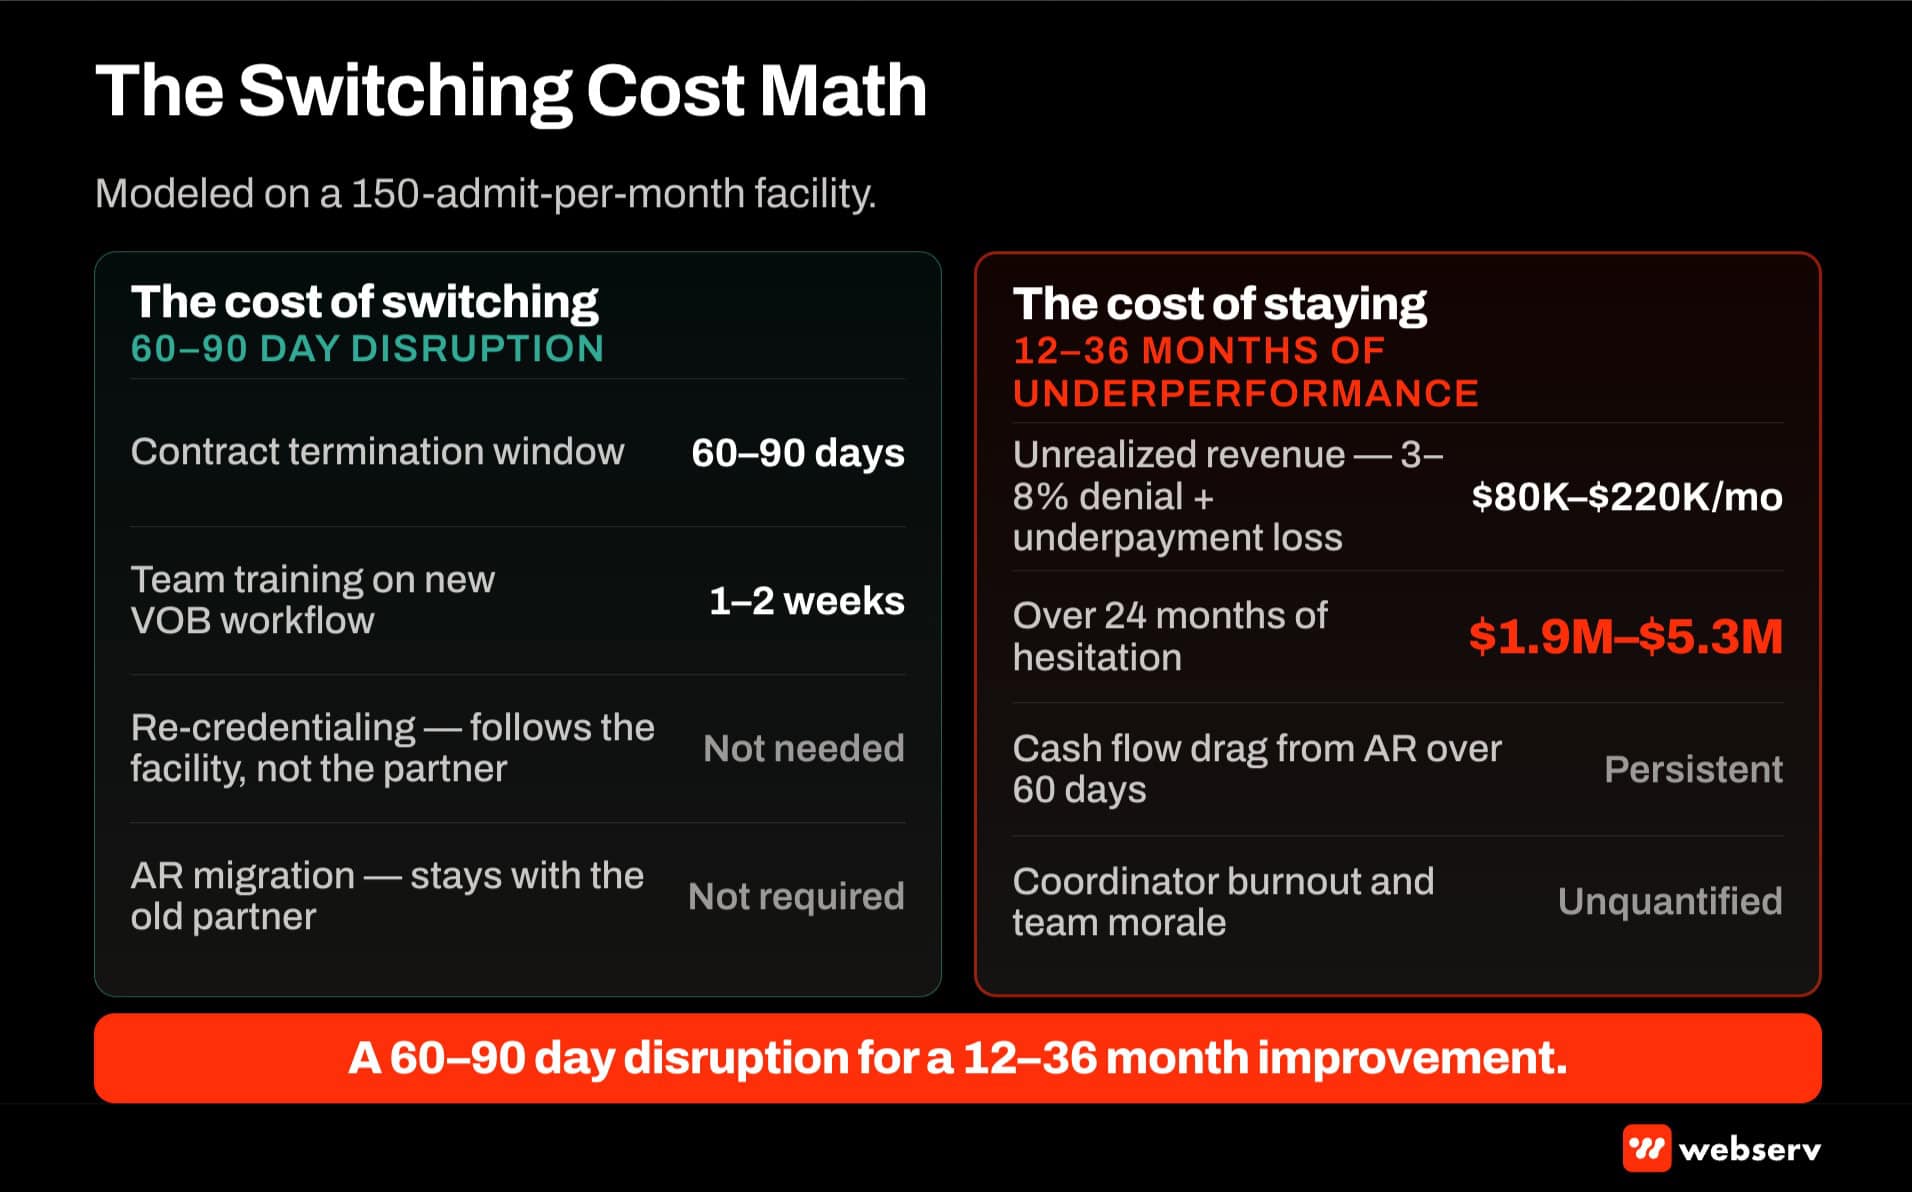
Contract termination window. Standard BH billing agreements carry 60 to 90 day termination notice periods. Some have longer windows. Read your current contract before assuming a specific timeline.
Data migration. Patient records, AR, and open claims stay with the old partner. The new partner starts fresh from Day 1 for new admits. The critical insight most operators miss: you do not have to migrate AR. The old partner works out remaining AR under their existing agreement (typically at a modified fee rate for post-termination collections).
Team training. Admissions team needs 1 to 2 weeks to learn the new VOB workflow, the new billing platform interface, and the new escalation pathways. Most operators overweight this timeline because they assume total workflow replacement. In practice, admissions team retraining takes days, not weeks, when the new partner has a defined onboarding curriculum.
Provider re-credentialing. Usually not needed. Credentialing follows the facility, not the billing partner. If your NPI, state license, and facility credentialing are intact, they remain intact through the billing partner switch. Some payers require notification of the new billing agent, but full re-credentialing is unusual.
Downstream disruption. Usually minimal if the switch is timed at the end of a billing period. Time the migration for the first day of a new month or quarter. New admits go through the new partner from that date. Existing AR continues under the old partner until closed.
The cost of staying is the comparison. Reference the $80,000 to $220,000 per month unrealized revenue math from the intro.
The typical migration produces a 60 to 90 day disruption for a 12 to 36 month revenue improvement. That is the math worth doing before you decide the migration is too painful.
Diagnose Your Own Billing Operation in 3 Minutes
The 10 signs above are the diagnostic. But reading them in a list is not the same as scoring your own operation against them.
We built a short quiz that walks you through the 10 signs one at a time. Answer honestly — the whole point is to surface where the pattern is loudest at your center — and in 3 minutes you’ll see your top 3 failure patterns ranked by severity, with the specific data check that confirms each one and the first move to fix it.
The quiz is not a sales tool. If your billing operation is running clean, it will tell you that. If two or three patterns are dominant, it will name them and hand you a diagnostic move you can execute this week — with or without our help.
What to look for in a new billing partner
The eight-criterion evaluation framework we use when treatment center operators ask how to compare candidates.
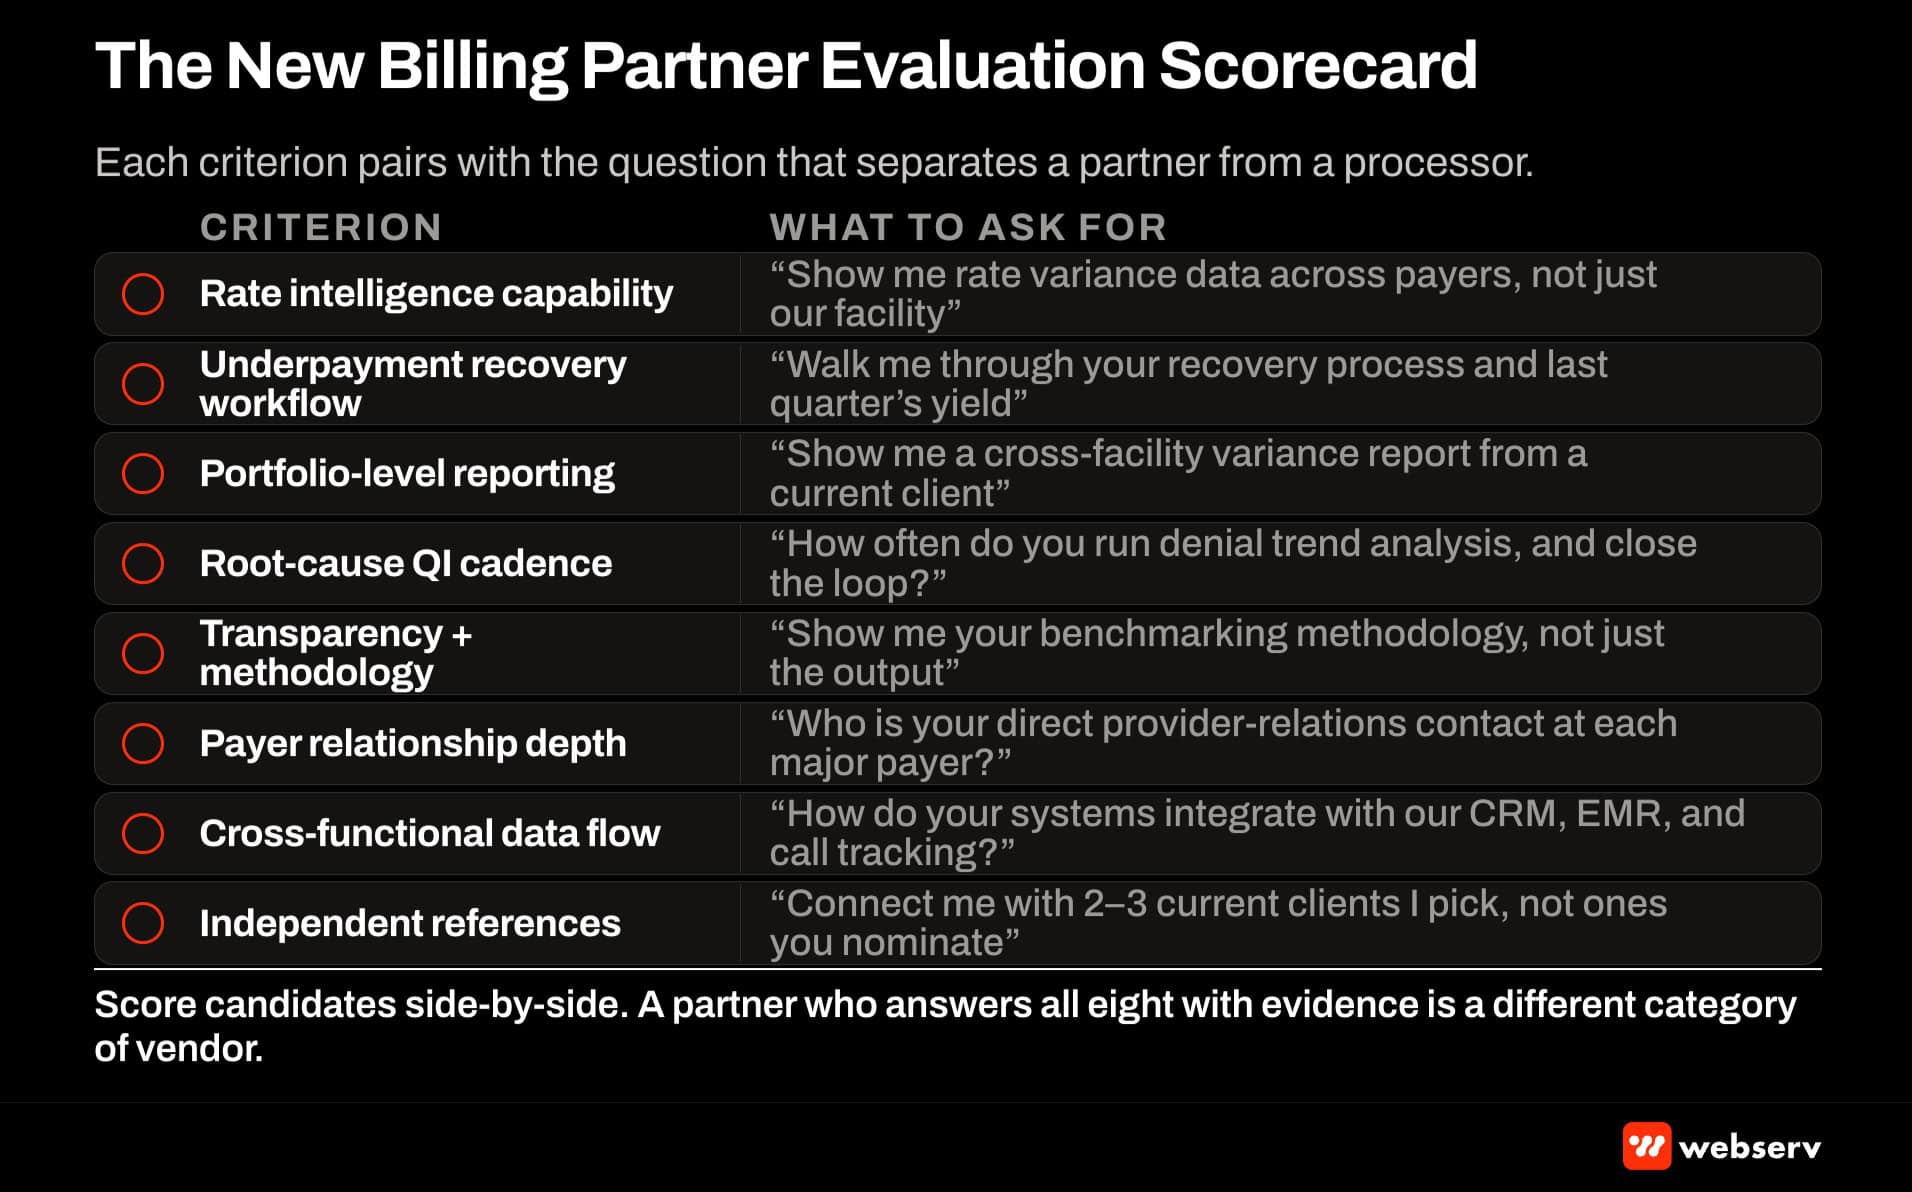
Rate intelligence capability. Does the partner have claims data across payers, or just yours? Rate intelligence requires a claims data pool that spans multiple operators. Partners without a pooled data source cannot benchmark your reimbursement rates against market and cannot detect underpayments systematically. PayerLenz is one example of the pooled-data approach; the specific vendor is less important than confirming the capability exists.
Underpayment recovery workflow. Ask for the specific stages. If the answer is vague (“we appeal denials”), the workflow is not defined. Healthy operations have a documented 5-stage recovery process with per-stage yield metrics. Our underpayment recovery workflow piece covers the reference structure.
Portfolio-level reporting. For multi-facility operators, this is a load-bearing capability. Confirm the partner produces cross-facility variance reporting as standard, not as a custom request.
Root-cause QI cadence. Monthly denial trend analysis with documented process changes. Quarterly is too slow for the volume most BH facilities generate. If the partner runs analysis only when specifically asked, the discipline is not embedded.
Transparency of methodology. Can the partner show you their scoring, benchmarking, and rate-confidence methodology? Partners that treat methodology as proprietary usually do so because the methodology is not defensible. A partner confident in their approach will walk you through it.
Payer relationship depth. Direct provider-relations contacts at the major national payers (BCBS, Aetna, Cigna, UHC) accelerate appeal resolution and contract renegotiation. Ask how many of those relationships the partner maintains actively.
Cross-functional data flow. The billing partner needs to integrate with your CRM, EMR, and call tracking. Confirm the specific technical integration path before signing. Partners that require data exports rather than integrated data flow produce operational drag over time.
Reference conversations. Talk to 2 to 3 current clients. Not the ones the vendor picks. Ask for a list of all clients matching your size and payer mix, then pick three yourself and initiate conversations. Vendor-selected references produce a distorted picture.
DO
- Pull the trailing 12-month Days in AR aging report and the trailing 6-quarter first-pass denial rate before the next QBR conversation with your current partner.
- Ask for a trailing 12-month underpayment recovery yield report — inability to produce one means the workflow does not exist.
- Time any migration to the first day of a new month or quarter — new admits go through the new partner, existing AR continues under the old partner until closed.
- Evaluate new partners on all 8 criteria (rate intelligence, underpayment recovery, portfolio reporting, QI cadence, methodology transparency, payer relationships, data flow, references) — not on price.
- Pick your own 3 references from the vendor’s full client list matching your size and payer mix — vendor-selected references produce a distorted picture.
DON’T
- Assume you have to migrate AR — AR stays with the current partner under the existing agreement, the new partner starts fresh on Day 1.
- Assume you need to re-credential — credentialing follows the facility (NPI, state license, JCAHO/CARF), not the billing partner.
- Accept any timely filing denials as normal — CO-29 is 100% preventable and there is no acceptable non-zero threshold.
- Accept “we recover what we can” on underpayments — a functional partner has a defined 5-stage workflow with per-stage yield metrics.
- Confuse a claims processor with a strategic RCM partner — the QBR question “what should we do differently” separates the two categories cleanly.
Frequently Asked Questions
What does a typical billing company switch cost in dollars?
The direct cost is typically a modest transition fee from the new partner (some waive it, some charge 1 to 3 percent of first-month collections as a setup fee) plus the cost of coordinator time during the 1 to 2 week training window. For a mid-size facility, direct switch cost usually runs $5,000 to $20,000.
The indirect cost is the collection velocity dip during the transition. New partners typically produce collection velocity 20 to 30 percent slower during the first 60 to 90 days as they learn your payer mix and workflow. This adds temporary AR pressure that resolves as the new partner reaches steady state.
The comparison worth running: total switch cost (direct plus indirect) against the trailing 12-month improvement estimate from the new partner. If the new partner produces 3 to 8 percent more revenue realization at the same operational cost, the payback period is typically 3 to 6 months.
How long does the migration take from start to finish?
Total elapsed time is typically 90 to 120 days from decision to steady-state operation. The specific phases: 30 to 60 days of contract termination notice on the current partner, 30 days of onboarding with the new partner (technical integration, team training, VOB workflow setup), and 30 to 60 days of parallel operation while the new partner handles new admits and the old partner works out remaining AR.
Facilities with clean underlying data (accurate patient records, current NPI, complete credentialing) migrate faster. Facilities with data hygiene issues extend the timeline because the new partner has to work through the data quality issues before steady-state operation begins.
Portfolio operators typically stage the migration across facilities rather than switching all facilities at once. This spreads operational risk and lets the operator confirm the new partner is producing as promised on one facility before extending across the portfolio.
Will I lose my AR if I switch billing partners?
No. AR stays with the current partner under the existing agreement. The current partner works out remaining AR through timely filing windows on all outstanding claims, typically at a modified fee arrangement for post-termination collections work.
The new partner starts fresh from Day 1 on new admits. This is the specific structural detail that most operators miss when they assume switching is impossibly complex. You do not have to move AR to a new system. You do not have to reconcile historical claims against a new platform. The old partner completes their remaining work on the AR they already have.
The termination agreement should specify the fee structure for the AR wind-down period. Get that in writing before terminating. Some current partners will attempt to charge higher fees during wind-down as an implicit penalty for leaving. Negotiate that structure at the termination conversation.
Do I need to re-credential with payers when I switch?
Usually not. Credentialing follows the facility (NPI, state license, JCAHO or CARF accreditation, LegitScript certification), not the billing partner. Your facility’s credentialing status remains intact through the billing partner switch.
Some payers require notification of the new billing agent, particularly for direct electronic remittance advice routing. That is a form update, not a credentialing renewal. Your new partner handles the notification process as part of onboarding.
The one exception: if your current billing partner also holds specific payer relationships or is credentialed as the billing agent under a payer-specific arrangement, some of those relationships need to be re-established with the new partner. Ask your new partner during evaluation whether they have relationships with your current top payers.
How do I evaluate whether a new billing partner is actually better?
Run the 10 diagnostic signs from this piece against the new partner’s operations after 90 days of steady-state work. If the new partner produces measurable improvement on the specific signs that flagged for your current partner, the switch was defensible.
The specific comparison metrics: Days in AR trend at 90 days versus baseline, denial rate trend at 90 days versus baseline, underpayment recovery yield at 90 days, and the specific denial code repetition pattern. If those metrics move in the expected direction, the new partner is operating at the higher quality level.
Also worth confirming: the qualitative signs. Does the new partner produce diagnostic reporting rather than canned reporting? Do they answer what-should-we-do-differently with strategic recommendations rather than transactional responses? Those signs surface within the first 60 to 90 days.
Is Revenue Logic a good fit for a small facility with 30 beds or fewer?
It depends on the specific operational profile. Small facilities with clean payer mix, high average revenue per admit, and disciplined admissions operations typically produce strong return from the reimbursement intelligence infrastructure. Small facilities running on Medicaid-heavy payer mix or with immature admissions ops may not clear the ROI threshold.
The specific threshold I use for evaluation: monthly gross revenue above roughly $150,000 with mixed OON payer exposure typically produces ROI within 6 to 9 months. Below that revenue floor, the infrastructure cost may exceed the near-term recovery yield, and the operator is better served by fixing admissions ops first, then adding the RCM layer once the admit volume supports it.
A 30-minute intake conversation clarifies the fit quickly. The evaluation is honest either way. Facilities that are not a fit get told directly rather than sold into a mismatched engagement. Book a diagnostic call and we can walk through your specific numbers.
How does the decision differ for portfolio operators versus single-facility operators?
Portfolio operators have compounding stakes on the switching decision. A billing partner that is 3 percent below optimal on a single 150-admit facility costs $80,000 to $220,000 monthly. That same partner across a 5-facility portfolio costs 5x. The switching decision math tilts more strongly toward action at portfolio scale.
Portfolio operators also have more negotiating power in the new-partner conversation. Multi-facility volume produces pricing flexibility, dedicated account resources, and cross-facility benchmarking that single-facility operators cannot access on the same terms. The evaluation framework for portfolio operators should include portfolio-level reporting as a hard requirement rather than a preference.
Our reimbursement intelligence hub covers the specific portfolio-operator considerations in depth, and the 10% Rule case study documents the compounding recovery yield at operating scale.
Ready to have a real conversation? Book a 30-minute diagnostic call and we can walk through your billing partner’s performance data together. Not ready to switch? Ask about the evaluation scorecard as a PDF you can use to score your current partner internally.
Kyle McHenry is the founder of Revenue Logic, a behavioral-health revenue cycle partner. Webserv partners with Revenue Logic to surface RCM-side guidance for treatment center marketing teams.