There is a way of talking about network effects in software that is mostly marketing. The tool gets better with more users, the story goes, and by the way you should be one of them.
The version I want to describe is not that. It is a specific coefficient in a specific formula that determines whether a rate benchmark is trustworthy or not.
Every PayerLenz customer’s claims data lifts that coefficient for every other customer. It is not a story about network effects. It is a term in an equation, and I can write the equation down.
This piece walks the mechanic end to end. How claims flow into the pool, what the enrichment pipeline does to them, why breadth beats volume at determining whether a rate can be trusted, and why the whole design is what eligibility API tools structurally cannot copy.
It is the technical companion to the alpha prefix and BCBS home plan resolution piece and sits inside the broader reimbursement intelligence discipline Webserv is building at PayerLenz.
Key Takeaways
- Claims flow into the PayerLenz pool on a nightly batch from each customer’s billing system, run through a five-step enrichment chain, and land in benchmark tables that recompute the same night. A customer’s data is contributing to everyone’s benchmarks within about 24 hours.
- The binding constraint on rate trust is breadth of contributor facilities per rate cell, not raw claim volume. Our confidence formula has a hard min(1, facilities / 3) term that caps confidence when a cell is backed by fewer than three distinct facilities.
- A rate cell with 500 claims from 2 facilities scores worse than 150 claims from 5 facilities. You cannot buy your way to a trustworthy benchmark from a single contributor.
- The estimate itself is confidence-weighted, not just decorated with a confidence score. When trust in the recent data is high, the estimate moves toward what the payer is paying now. When trust is low, it falls back to the long-run median. The system only chases recent data as far as it actually trusts it.
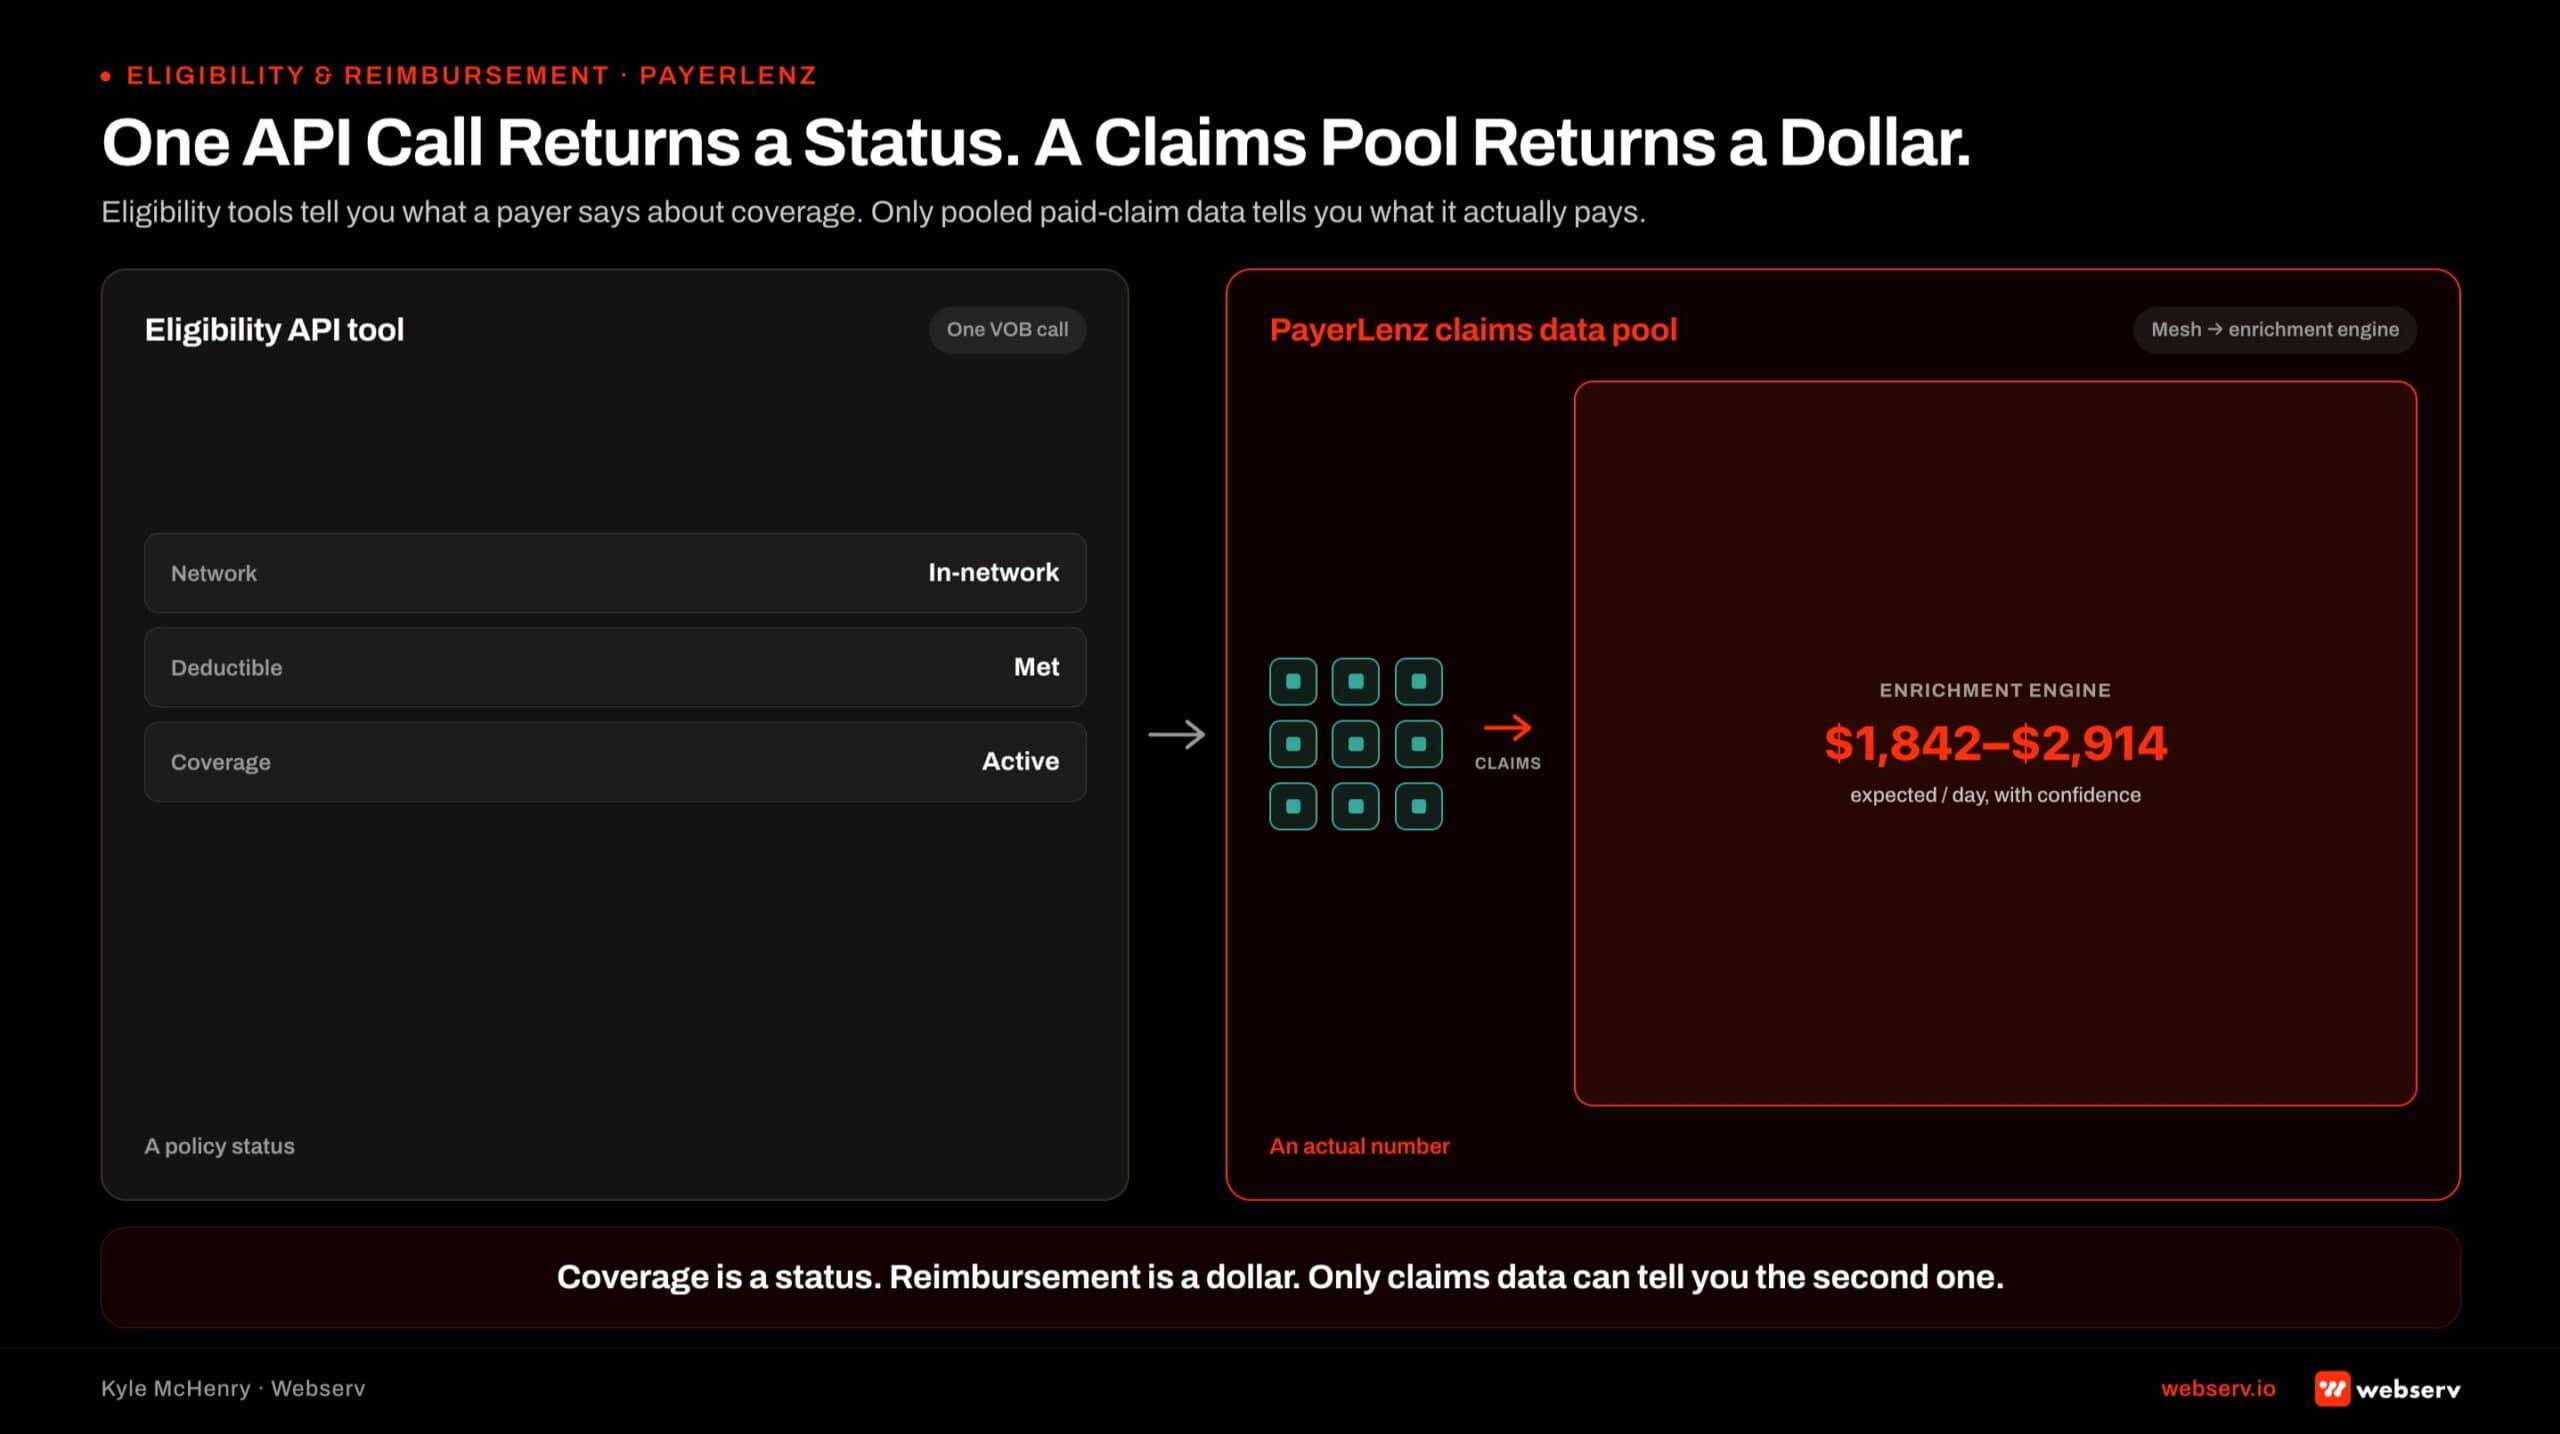
- Eligibility API tools (VerifyTX, Availity, pVerify, and every VOB automation platform) structurally cannot build this. The 271 eligibility response carries what the policy says, not what the payer paid. Adding features to that data source does not produce realized-payment benchmarks.
DEFINITION
The 837 professional claim file and its paired 835 remittance advice are the HIPAA-mandated EDI transaction standards for healthcare claim submission and payment reporting; CMS documents both as the national X12 5010 standard. That standardization — every payer sending claim data in the same structured shape — is what makes multi-payer, multi-facility pooling technically possible in the first place. Without it, the pool would need a custom parser for every payer relationship, and the marginal cost of adding contributing centers would kill the network effect.
network effect (in this context) is a coefficient in the confidence formula, not a marketing story. Every new contributor facility lifts the breadth term for every rate cell it touches, and cannot be substituted with volume from a single contributor.
How claims flow into the pool
The pipeline runs on a nightly batch. Every customer contributing to the pool has a scheduled sync at 10:00 UTC (2am Pacific) that pulls new and changed claims from their billing system.
The sync runs against the previous day’s activity plus any adjustments to older claims that the billing system processed since the last sync.
Today’s sync as one example: 94 new claims came in, 364 existing claims were updated, and 3,577 rows were touched during enrichment. That is a typical night. The pipeline is not real-time and does not need to be.
Rate benchmarks are a slow-moving signal, not a live-updated one, and the nightly cadence is what lets us do the enrichment work carefully rather than in a rush.
Once a customer’s claims land in the shared pool, they contribute to benchmarks that every other customer’s rate lookups draw from. That contribution happens automatically, within roughly 24 hours of the claim landing in the contributing customer’s billing system, without any manual intervention on either side.
Medicaid and Medicare are excluded from the pool. Both operate on fee schedules that are publicly available or effectively fixed, and mixing them into commercial rate benchmarks would degrade the signal for the questions treatment center operators are actually asking.
Implausible rates above $10,000 per day get quarantined automatically as data-quality anomalies until we can review them.
The five-step enrichment chain
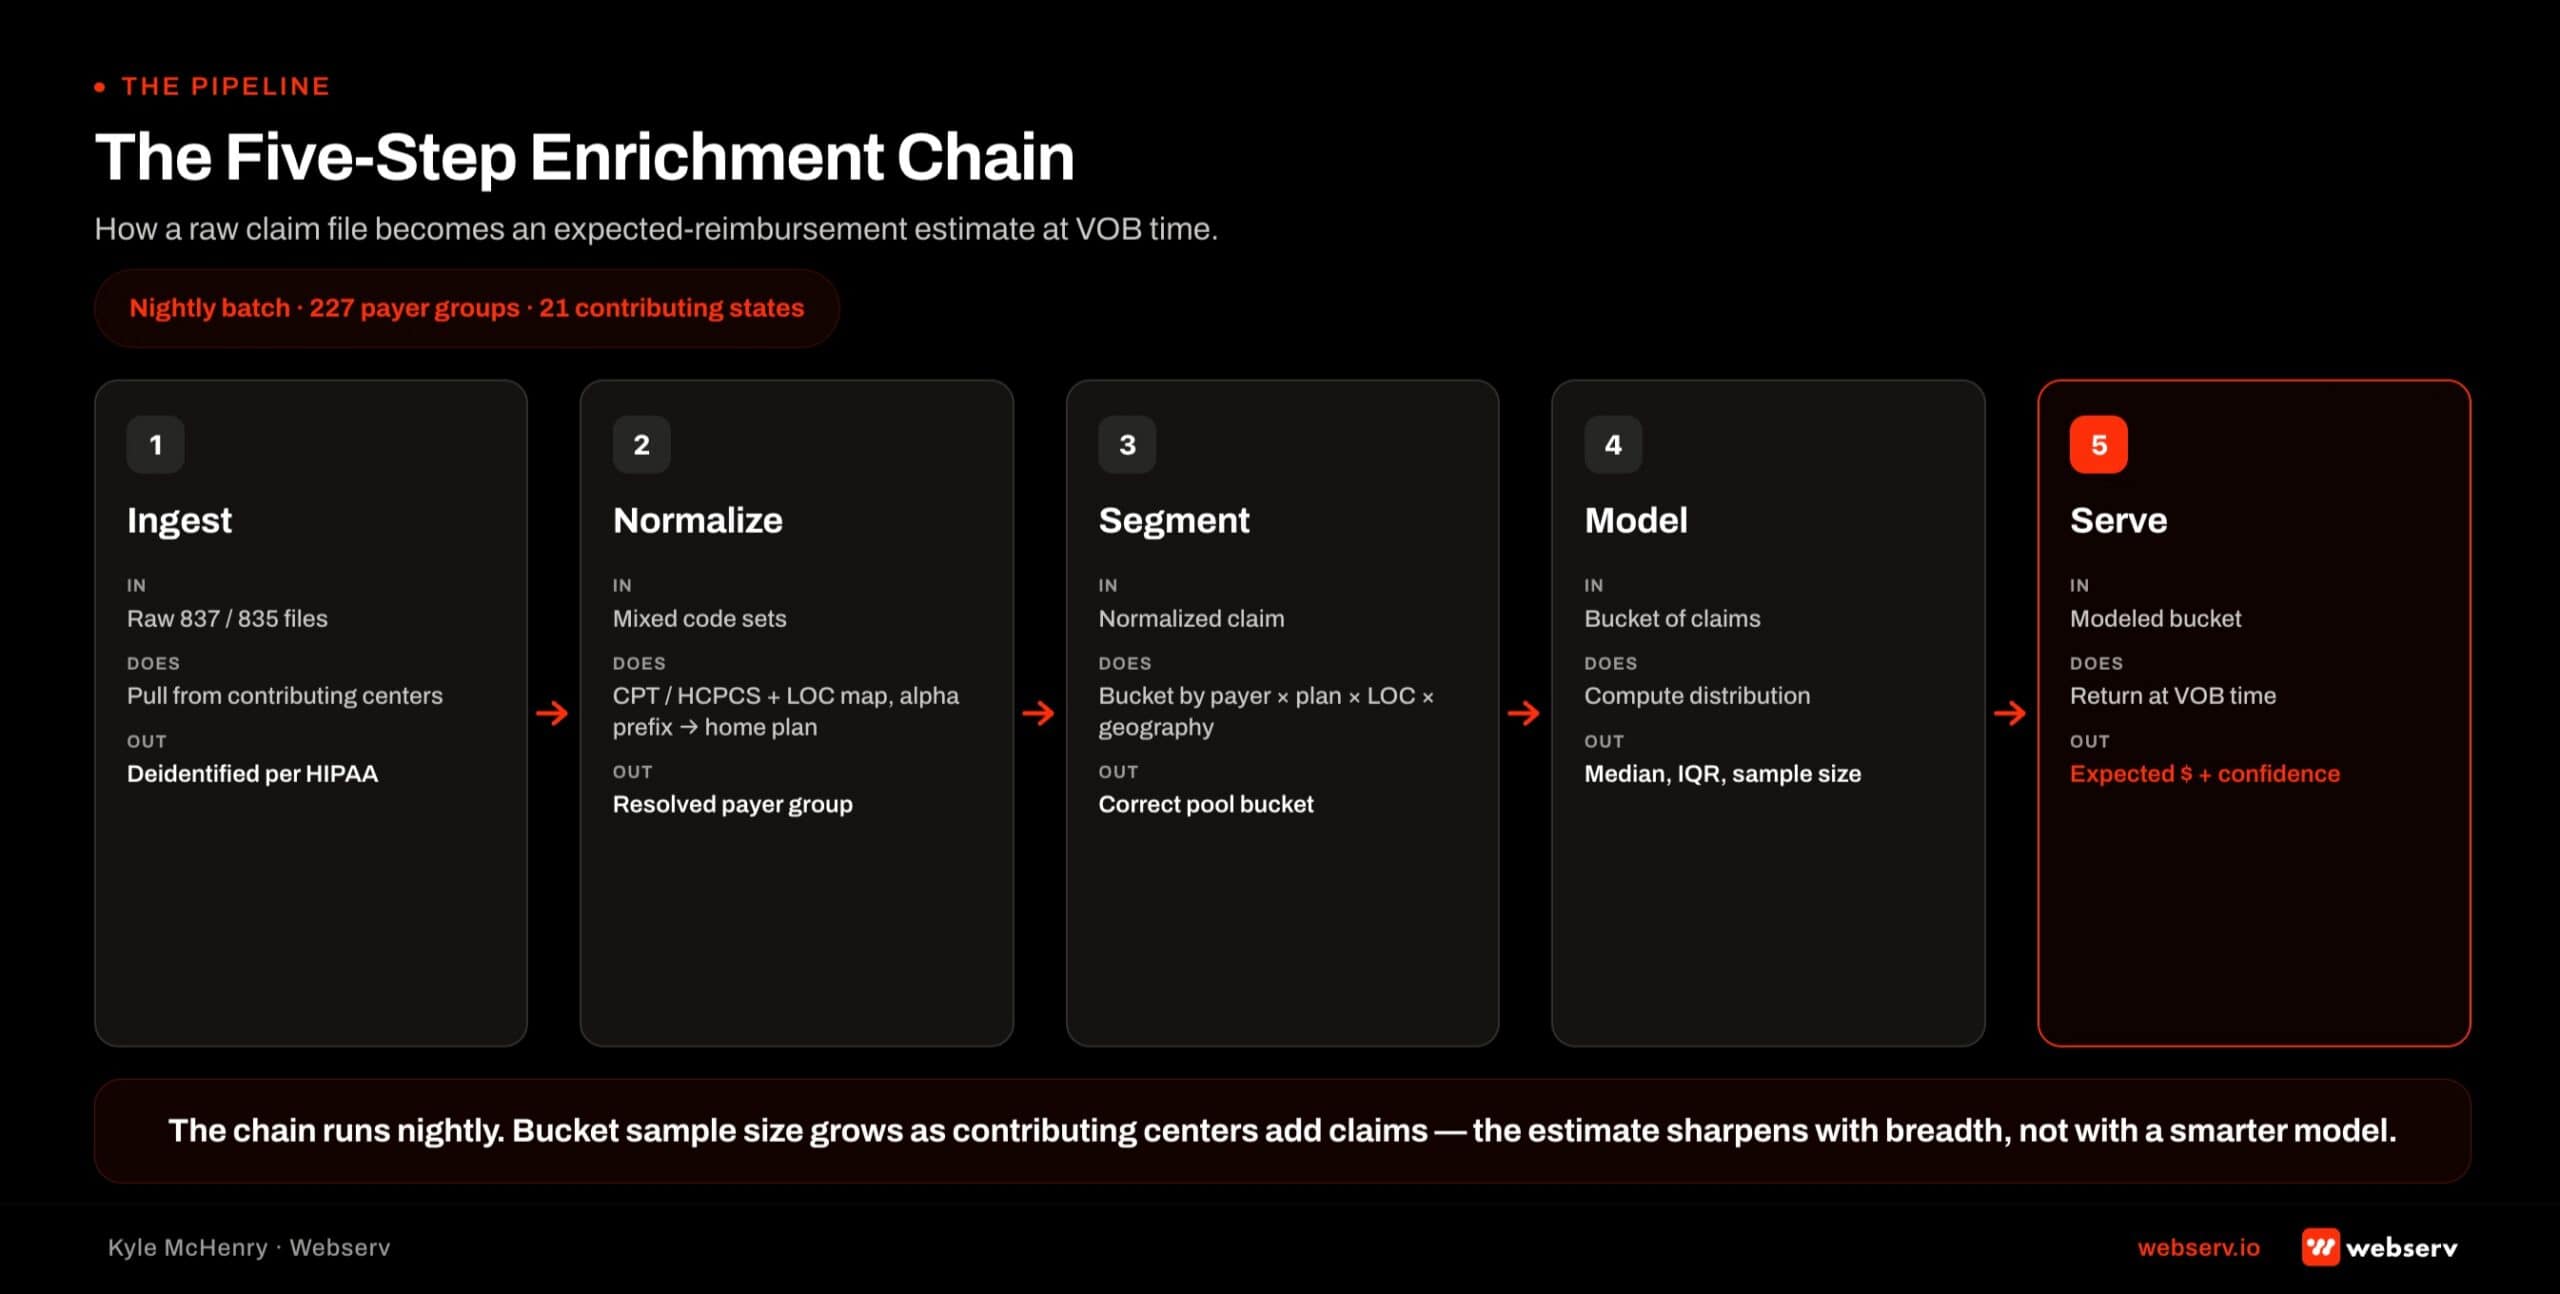
Every claim that enters the pipeline runs through the same five-step enrichment before it lands in a benchmark cell.
Step one: normalize the payer name. Billing systems record payer names inconsistently. The same payer can appear as “BCBS Anthem,” “Anthem Blue Cross,” “ANTHEM BC BS,” and a dozen other variations depending on how the biller entered it.
Normalization resolves these variants to a canonical payer entity so the downstream benchmark cell is keyed correctly.
Step two: resolve the BCBS alpha prefix to a home plan. For any BCBS claim, we read the three-character alpha prefix off the member ID and resolve it to the specific home plan entity that holds the coverage contract.
This is the resolution the alpha prefix piece covers in depth. Our mapping table carries 21,800 prefix-to-home-plan entries.
Step three: classify network status. Was the claim adjudicated in-network or out-of-network relative to the contributing facility. This classification determines which benchmark cell the claim populates. In-network and out-of-network rates for the same payer group can differ by a factor of 3x or more.
Step four: classify the reimbursement method. Was the payer using a per-diem rate, a case rate, a percentage-of-charges arrangement, or some other structure. Different reimbursement methods produce different rate signals and need to be benchmarked separately.
Step five: compute the per-day allowed amount. Given the reimbursement method, network status, and adjudication details, calculate the per-day dollar figure that becomes the actual benchmark unit.
That per-day amount is what surfaces on a rate lookup for a new admit at the same payer / home plan / level of care / state combination.
At the end of the chain, the claim populates a specific rate cell keyed on payer group, alpha prefix (for BCBS), home plan, state, level of care, and network status.
The benchmark tables recompute that night, and the next customer running an eligibility check against that combination sees the updated benchmark the following morning.
OPERATOR INSIGHT
HHS’s Safe Harbor de-identification standard at 45 CFR 164.514(b) requires removing 18 specific patient identifiers (name, address, SSN, dates, MRN, and 13 others) before claims data can be treated as de-identified under HIPAA. That is the compliance floor every contributing center’s ingest has to meet before a single claim enters the pool. It also means the pool cannot re-identify any patient, even in aggregate — the modeling operates on structural payer-plan-geography buckets, never on individual claims.
A rate cell with 500 claims from 2 facilities scores worse than one with 150 claims from 5 facilities. Payers negotiate facility-specific arrangements; billing errors concentrate within one contributor. Three or more independent facilities converging on the same rate is a fundamentally different signal than 500 claims from a single source.
Why breadth is the binding constraint
Trevor asked me whether the network effect kicks in more from raw claims per payer group, more prefix coverage, or faster refresh cadence. The technically correct answer is all three, but they are not equally important, and the honest answer is more defensible than the hand-wavy one.
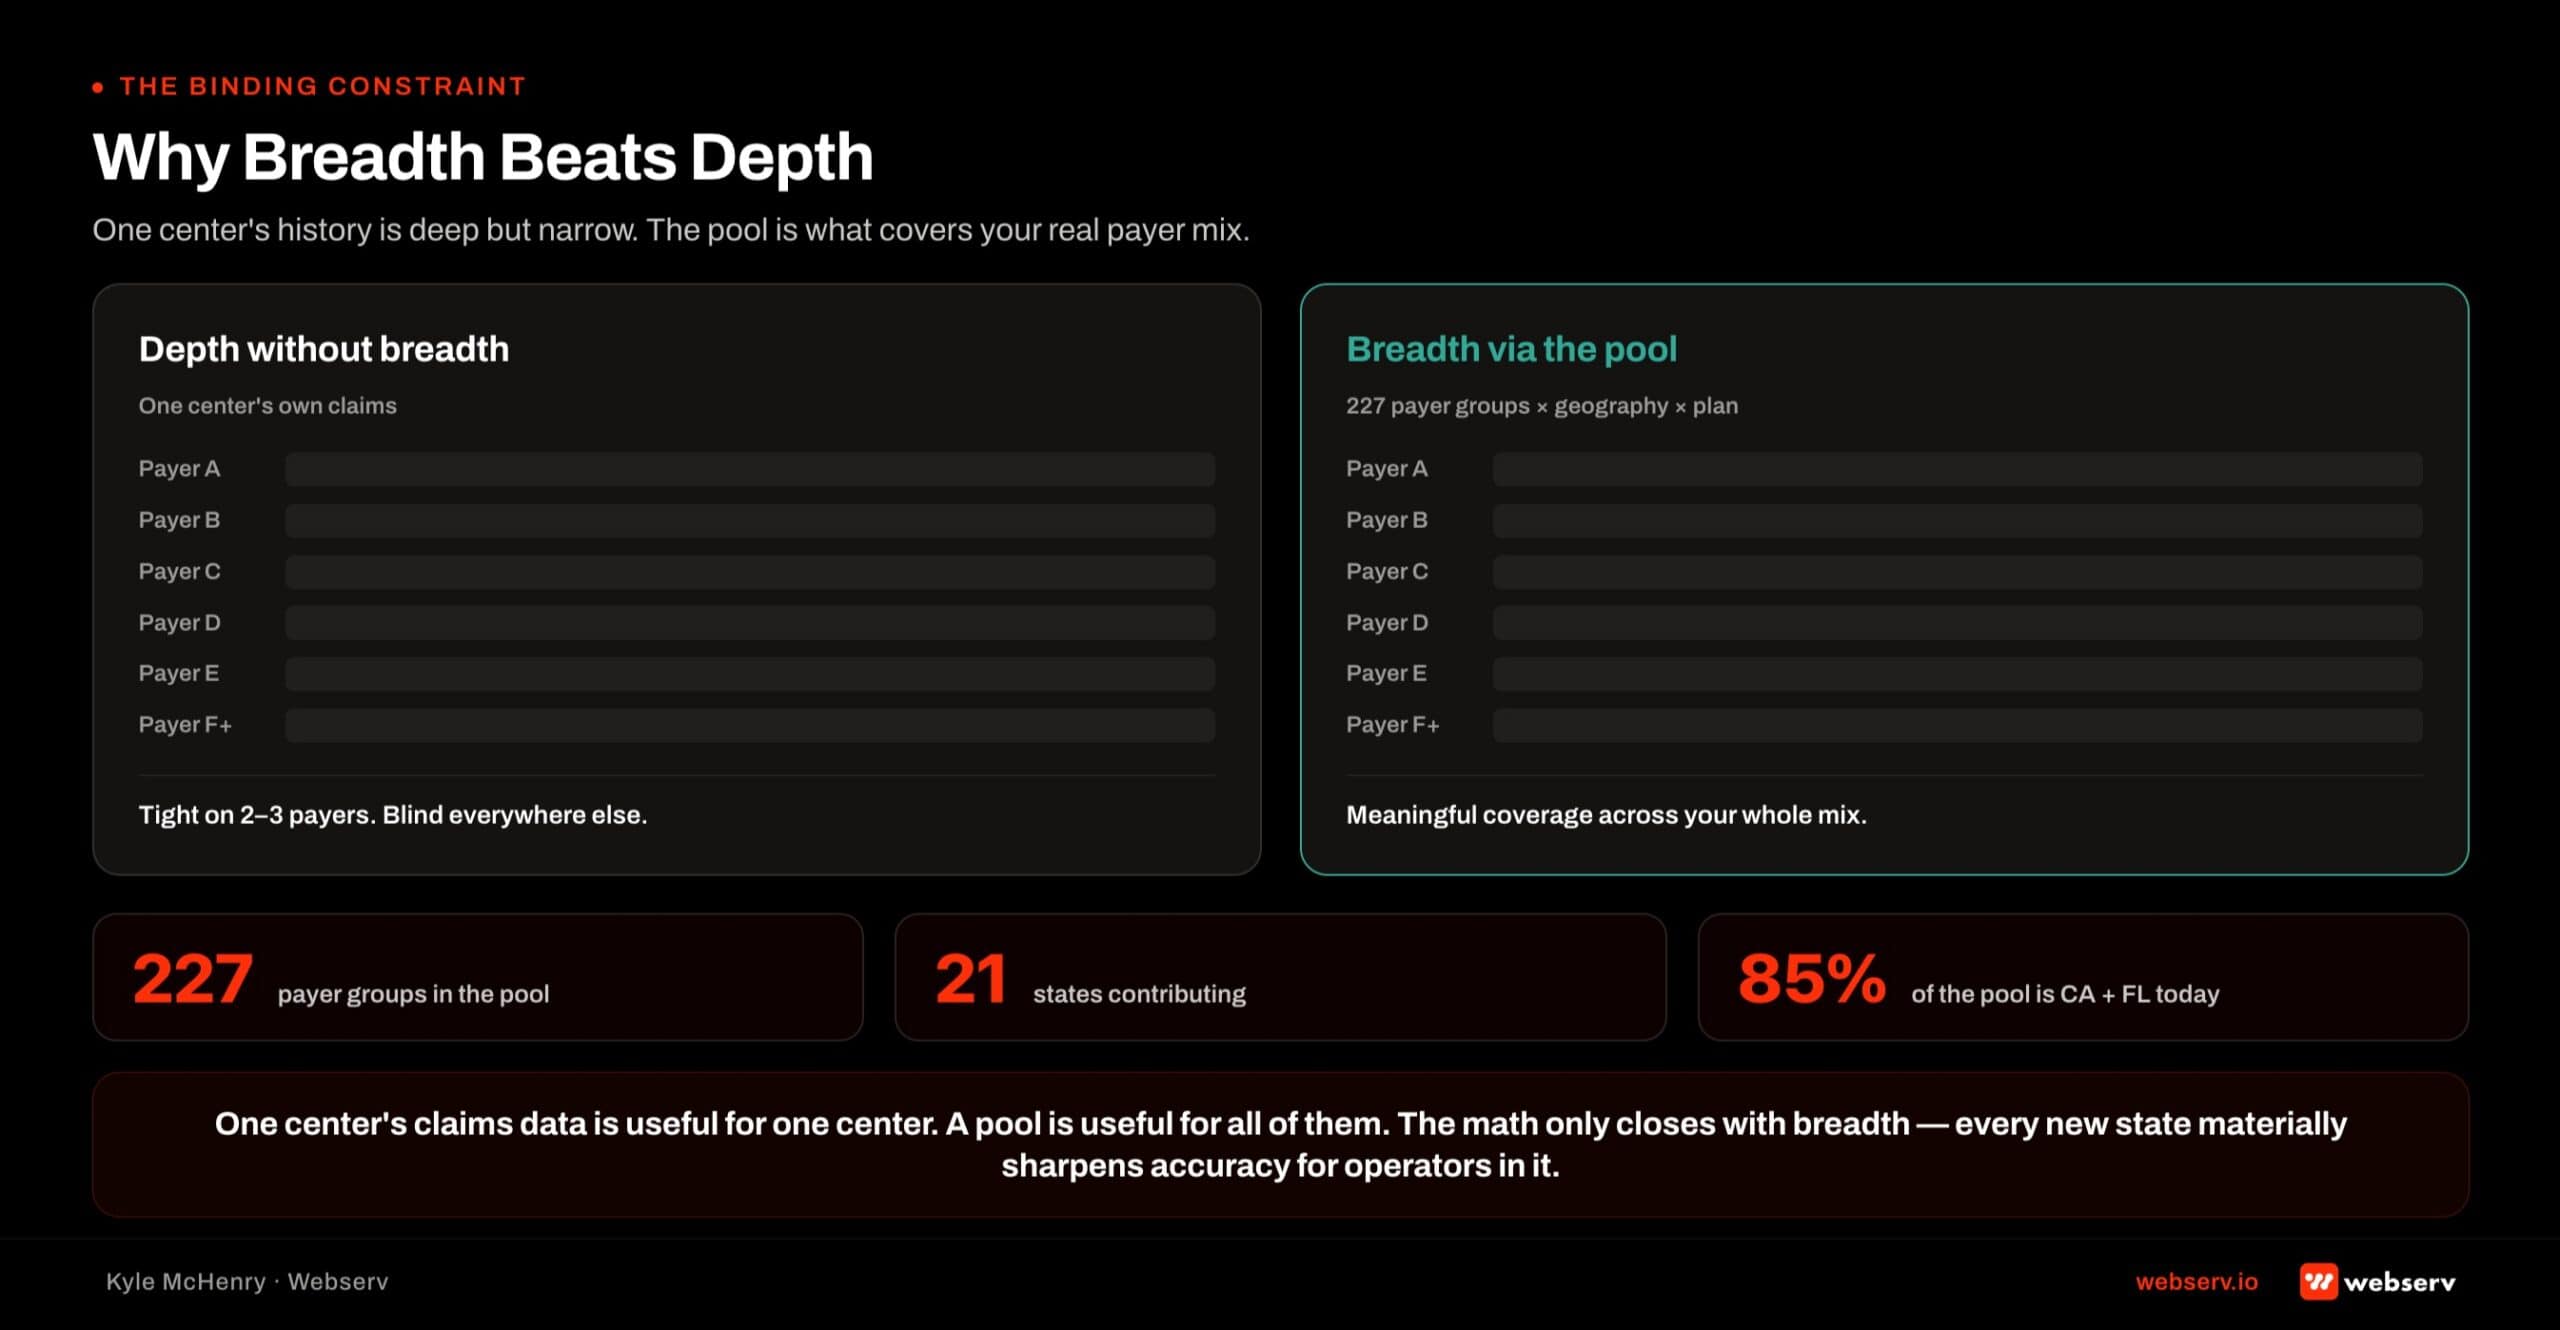
The binding constraint is breadth. Specifically, the number of distinct facilities contributing to a given rate cell.
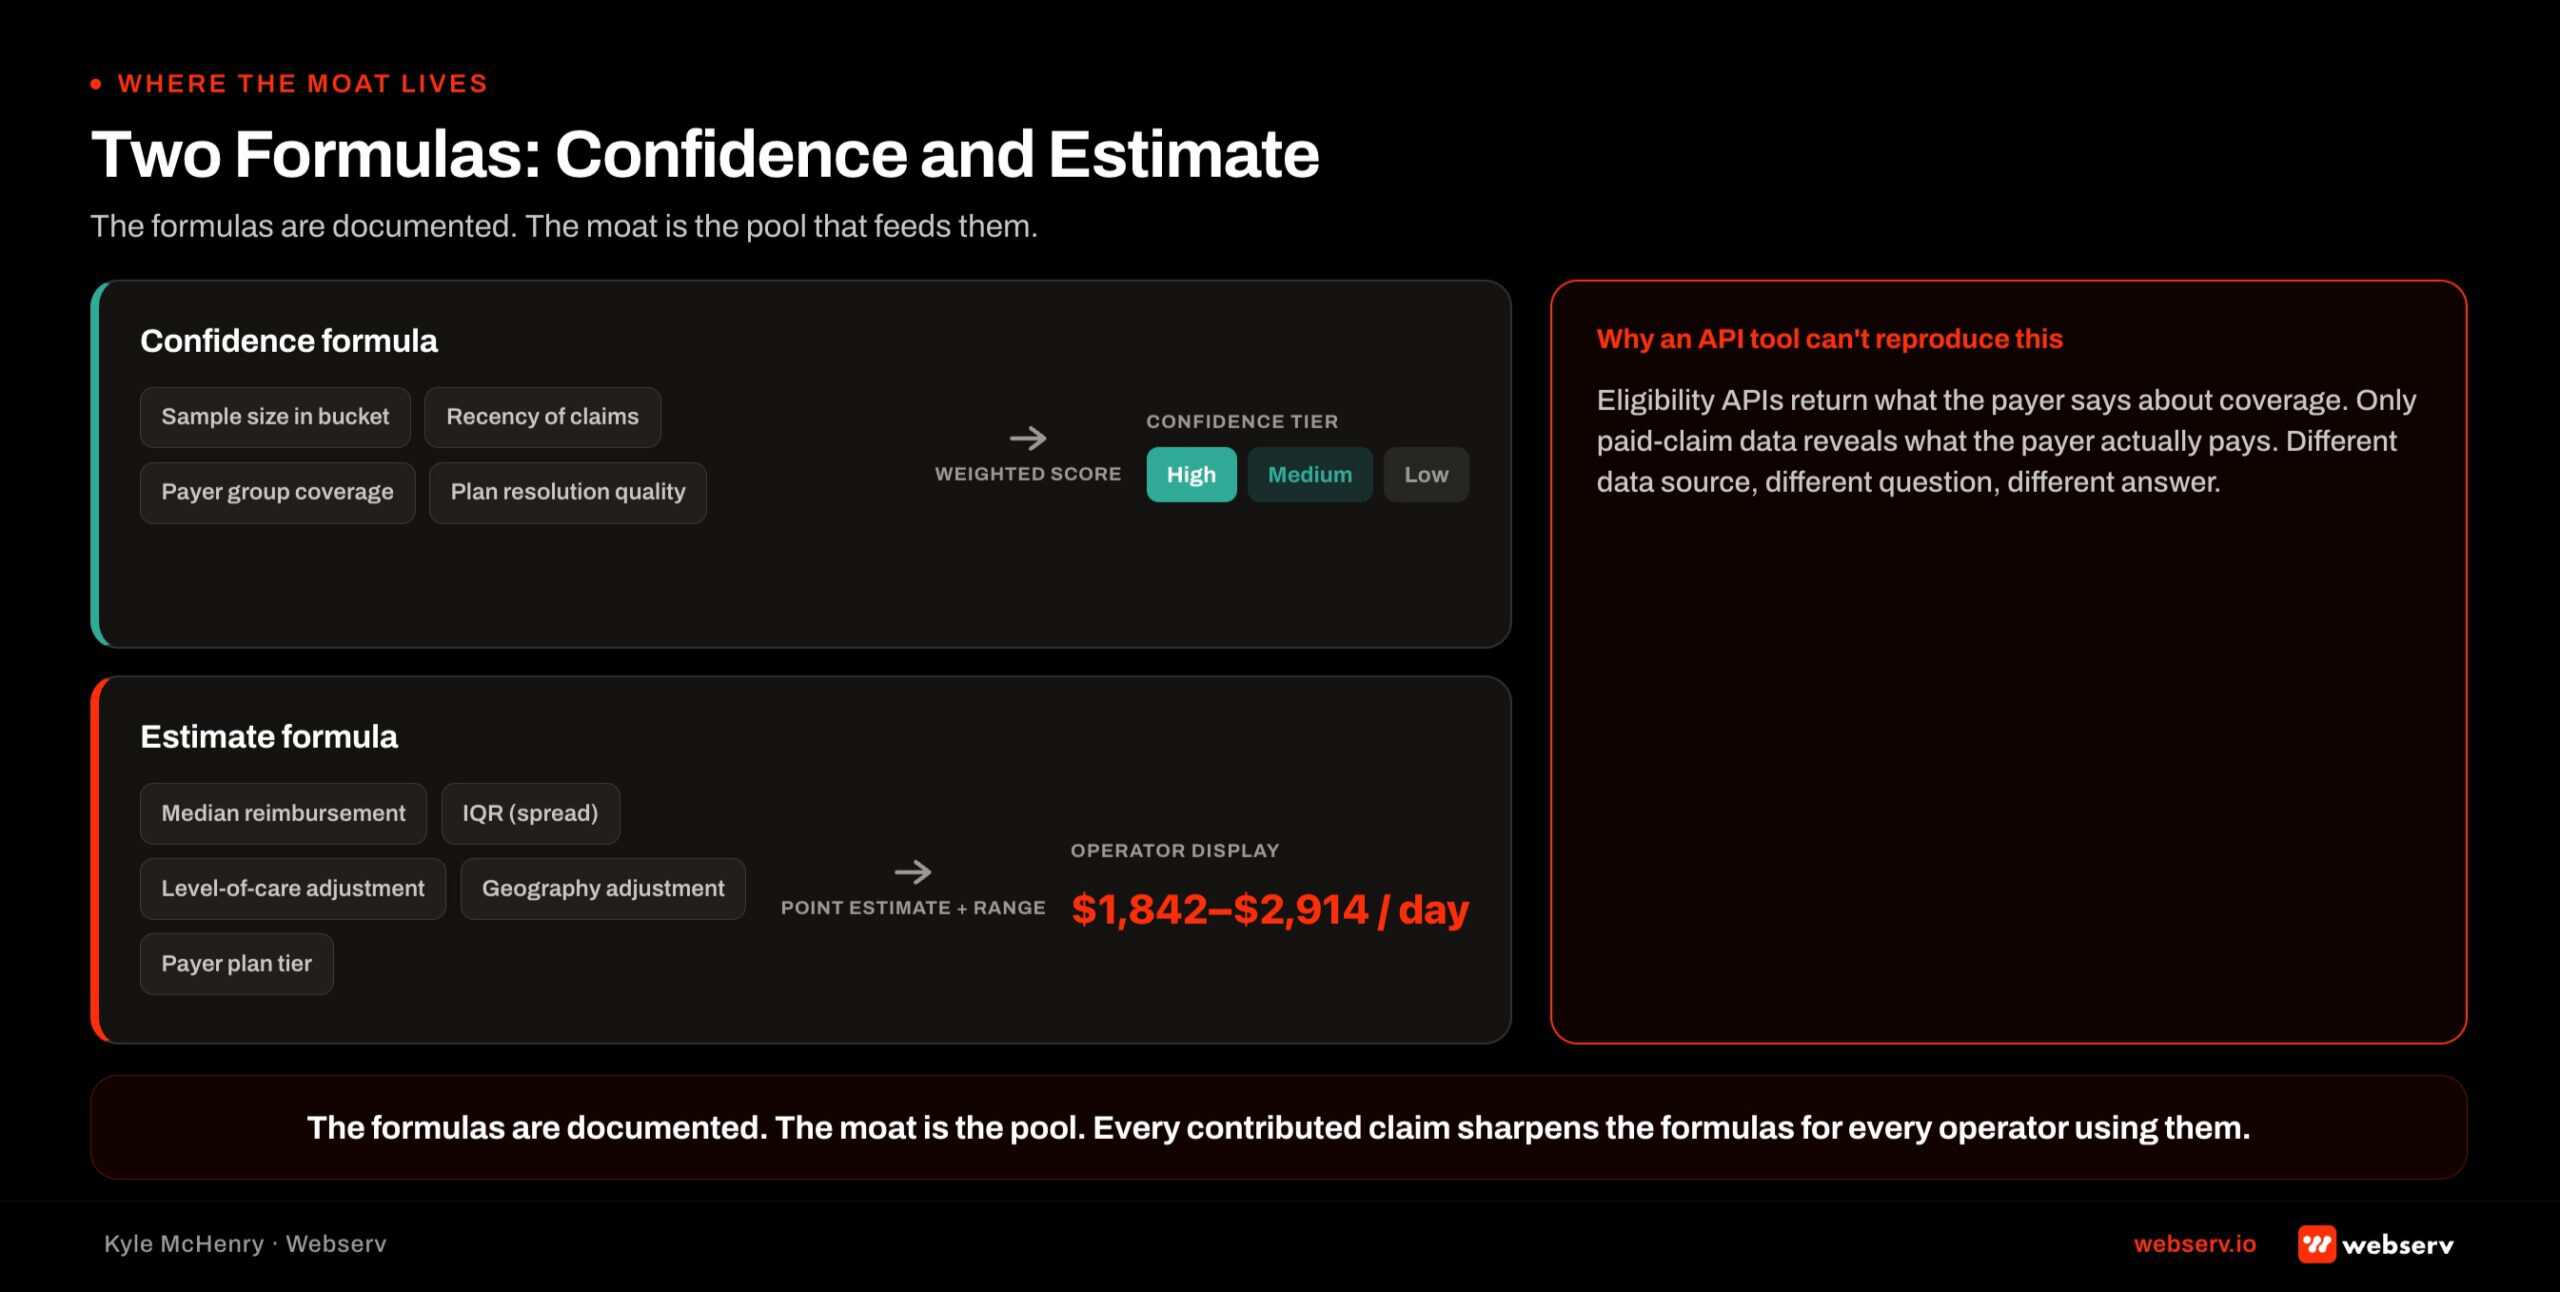
Our confidence score has a hard term that expresses this: min(1, recent_facilities / 3). If a rate cell has claims from only two facilities, its confidence is multiplied by 0.67 and cannot reach full confidence no matter how many claims those two facilities send.
If it has claims from one facility, the multiplier drops further. A cell with 500 claims from 2 facilities scores worse than a cell with 150 claims from 5 facilities.
That is the moat, stated precisely. You cannot buy your way to a trustworthy benchmark with volume from a single contributor.
The only thing that lifts the breadth term is more distinct contributing facilities, which means more customers. This is not a marketing claim about network effects. It is a coefficient in the formula.
The reason breadth beats volume is that a single facility’s rate patterns can be idiosyncratic. Payers negotiate facility-specific arrangements. Billing errors concentrate within a single facility’s data.
A rate benchmark built primarily from one contributor’s claims tells you what that one facility gets paid, not what the payer pays across the market. Three or more independent facilities converging on the same rate is a fundamentally different signal than 500 claims from a single source.
The confidence formula
The full confidence expression is:
Confidence = (effective_sample_size / (effective_sample_size + 60)) × min(1, facilities_in_last_12_months / 3)Two terms, both doing real work.
The effective sample size is a claim count where every claim is decayed by age on a 12-month half-life. A claim from this month counts as 1.0. A claim from twelve months ago counts as 0.5.
A claim from twenty-four months ago counts as 0.25. This means “how much data do we have” and “how current is it” are the same number in the formula. We never treat a 2022 claim as equal evidence to a 2026 one.
The breadth term is the facility-diversity gate from the previous section. Under three distinct facilities contributing to the cell within the last twelve months, confidence is multiplied by 0.67 or lower and cannot reach full confidence regardless of raw claim volume.
Directionally, for treatment center operators who want to understand what the score means: around 60 effective claims from 3+ facilities produces a confidence score around 0.50.
Around 90 effective claims from 3+ facilities produces a confidence score around 0.60, and we label the basis as “broad and recent.” Around 240 effective claims produces a confidence score around 0.80.
We flag a rate as low-confidence when any of three conditions is true. Fewer than 20 claims in the last 12 months. Fewer than 3 distinct facilities contributing. Or the newest claim in the cell is more than 18 months old.
Those thresholds are not decorative. They gate which rate lookups surface as “here is the rate to plan around” versus “this cell is thin, treat the estimate with skepticism.”
The estimate formula is where the moat lives
Every price-transparency tool in the market shows a number. What separates PayerLenz from Payerset, Serif, Rivet, and the machine-readable-file datasets that back those products is that our estimate is not just a number decorated with a confidence score. The confidence score determines the number.
The estimate is computed as:
Estimate = long-run_median + (recency-weighted_median − long-run_median) × confidenceRead that carefully. When confidence in the recent data is high, we move the estimate toward what the payer is paying right now. When confidence is low, we fall back toward the long-run median. The system only chases recent data as far as it actually trusts it.
That is a different product category than a price-transparency dataset. Payerset, Serif, and Rivet can show a negotiated rate off a machine-readable file. They cannot tell an operator whether that rate is what actually gets paid, or how much to bet on it.
Our number already has its own uncertainty priced in. It is not “here is the median rate” with a note about confidence attached. It is “here is the rate to plan around, adjusted for how much we should trust the recent data.”
The mechanical implication for a treatment center operator: a rate lookup that comes back at a specific dollar amount already reflects our system’s own uncertainty about that estimate. If we are confident in the recent data, the number is close to what the payer is paying now.
If we are not, the number is anchored to a longer-run baseline that is less sensitive to recent volatility. Operators do not have to interpret the confidence score separately from the rate. The confidence is already inside the number.
Why eligibility API tools cannot replicate this
Every commercial VOB tool built for behavioral health, and every eligibility module inside every RCM stack, is built on payer eligibility APIs. The specific transaction is the 271 response, the electronic reply to a 270 eligibility inquiry.
The 271 response tells the provider what the policy says. Deductible position, benefit design, coverage active status, out-of-network benefit percentages, coinsurance, prior authorization requirements. All of that is real, useful data. None of it carries information about what the payer has actually paid on adjudicated claims from similar patients.
You can add every feature you want to an eligibility product and never produce a realized-payment benchmark. The data is not in the pipe.
To produce rate benchmarks, a tool has to have access to adjudicated claims across many providers, which means convincing operators to contribute their remits into a shared pool. That is the thing that takes years and trust to build, not a sprint.
The eligibility API layer and the claims data layer are different data infrastructures with different customer relationships. Any tool that wants to close the gap between “coverage confirmed” and “rate expected” has to become a claims-data tool. That is not a feature addition. That is a category change.
What customers see improve as the pool grows
For a treatment center operator using PayerLenz today, the day-to-day effect of pool growth shows up in three specific ways.
More rate lookups come back with a confidence score attached rather than a “thin data” flag. Thin cells are what surface when a specific payer / home plan / level of care combination does not yet have enough contributor breadth to produce a defensible estimate.
As more facilities contribute claims, those thin cells become populated cells, and the coverage of high-intent lookups improves.
Existing estimates get sharper. A rate cell that already has coverage improves as more contributor breadth lifts the confidence score.
That raises the weight on recent data inside the estimate formula, which pulls the number closer to what the payer is paying right now. The operator sees an estimate that tracks the current market more precisely.
Coverage extends into new alpha prefixes and home plans. Every new contributor brings claims tied to member IDs from BCBS home plans that were previously thin or absent in our data. Prefix-level lookups that returned broad fallback estimates start returning home-plan-specific estimates as the underlying data catches up.
None of this is instantaneous. The pool grows on the order of new customers joining, not on the order of new claims arriving. But the direction is consistent, and every operator contributing claims to the pool is materially improving the tool for every other operator in the pool.
Frequently Asked Questions
Kyle McHenry is Co-founder and Head of Product at Webserv, where he leads the PayerLenz reimbursement intelligence product. He works on the claims data pipeline, benchmark methodology, and the specific technical mechanics behind PayerLenz’s alpha prefix resolution and confidence scoring layers. If you want to see what your admits look like under a confidence-weighted rate lens, start with a Visibility Gap conversation.