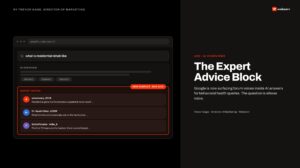
A treatment center operator asked me last quarter what their paid social agency should be producing. The agency was running 14 static image ads in rotation and had been for six months.
Cost per admit had climbed 22 percent over that window. The operator wanted to know whether the issue was the agency, the targeting, or the budget.
The issue was the format mix. The agency was producing in the format that was easiest to make, not the format mix the platform rewards.
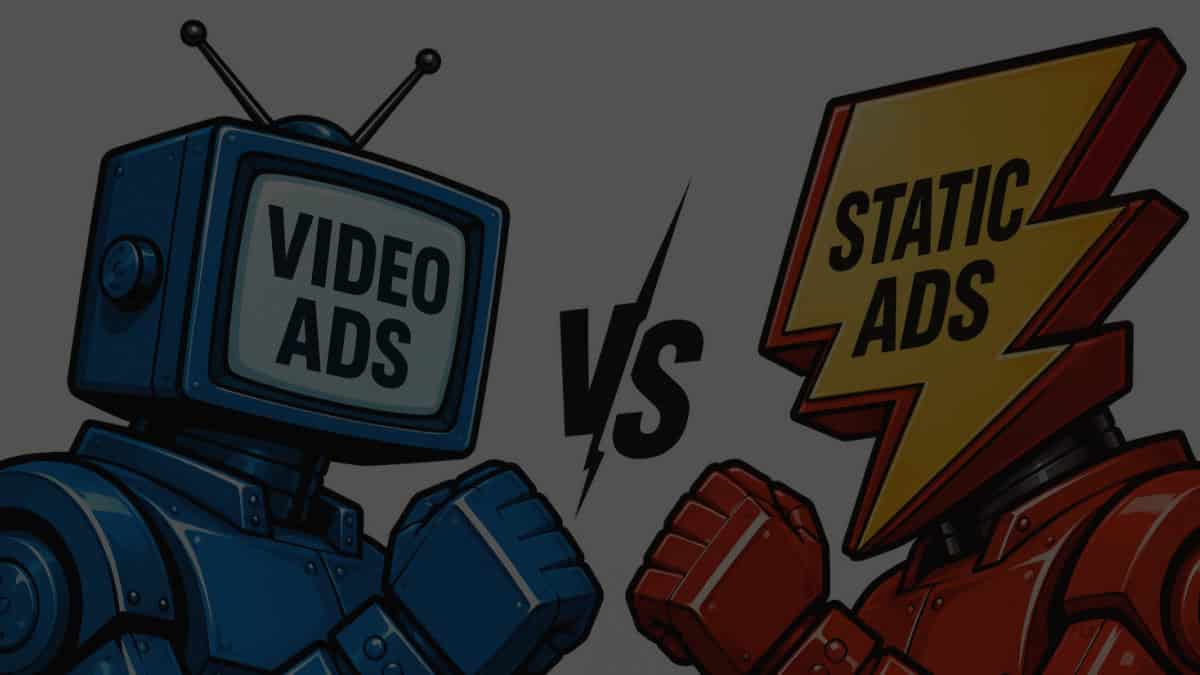
Meta’s algorithm in 2026 routes attention and conversion through a specific format hierarchy, and treatment centers running static-only ad mixes are competing on a single axis while their competitors compete on three.
Inside Webserv’s paid social program for treatment centers, we run a three-format creative stack across video, static image, and motion ads.
The right mix depends on the campaign objective, the audience temperature, and the operator’s creative production capacity. This article walks through what each format actually produces in behavioral health, when each one wins, and the 2026 Meta benchmark data that should shape the format-mix decision.
Key Takeaways
- Video ads on Meta produce 27 percent higher click-through rates than static images on average across all verticals, with the CTR gap holding in healthcare specifically. Video CTR runs 1.14 percent vs. static at 0.90 percent based on 2026 benchmark data.
- Static image ads still earn a place in the mix. They cut CPM by roughly 38 percent in cold audiences, run faster to produce, and outperform video for SKU-style retargeting where the visual catalog is the message.
- Motion ads (animated graphics, kinetic typography, short loops) have emerged as the third format class in 2026 and are increasingly the default for growth-focused accounts. They share video’s scroll-stop advantage and static’s production speed.
- The right behavioral health format mix in 2026 is roughly 60 to 70 percent video, 20 to 25 percent motion, and 10 to 20 percent static. Single-format accounts (static-only or video-only) consistently underperform mixed accounts at the same spend level.
- Mobile-first creative is required for behavioral health specifically. 94 to 98 percent of Meta traffic in healthcare is mobile, and the format-mix decision should be made against mobile placements (Stories, Reels, mobile feed) as primary rather than desktop placements as default.
What Each Format Actually Produces
The three creative format classes on Meta operate on different mechanics and produce different outcomes. The shorthand “video beats static” misses that each format has a specific job inside a working ad account.
Video Ads
Video ads carry the strongest mid-funnel conversion signal of any Meta creative format.
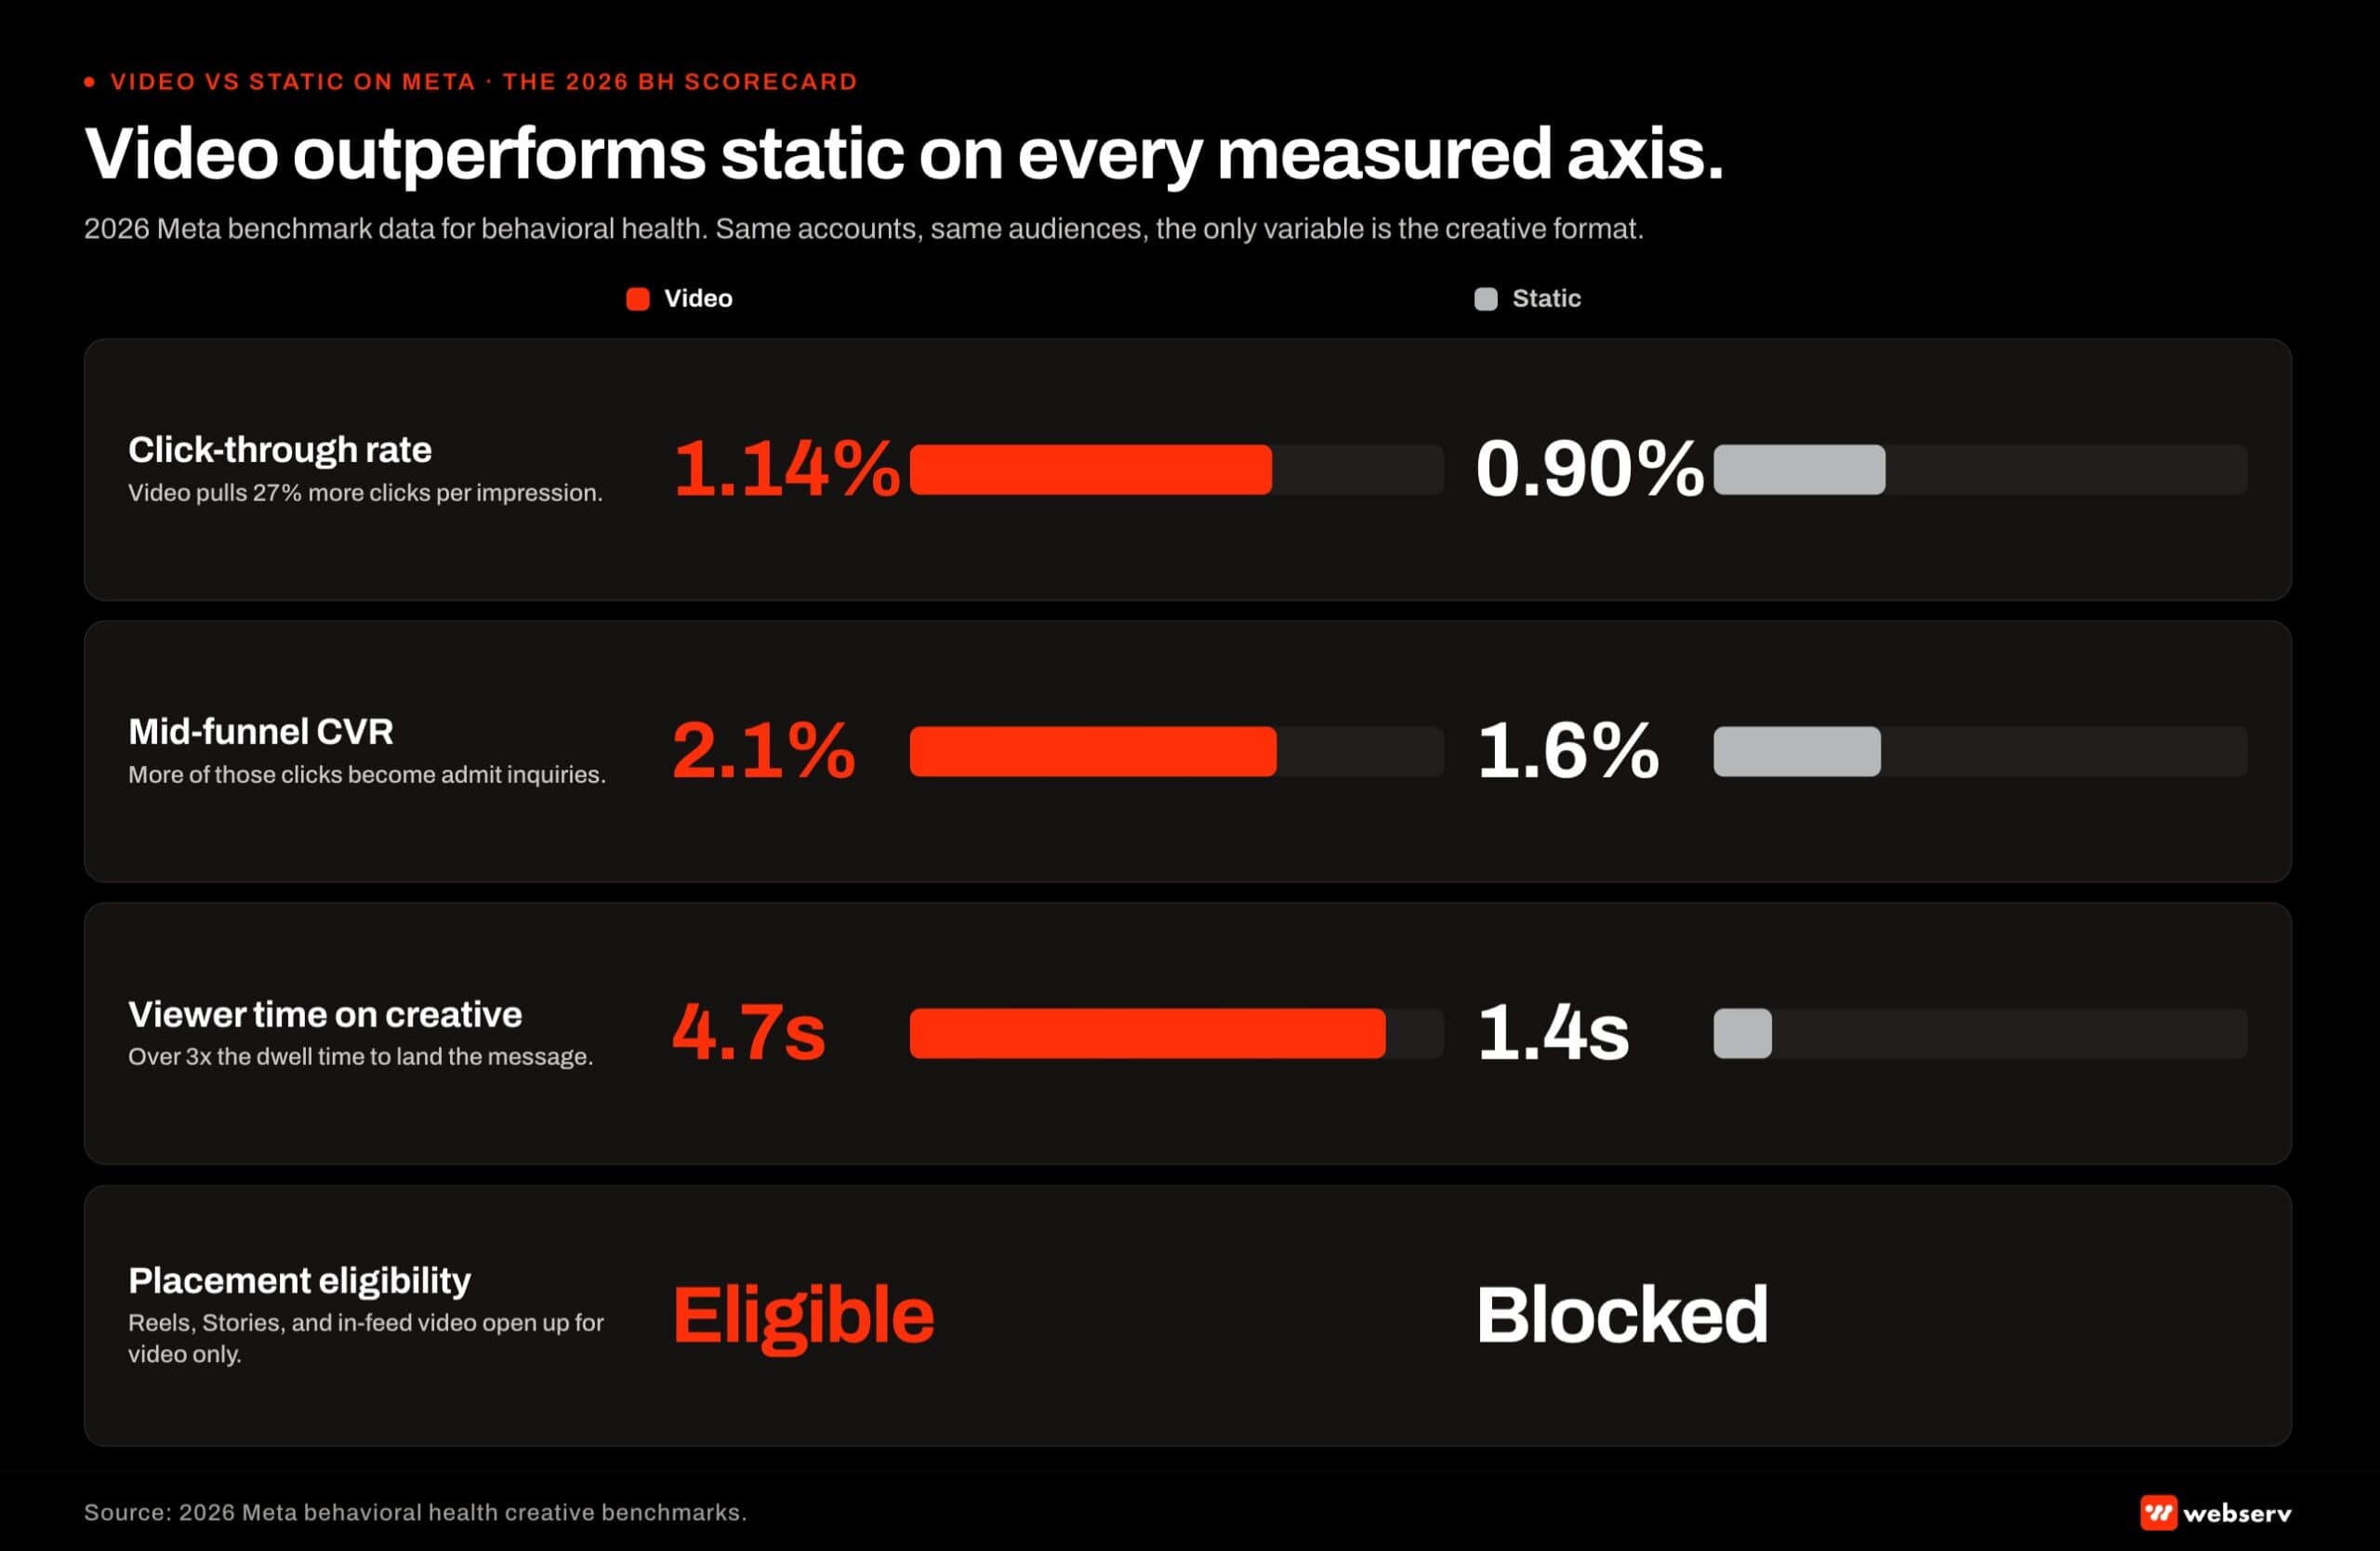
The 2026 benchmark data shows video CTR averaging 1.14 percent against static at 0.90 percent, with mid-funnel CVR running 2.1 percent for video vs. 1.6 percent for static. Viewer time on creative averages 4.7 seconds for video against 1.4 seconds for static.
For behavioral health specifically, video earns its place when the message requires more than a headline. Clinical director introductions, facility tours, and credentialed-clinician explainer content benefit from video’s longer attention window.
Family-member testimonials need careful scripting to respect 42 CFR Part 2 patient identification rules, but when done well they produce the human-credibility signal that motion plus audio plus face combine to deliver.
Video also pulls disproportionate share from Meta’s algorithm. The platform’s optimization model in 2026 weights videos toward Reels, in-feed video, and Stories placements that family-member traffic spends most of its time in.
A treatment center running zero video is invisible in the placements where most of its audience actually scrolls. The best Meta ad formats for behavioral health in 2026 covers the placement-by-placement format reference.
The cost is production. A single broadcast-quality video runs $1,500 to $8,000 per concept depending on production approach.
A creative cadence of 8 to 15 net-new video concepts per month for an active behavioral health paid social program runs $20,000 to $60,000 per month in pure creative spend on top of media budget.
Static Image Ads
Static image ads still hold an underappreciated role in 2026 despite the video performance gap. Their value comes from three mechanics: lower CPM in cold audiences, faster production cycles, and specific use cases where the image itself is the message.
Cold-audience CPM advantage matters most for prospecting tests. Static images cut CPM by roughly 38 percent vs. video in cold audiences, which means a treatment center testing new audience segments can run 10 to 15 static concepts at the cost of 3 to 4 video concepts.
For audience exploration, the static-heavy approach produces faster learning at lower cost.
Production speed matters for treatment centers with limited creative capacity. A static concept can ship in 24 to 48 hours from briefing to live. A video concept usually requires 1 to 3 weeks.
Operators with seasonal campaigns or rapid-response needs (a payer-mix shift, a competitor closure, a regional crisis) often need static-fast creative to react in market timing.
Specific behavioral health use cases where static outperforms video include accreditation badge displays (the visual is the message), facility photography in feed placements (the building is the message), and credentialed clinician headshots with named bylines (the credential is the message).
Condition-specific landing page drivers also favor static, where the image carries the targeting signal more cleanly than video can, especially when paired with strong landing page optimization.
The trap with static is overuse. Static-only ad accounts in behavioral health lose 5 to 10 percent cost per admit per quarter to creative fatigue and missed placements (Reels, in-feed video) that static cannot occupy.
Motion Ads
Motion ads emerged as the third format class through 2025 and 2026 and now warrant their own category in the creative stack. Motion ads include animated graphics, kinetic typography, short looping animations, and hybrid formats that combine static photography with motion overlays.
Motion sits between static and video on every load-bearing axis. Production cost runs $300 to $1,500 per concept, materially lower than video and slightly above static.
Production speed runs 2 to 5 days, between static’s 24-48 hours and video’s 1-3 weeks. CTR and CVR performance lands closer to video than to static in most behavioral health tests we have run.
The mechanic that makes motion work in 2026 is the algorithm. Meta’s feed optimization weights any motion content over fully-static content, which means motion ads earn the scroll-stop and placement-distribution advantages that pure-static ads cannot.
Family-member traffic stops scrolling when something moves, regardless of whether the movement is a video of a clinical director or kinetic typography of a treatment statistic.
For behavioral health specifically, motion ads work well for statistics and data presentation (the moving number is the message), text-heavy explainers that would feel slow as video, and accreditation displays with motion accent (the badge becomes alive).
Stories and Reels placements also reward motion, since motion is the format expectation in those slots rather than the exception.
The trap with motion is treating it as a video shortcut. Motion ads that are “cheap video” with stock footage and template animation feel cheap and produce worse results than well-crafted static.
Motion ads that are purpose-built for the format (typography-led, data-led, accreditation-led) outperform their cost.
The Format Mix Math for Behavioral Health
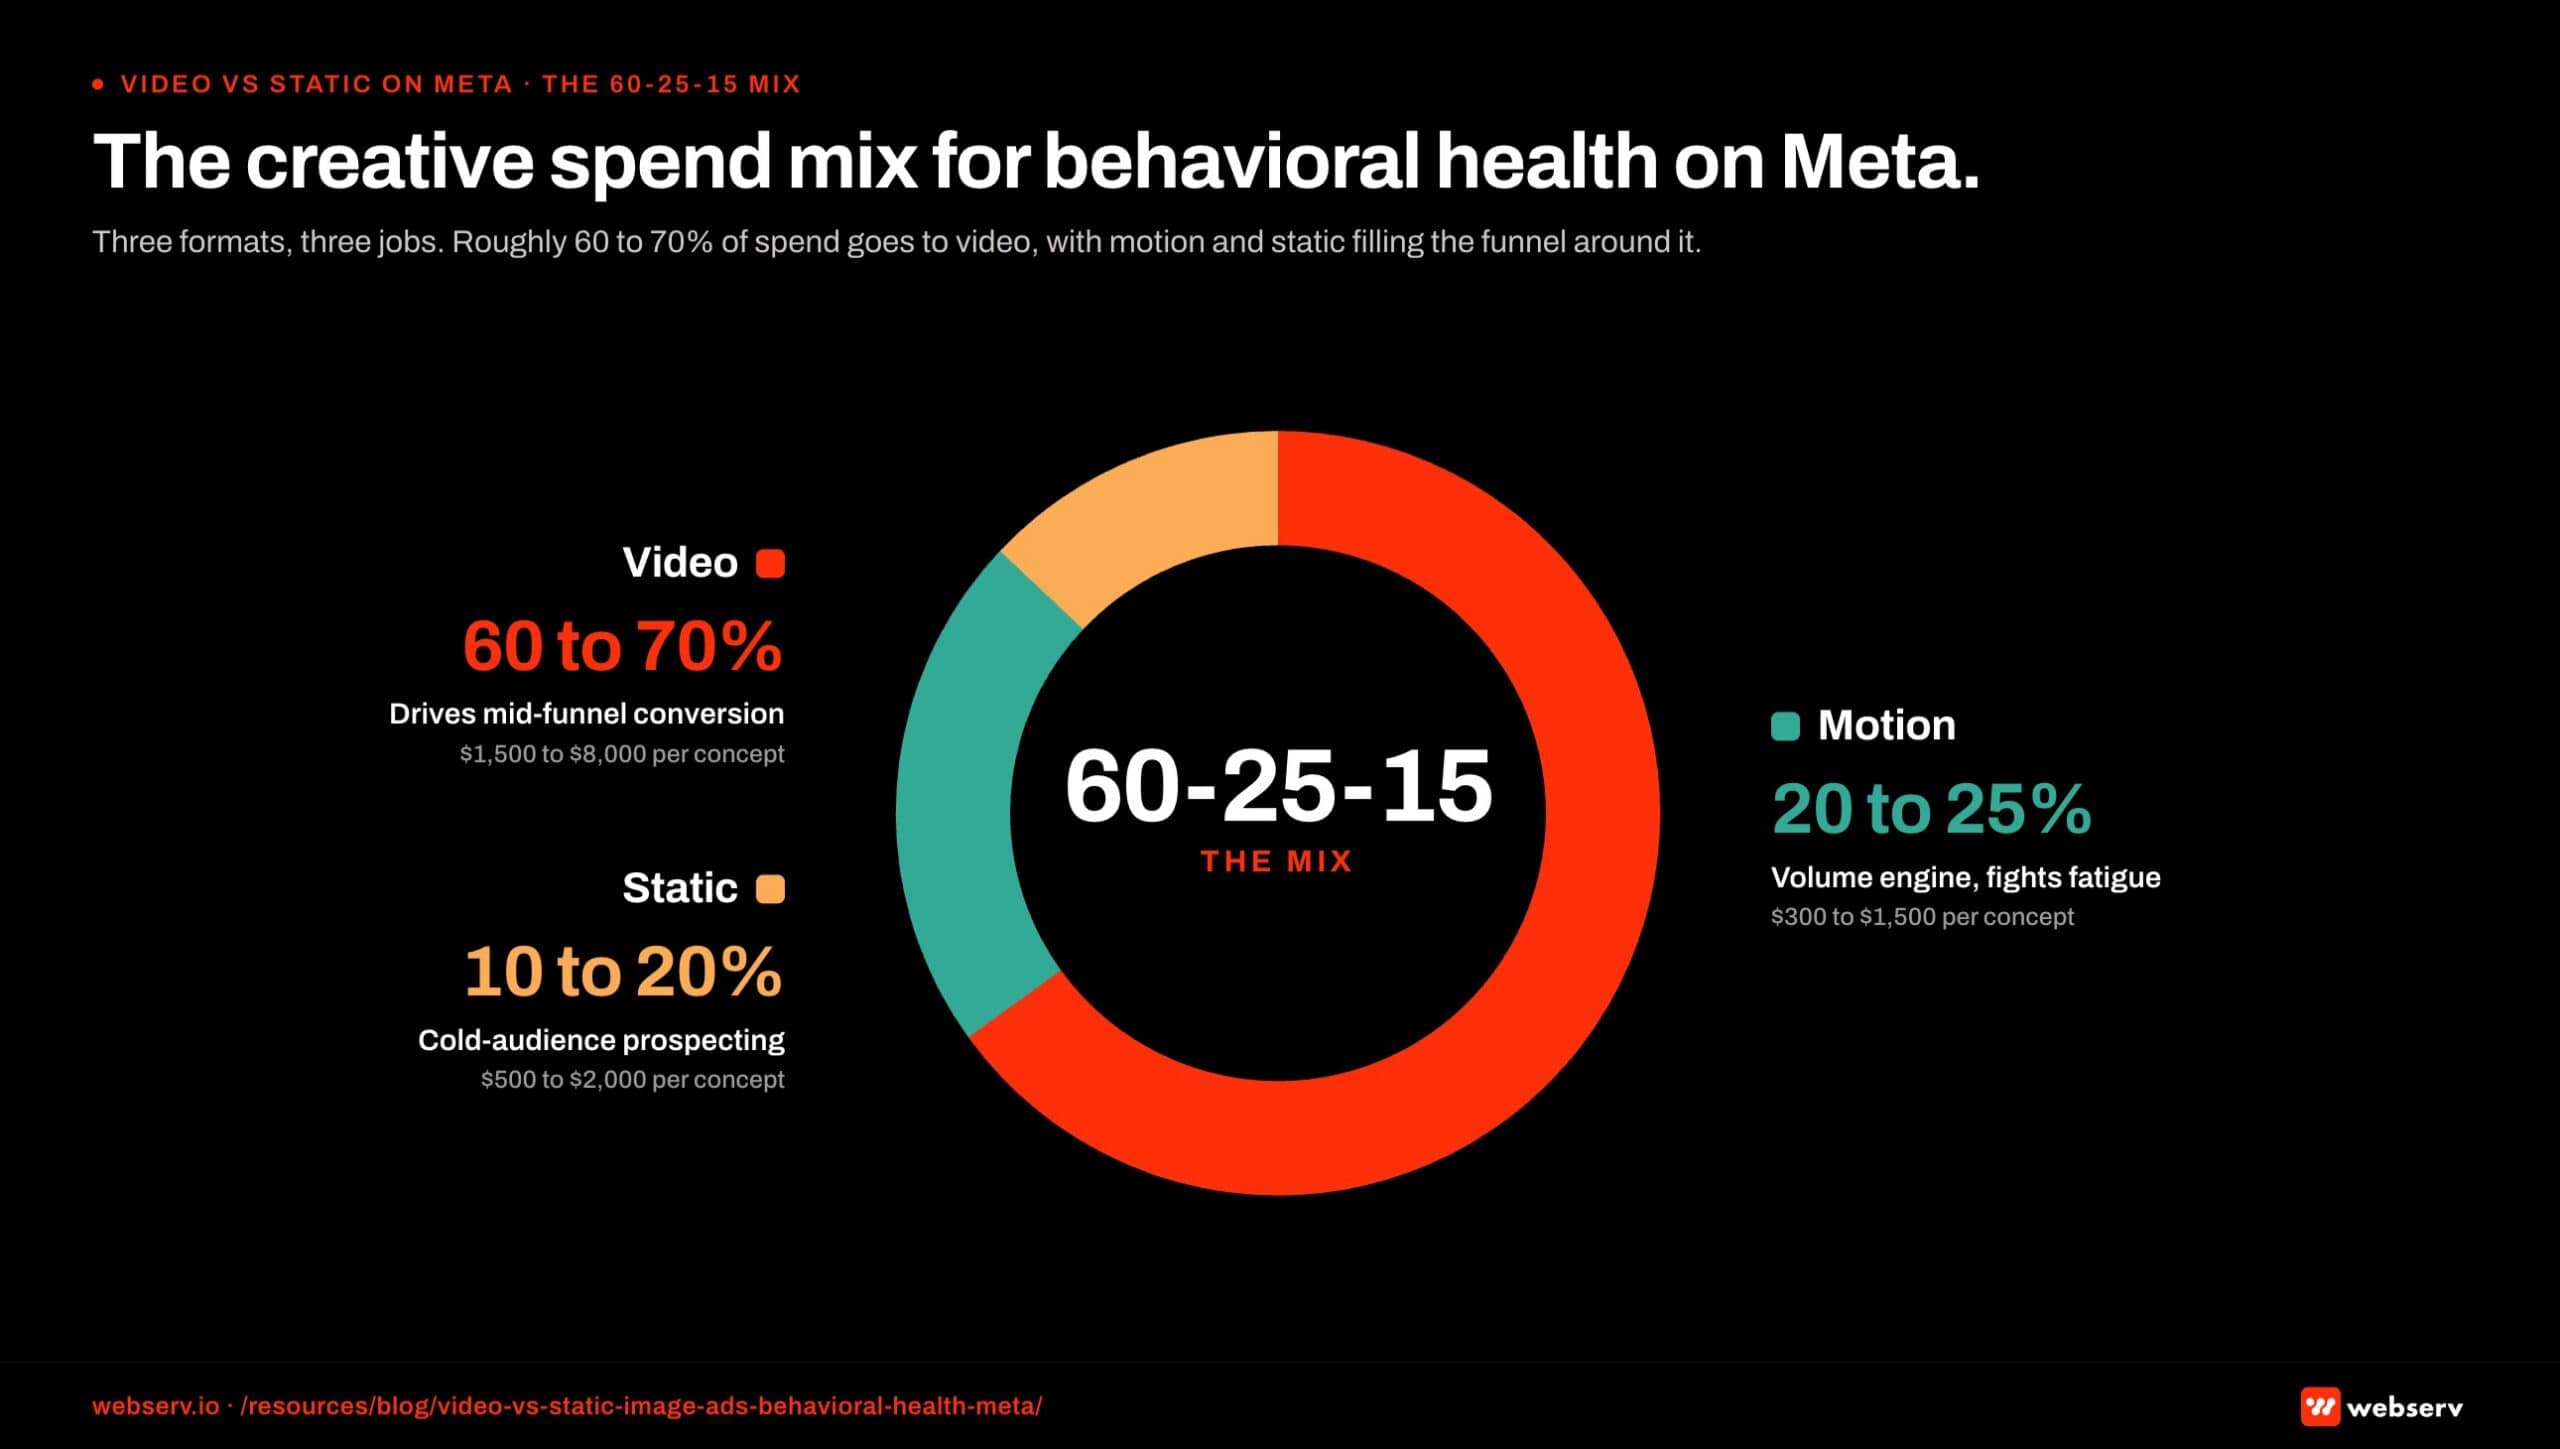
The right behavioral health paid social creative mix in 2026 is roughly 60 to 70 percent video spend, 20 to 25 percent motion spend, and 10 to 20 percent static spend. The reasoning maps to three constraints.
First, the algorithm’s placement distribution. Meta in 2026 routes substantial inventory through Reels, Stories, and in-feed video placements where static formats cannot run.
A treatment center that wants to compete in those placements has to be running video and motion. The 60-70 percent video allocation tracks the share of placements where video format is the default.
Second, the cold-audience prospecting layer. Static’s CPM advantage on cold audiences makes it the right format for the 10-20 percent of spend dedicated to new-audience exploration.
Treatment centers running paid social for 12+ months should be exploring new audience segments continuously, and static keeps that exploration cost-efficient.
Third, the motion layer as the volume engine. Motion ads at $300-$1,500 per concept allow operators to ship 20-30 net-new concepts per month at production costs that would buy 4-6 video concepts. The volume advantage compounds for fighting creative fatigue across a 12-month engagement.
The 70/30 mix that some general-marketing sources recommend (video to image, no motion category) understates the role motion plays in 2026.
Adding motion as its own 20-25 percent allocation produces 15 to 30 percent better total account performance than the 70/30 split based on the behavioral health portfolio data we track.
The biggest single creative mistake treatment center operators make in 2026 is running a static-only or video-only Meta account. The platform rewards format diversity directly, and the algorithmic placement distribution alone makes single-format accounts uncompetitive against operators running the full three-format stack. The mix matters more than any single format choice.
Preston Powell, CEO of Webserv
When Each Format Wins for Behavioral Health
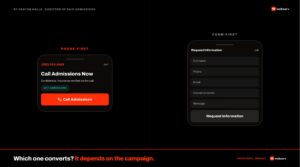
WHEN STATIC CREATIVE WINS
- Testing new hooks or angles. Static concepts turn around in hours, not days, so hypotheses ship faster.
- Direct-response calls to action. Static ads still convert well when the value prop is explicit.
- Family-member audiences. Testimonials and calm reassurance images consistently outperform video for parent and spouse targeting.
- Retargeting mid-funnel prospects. They’ve already seen your video; static reminders close.
WHEN VIDEO / MOTION WINS
- Cold prospecting on Meta. Video views open the door on high-intent audiences before static earns attention.
- Alumni and staff storytelling. Face-to-camera clinician content builds trust that a static frame cannot.
- Explaining unfamiliar modalities. Sensorimotor, DBT, PHP-vs-IOP: 15 seconds of visual explanation beats a headline.
- Cross-platform reuse. One 30-second clip becomes 6 formats across Meta, YouTube, TikTok, Reddit if produced correctly.
The format-mix decision compounds at the campaign level. Different campaign objectives reward different format weightings.
Brand awareness and new-audience prospecting. Static and motion lead, with video as the validation layer. Cold audiences respond to static’s lower CPM and motion’s scroll-stop. Video is the expensive validation step that proves out audience segments that survive the static and motion filtering.
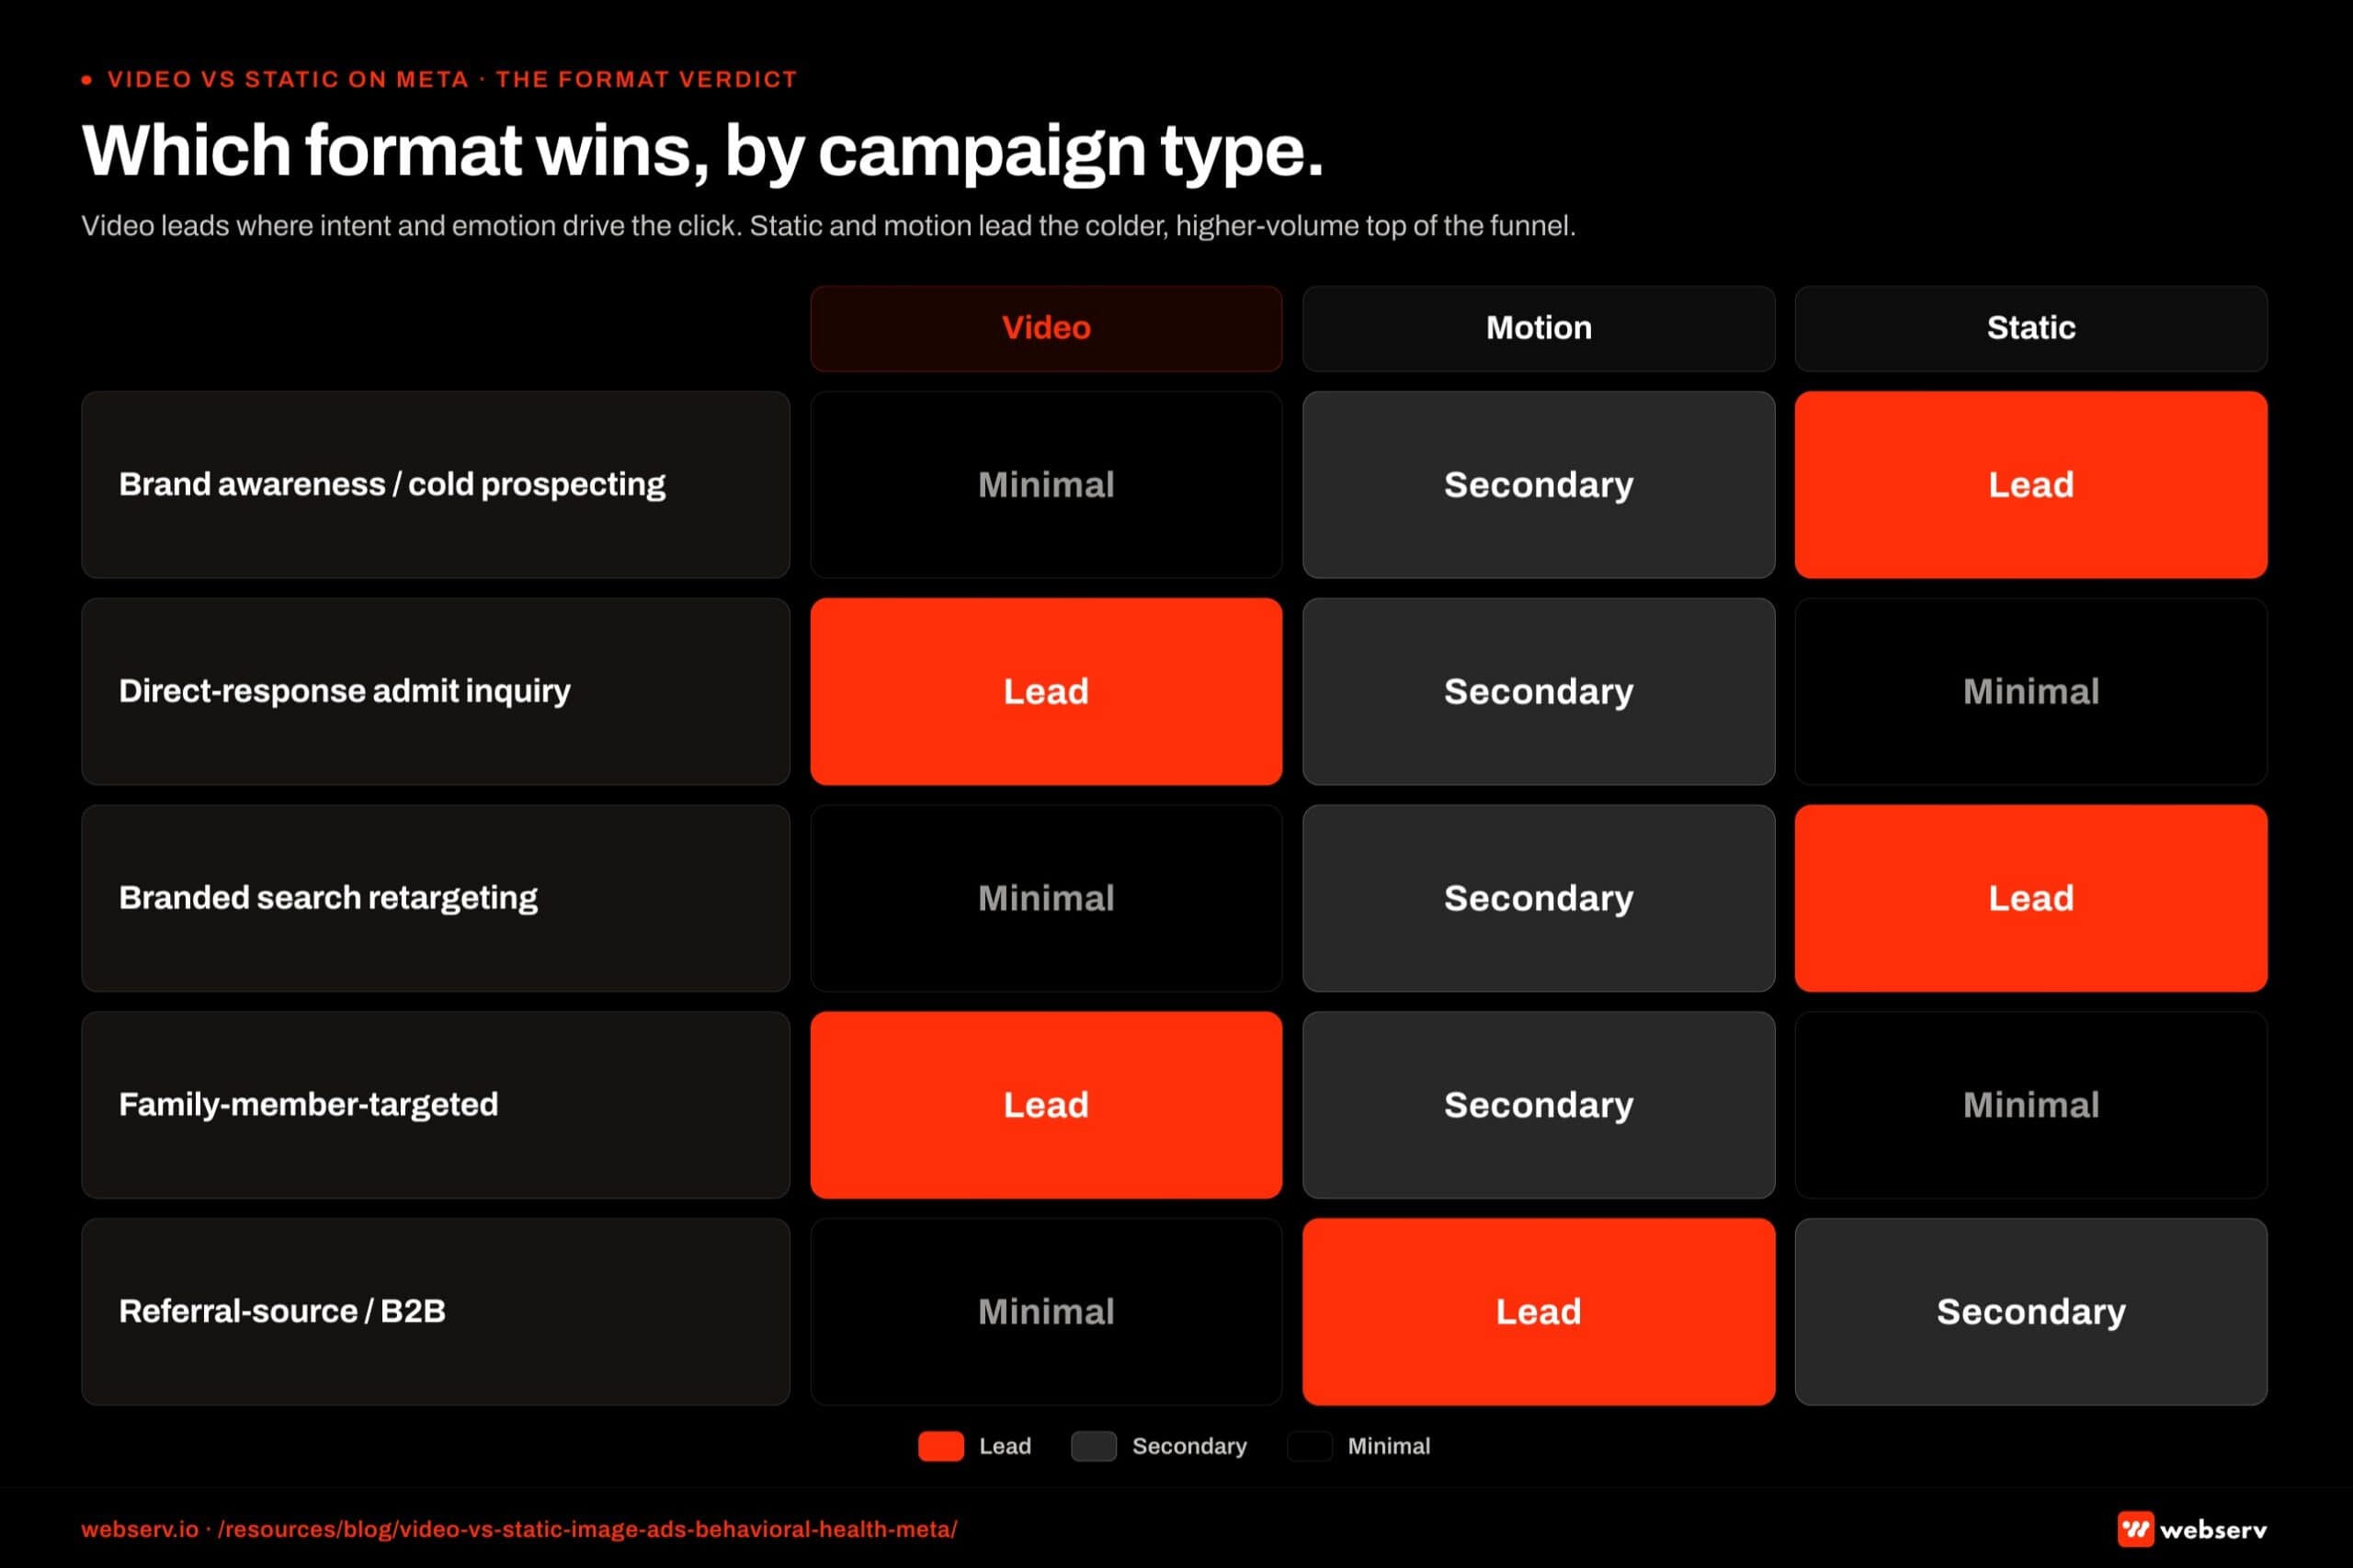
Static and motion can support but not replace video in the direct-response admit flow. This is the campaign type where creative quality drives most of the cost-per-admit outcome.
Branded search retargeting. Static leads, motion secondary, video minimal. Warm-audience traffic that already knows the facility name responds to credential displays, accreditation badges, and clinician headshots more than to long-form video.
Static ad creative is the most cost-efficient way to recapture audiences that need a final trust-signal nudge before booking the call.
Family-member-targeted campaigns. Video leads heavily, motion as secondary, static as the trust-signal closer. Family members in crisis respond to credentialed-clinician video voice-overs, calm pacing, and named-source framing.
The video format is the only one that can carry the human credibility a family member is searching for at 11 PM.
Referral-source-targeted campaigns (B2B). Motion leads, static secondary, video minimal. Clinical referrers and EAP reps respond to data-led motion ads with stats, outcome ranges, and clear contact methods. Long-form video underperforms in this segment because the audience is purchasing information density, not emotional connection.
Mobile-First Creative for Behavioral Health on Meta
94 to 98 percent of Meta traffic in healthcare is mobile. The format-mix decision has to start from mobile placements (Stories, Reels, in-feed mobile) as primary rather than desktop placements as default.
The mobile-first frame shifts the format math in two specific ways.
Aspect ratio matters more than format class. 9:16 vertical video and motion outperform 1:1 square or 16:9 horizontal across every Meta mobile placement in 2026.
A static 1:1 image in a Stories placement performs worse than 9:16 motion of the same content, even when the static is technically the stronger creative.
Sound-off design is the default. 80 to 85 percent of mobile Meta video plays with sound off. Captions, on-screen text, and visual storytelling that works without audio is required.
Video creative that depends on voice-over to carry the message will underperform in the placements where most behavioral health inquiry traffic actually lives.
The format-mix decision should evaluate each creative concept against the mobile placement reality. Video concepts that don’t work sound-off should be reshot or replaced.
Static concepts that don’t render cleanly in 9:16 should be reframed for mobile. Motion concepts should be designed mobile-first by default, since the format expectation in Stories and Reels is already vertical motion.
Production Capacity Realities
The format-mix recommendation requires production capacity most treatment centers do not have in-house.
Video at 8 to 15 net-new concepts per month. $20,000 to $60,000 monthly creative spend on top of media budget. Requires a video producer, an editor, on-camera talent (typically clinicians with media training and release agreements), and a clinical reviewer for compliance.
Motion at 20 to 30 net-new concepts per month. $6,000 to $20,000 monthly creative spend. Requires a motion designer or motion-graphics editor, brand-style templates, and a clinical reviewer for any clinical claims.
Static at 10 to 15 net-new concepts per month. $3,000 to $8,000 monthly creative spend. Requires a graphic designer, brand-style templates, and a clinical reviewer.
Total creative production budget for a competitive behavioral health paid social program in 2026 runs $30,000 to $90,000 monthly on top of media spend. Treatment centers running paid social on creative budgets below that range are typically under-producing in the format that matters most for their volume needs.
The three options for operators below the creative capacity threshold: scale creative production through an agency or contracted production team, scale back campaign volume to match creative capacity, or accept that cost per admit will run higher because the format mix is incomplete.
Most operators we work with scale up creative production rather than accept the cost-per-admit tax, but the decision depends on facility economics and runway.
Frequently Asked Questions
Should we just produce video and skip static and motion?
No. Single-format accounts consistently underperform mixed accounts at the same spend level. The performance gap traces to two mechanics: the algorithm’s placement distribution favors format diversity directly, and audience segments respond differently to different formats.
A video-only account loses the cold-audience prospecting layer where static earns 38 percent CPM efficiency. A static-only account loses the Reels, Stories, and in-feed video placements where most behavioral health inquiry traffic actually scrolls. A motion-only account misses both ends and is uncommon in practice.
The 60-70 percent video / 20-25 percent motion / 10-20 percent static mix produces better total account performance than any single-format approach we have tested in behavioral health.
What’s the realistic cost per video concept for behavioral health?
Broadcast-quality video for treatment center campaigns runs $1,500 to $8,000 per concept depending on production approach. Studio-shot clinician explainers with on-camera talent, professional editing, and sound design land in the $3,000 to $8,000 range. UGC-style videos (clinician shoots on phone with light editing) land in the $1,500 to $3,000 range.
The cost gap matters less than the production volume the budget supports. An operator running paid social for 8 facilities at competitive scale needs 8-15 net-new video concepts monthly. At blended costs, that’s $20,000 to $60,000 monthly in video creative production on top of media spend.
Operators who cannot sustain that level should reduce campaign volume to match creative capacity rather than produce fewer video concepts and let them run too long.
How do motion ads compare to video for behavioral health specifically?
Motion ads land closer to video than to static on CTR and CVR for behavioral health campaigns. The mobile-first scroll-stop advantage that drives video performance also drives motion performance, because the algorithm and the user both respond to any motion content over fully-static content.
Motion’s advantage over video is production efficiency. At $300-$1,500 per concept and 2-5 day production cycles, motion ads let operators ship 20-30 net-new concepts monthly at the cost of 4-6 video concepts. The volume compounds against creative fatigue across a 12-month engagement.
Motion’s disadvantage vs. video is the human credibility signal. A motion ad cannot show a credentialed clinician speaking, which limits its effectiveness for the family-member trust-signal layer where video specifically wins. Motion handles statistics, data, accreditation displays, and operational explainers; video handles human-credibility and emotional connection.
What’s the right creative testing cadence in 2026?
15 to 30 net-new concepts per month across all three formats combined for a competitive behavioral health paid social program. The cadence is not just volume. It’s structured testing: 2-3 concept families per month, 4-6 variations within each family, statistical evaluation at the family level rather than individual creative.
Operators who hit this cadence consistently see cost per admit stay flat or improve over 12 months. Operators running 2-3 creative concepts per month total see cost per admit climb 5-10 percent quarter over quarter as the creative library ages out.
The cadence is the load-bearing variable for sustained paid social performance in behavioral health. It outranks budget, targeting, and bidding strategy in long-cycle account performance.
Do these format-mix recommendations apply to Instagram Reels and TikTok too?
The general mix logic applies, but the format weightings shift. Reels and TikTok reward video and motion more heavily than they reward static, with static performing at materially lower efficiency on those placements than on Meta feed placements.
For behavioral health operators running Reels and TikTok specifically, the format mix shifts toward 70-80 percent video, 15-20 percent motion, and 5-10 percent static. The static allocation gets reserved for branded retargeting and specific use cases where the visual catalog is the message.
LinkedIn paid social, by contrast, reverses the weighting. Static performs better on LinkedIn than on Meta because the platform’s audience is professional and information-density-focused. LinkedIn creative mix runs closer to 40 percent static, 30 percent motion, 30 percent video for behavioral health B2B campaigns.
How do we measure which format is actually working?
Three measurement layers matter. First, format-level CTR and CVR by audience segment (cold vs. warm vs. retargeting). Second, format-level cost per admit, lagged 60-90 days for the form-fill to admit cycle. Third, creative-fatigue patterns at the format level: how quickly does each format decay over 30, 60, 90 days in market?
The measurement framework should distinguish format performance from individual creative performance. Two video concepts with very different CTRs are still both telling you something about video as a format vs. the static and motion concepts in the same account.
For most behavioral health operators, monthly format-level performance reporting plus quarterly creative-fatigue analysis produces the data needed to refine the format mix over a 12-month cycle.
Build the Three-Format Stack Without Burning Production Budget
The video-vs-static debate is the wrong frame in 2026. The right question is what mix of video, motion, and static the operator’s facility economics support and what the campaign objective requires. Single-format accounts lose ground every quarter to operators running the full three-format stack.
We help treatment centers build creative production systems that sustain the 60-70 / 20-25 / 10-20 video / motion / static mix at the production volumes that actually move cost per admit.
The work spans creative briefs, agency or in-house production capacity scoping, clinical-review workflow, and the testing cadence that prevents creative fatigue across a 12-24 month engagement.
Book an intro meeting to walk through your current creative mix, where the format gaps are likely costing you admits, and what a structured three-format stack would produce for your facility.
For the broader picture of how creative fits inside a full treatment center marketing program, see our ultimate guide to behavioral health marketing and our best Meta ad formats for behavioral health in 2026 for the placement-by-placement format reference.
Mitch Marowitz is Director of Paid Media at Webserv, where he leads paid search, paid social, and CRO programs for behavioral health and addiction treatment centers across the U.S. He writes about treatment-center paid media performance, creative testing, and the operational realities of running high-acuity healthcare campaigns.