At a glance: This is a working reference of the most current U.S. drug abuse statistics, sourced primarily from the SAMHSA 2025 National Survey on Drug Use and Health (released July 2026) and CDC NCHS provisional overdose data through 2025. The numbers reflect the population aged 12 or older in the noninstitutionalized civilian U.S. unless otherwise noted. Where statistics are dated to specific years (2021–2025), we cite the original SAMHSA or CDC release. Every percentage in this article has a named source so it’s safe to cite, share, or quote directly.
Key Takeaways
- 44.6 million Americans aged 12+ had a substance use disorder in 2025 (15.3% of the population), down from 16.7% in 2021. Alcohol use disorder accounted for 25.7 million, drug use disorder for 26.0 million, and 7.1 million people had both.
- Only 16.0% of people who needed substance use treatment received it in 2025. That’s 7.6 million people treated out of 47.2 million who needed it. The roughly 84% treatment gap holds despite three straight years of overdose death declines.
- Drug overdose deaths fell for a third straight year in 2025, to an estimated 69,973, almost 14% below the 81,313 estimated for 2024. Opioid-involved deaths dropped from an estimated 55,296 in 2024 to 44,564 in 2025.
- Fentanyl is still the leading cause of death for Americans aged 18–44 despite the declines since 2023. Polysubstance overdose remains the dominant pattern, with 47% of 2023 overdose deaths involving both opioids and stimulants.
- Marijuana use disorder is rising as overall substance use disorders fall. Past-year marijuana use disorder grew from 16.7 million people (6.0%) in 2021 to 19.3 million people (6.7%) in 2025, though it dipped from its 2024 level.
- Co-occurring conditions are massively undertreated. 18.5 million adults had both any mental illness and a substance use disorder in 2025. Of those, 42.6% received no treatment for either condition.
- Youth suicide indicators are trending down but remain serious. 738,000 adolescents aged 12–17 attempted suicide in 2025 (2.9%), down from 940,000 (3.6%) in 2021, though up slightly from 2024.
A note before the statistics
Operators ask us for “the latest stats” several times a week. We tell them the same thing every time.
The headline statistic (44.6 million Americans with a substance use disorder in 2025) has drifted down slowly, from 16.7% of the population in 2021 to 15.3%. The treatment gap (roughly 84% of people who need care don’t receive it) hasn’t closed. What has changed is the drug supply, the overdose death curve, and the specific sub-conditions driving the numbers.
If you build a treatment program around 2019 data, you’ll fail patients in 2026. Fentanyl-contaminated cocaine and methamphetamine, xylazine and medetomidine adulterants, and counterfeit pills now dominate the operational reality. The treatment gap is partly a marketing problem and mostly a market access problem.
This article is the working reference we maintain for treatment center operators, marketers, and clinicians who need cite-able numbers without hunting through 132 pages of NSDUH appendix tables and CDC press releases.
The primary source for substance use disorder, treatment receipt, and mental health prevalence is the SAMHSA 2025 National Survey on Drug Use and Health (NSDUH), released July 2026. The primary source for overdose deaths is the CDC NCHS Vital Statistics Rapid Release and associated press releases through May 2026.
We added a brief commentary block after each section to translate the statistic into an operational implication for treatment centers. The numbers themselves are neutral. The implications are not.
How we sourced and dated these statistics
Statistics in this article are organized by data type, dated to the most recent available release, and cited to the original government source. We follow three rules:
| Rule | Application |
|---|---|
| Cite to original release, not aggregators | NSDUH directly from SAMHSA, overdose deaths directly from CDC NCHS |
| Date every statistic to the survey year, not publication year | A statistic from the 2025 NSDUH was published in July 2026; we date it as a 2025 estimate |
| Note methodology changes that affect comparability | The 2021–2025 NSDUHs used multimode collection; older data is not directly comparable on some measures. SAMHSA changed the substance use treatment questions in 2024 and redefined mental illness estimates in 2025, so those measures are not comparable with earlier releases |
The SAMHSA 2025 NSDUH completed 60,447 interviews across all four quarters of 2025, with an overall weighted response rate of 8.5% for people aged 12 or older. CDC overdose mortality data through 2025 reflects provisional National Vital Statistics System counts with continued lag-adjustment.
When a stat without a year is referenced casually online (often from 2018–2020 surveys), it’s almost always outdated by at least one major epidemic phase. Use the dated versions in this article instead.
Drug use prevalence in 2025
The most current SAMHSA NSDUH data for people aged 12 or older shows the following past-month and past-year substance use estimates.
| Substance | Use period | Number of users | Percentage | Source |
|---|---|---|---|---|
| Any substance (tobacco/alcohol/illicit) | Past month | 162.8 million | 56.0% | SAMHSA 2025 NSDUH |
| Alcohol | Past month | 129.1 million | 44.4% | SAMHSA 2025 NSDUH |
| Tobacco products | Past month | 46.9 million | 16.2% | SAMHSA 2025 NSDUH |
| Nicotine vaping | Past month | 29.3 million | 10.1% | SAMHSA 2025 NSDUH |
| Any illicit drug | Past month | 47.5 million | 16.4% | SAMHSA 2025 NSDUH |
| Any illicit drug | Past year | 69.8 million | 24.0% | SAMHSA 2025 NSDUH |
| Marijuana | Past month | 43.8 million | 15.1% | SAMHSA 2025 NSDUH |
| Cocaine (incl. crack) | Past year | 4.9 million | 1.7% | SAMHSA 2025 NSDUH |
| Methamphetamine | Past year | 2.7 million | 0.9% | SAMHSA 2025 NSDUH |
| Heroin | Past year | 581,000 | 0.2% | SAMHSA 2025 NSDUH |
| Prescription opioid misuse | Past year | 6.9 million | 2.4% | SAMHSA 2025 NSDUH |
| Hallucinogens | Past year | 9.1 million | 3.1% | SAMHSA 2025 NSDUH |
What this means for treatment centers: The aggregate prevalence numbers stay relatively flat year over year. What changes is the substance mix.
Marijuana use has risen consistently while tobacco and cigarette use continues to decline. Polysubstance use is the operational reality, not single-substance use.
Alcohol-specific 2025 data
| Metric | 2025 estimate | Trend vs 2021 | Source |
|---|---|---|---|
| Past-month alcohol use, 12+ | 129.1 million (44.4%) | Down from 47.4% | SAMHSA 2025 NSDUH |
| Past-month binge drinkers, 12+ | 56.8 million (19.5%) | Down from 21.7% | SAMHSA 2025 NSDUH |
| Past-month heavy drinkers, 12+ | 14.5 million (5.0%) | Down from 5.7% | SAMHSA 2025 NSDUH |
| Underage drinkers (aged 12–20) | 5.4 million (13.7%) | Down from 15.6% | SAMHSA 2025 NSDUH |
| Underage binge drinkers | 3.1 million (7.9%) | No change | SAMHSA 2025 NSDUH |
| Past-year alcohol use disorder | 25.7 million (8.9%) | Down from 10.6% | SAMHSA 2025 NSDUH |
What this means for treatment centers: Alcohol use disorder remains the largest single SUD category by population. Underage past-month drinking declined 1.9 points from 2021 to 2025, but binge drinking among the same age group showed no change, which signals a problem of drinking intensity rather than drinking initiation.
Marijuana use trends
| Metric | 2021 | 2025 | Direction |
|---|---|---|---|
| Past-month marijuana use, 12+ | 13.2% (37.0M) | 15.1% (43.8M) | Up |
| Past-month, adults 26+ | 12.3% (27.1M) | 14.9% (34.1M) | Up |
| Past-year marijuana use disorder | 6.0% (16.7M) | 6.7% (19.3M) | Up |
| Adults 26+ with marijuana use disorder | 4.7% (10.4M) | 5.7% (13.1M) | Up |
What this means for treatment centers: Marijuana use disorder is the fastest-growing past-year SUD by population. Operators expecting THC concentrations and use patterns from 2015–2019 are clinically out of date. Vaping and dabbing concentrates dominate use modes among young adults.
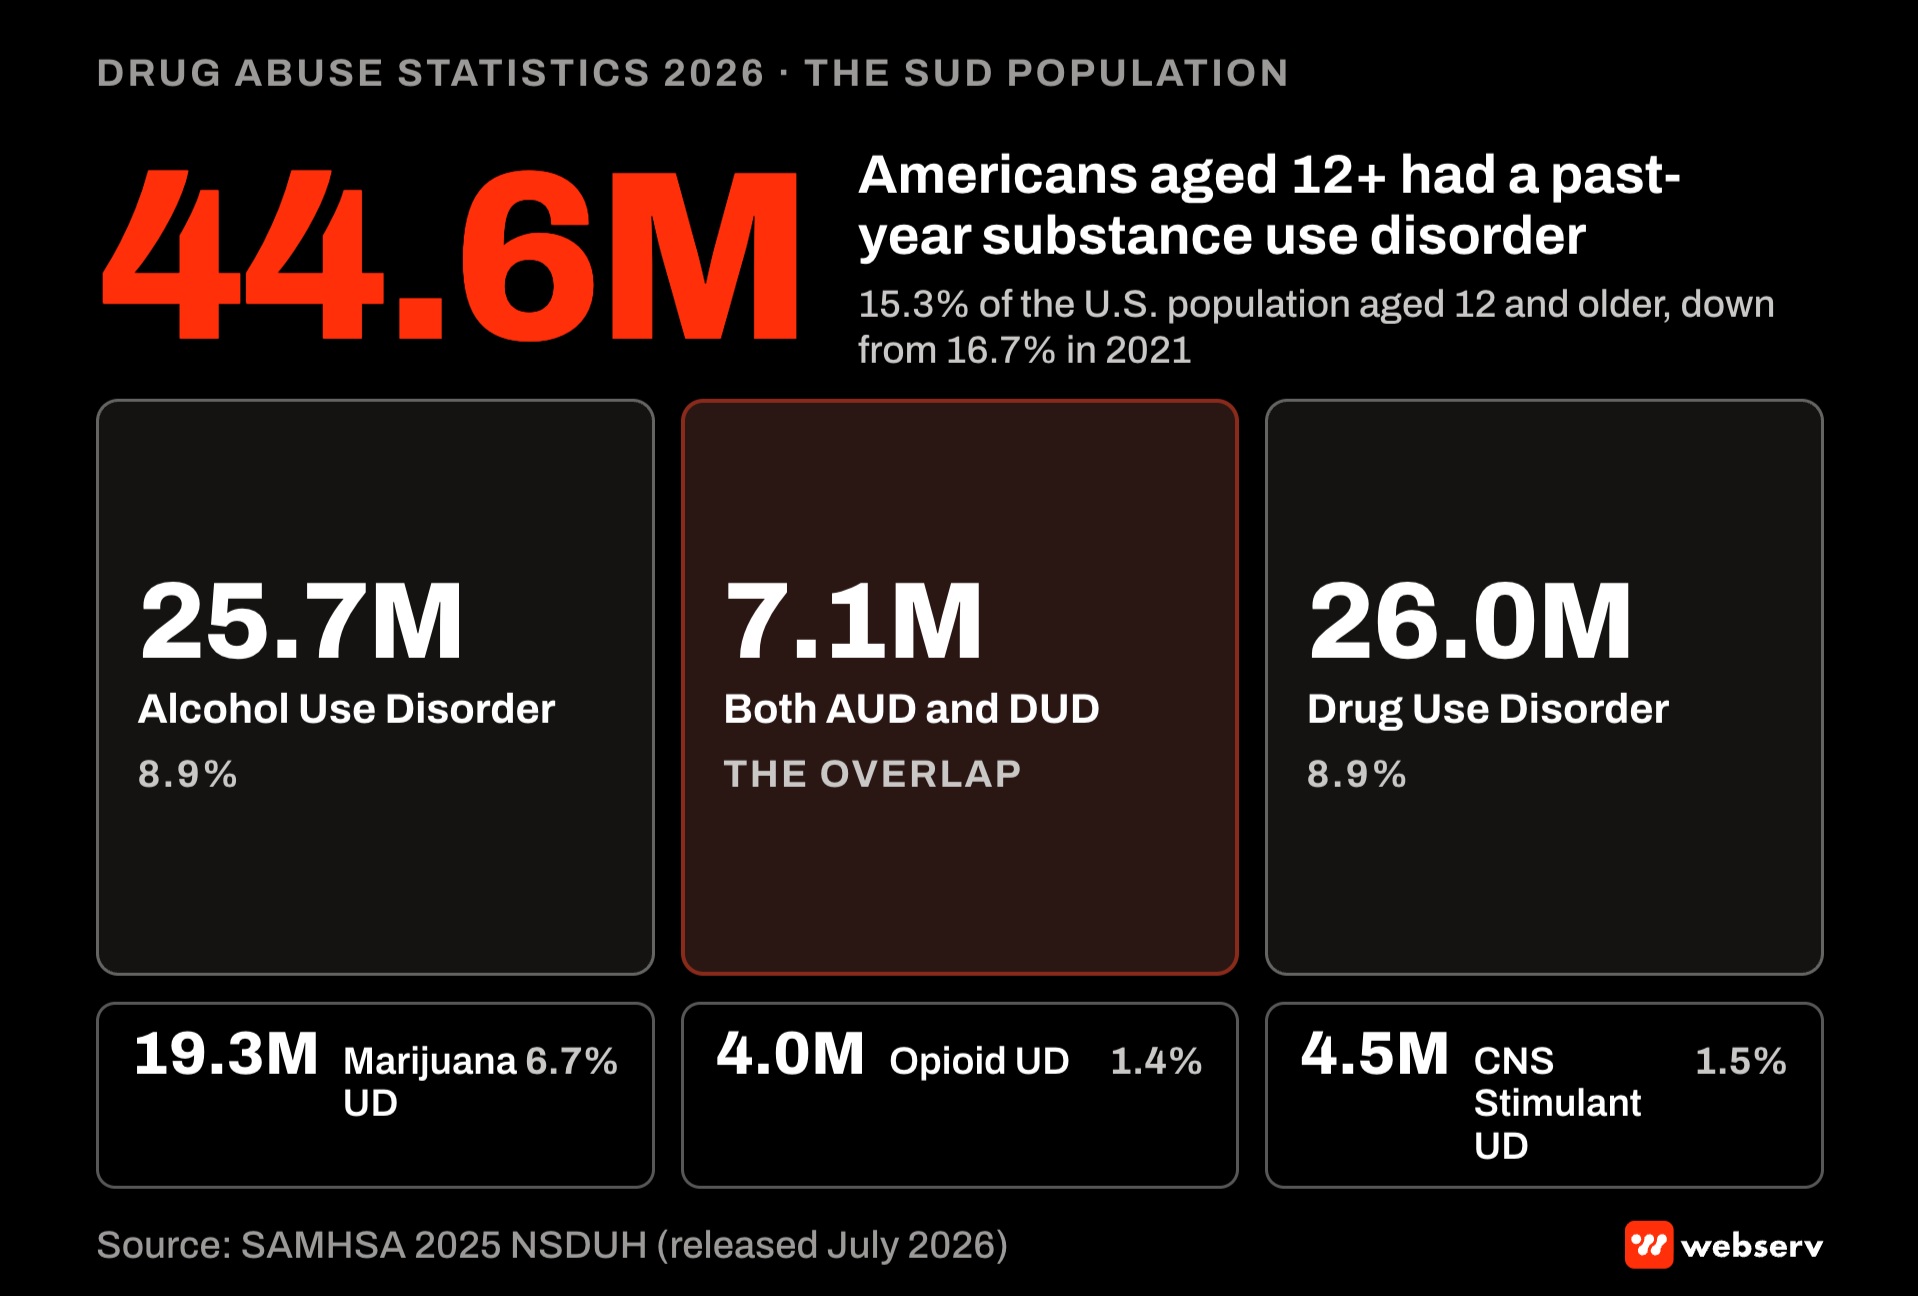 Infographic titled ‘The SUD population, 2025.’
Substance use disorders in 2025
44.6M
Americans aged 12+ with a substance use disorder in 2025 (15.3% of population). SAMHSA 2025 NSDUH.
16.0%
Share of people who needed substance use treatment and received it in 2025. Only 7.6M of 47.2M.
69,973
Estimated U.S. drug overdose deaths in 2025. Down almost 14% from 2024, the third straight annual decline. CDC NCHS provisional.
18.5M
U.S. adults with co-occurring mental illness and SUD in 2025. 42.6% received neither treatment.
SAMHSA estimates that 44.6 million people aged 12 or older (15.3%) had a substance use disorder in the past year, based on DSM-5 criteria.
| Disorder | 2025 estimate | Source |
|---|---|---|
| Any substance use disorder | 44.6 million (15.3%) | SAMHSA 2025 NSDUH |
| Alcohol use disorder | 25.7 million (8.9%) | SAMHSA 2025 NSDUH |
| Drug use disorder | 26.0 million (8.9%) | SAMHSA 2025 NSDUH |
| Both alcohol and drug use disorder | 7.1 million (16.0% of SUD pop) | SAMHSA 2025 NSDUH |
| Marijuana use disorder | 19.3 million (6.7%) | SAMHSA 2025 NSDUH |
| Opioid use disorder | 4.0 million (1.4%) | SAMHSA 2025 NSDUH |
| CNS stimulant use disorder | 4.5 million (1.5%) | SAMHSA 2025 NSDUH |
| Severe opioid use disorder | 20.3% of OUD cases | SAMHSA 2025 NSDUH |
What this means for treatment centers: The DSM-5 SUD criteria changed in how NSDUH applies them between 2020 and 2021, so cross-year comparisons require care. The 15.3% prevalence in 2025 is down from 16.7% in 2021. Marijuana use disorder is one of the few measures that rose between 2021 and 2025, along with past-year marijuana and hallucinogen use.
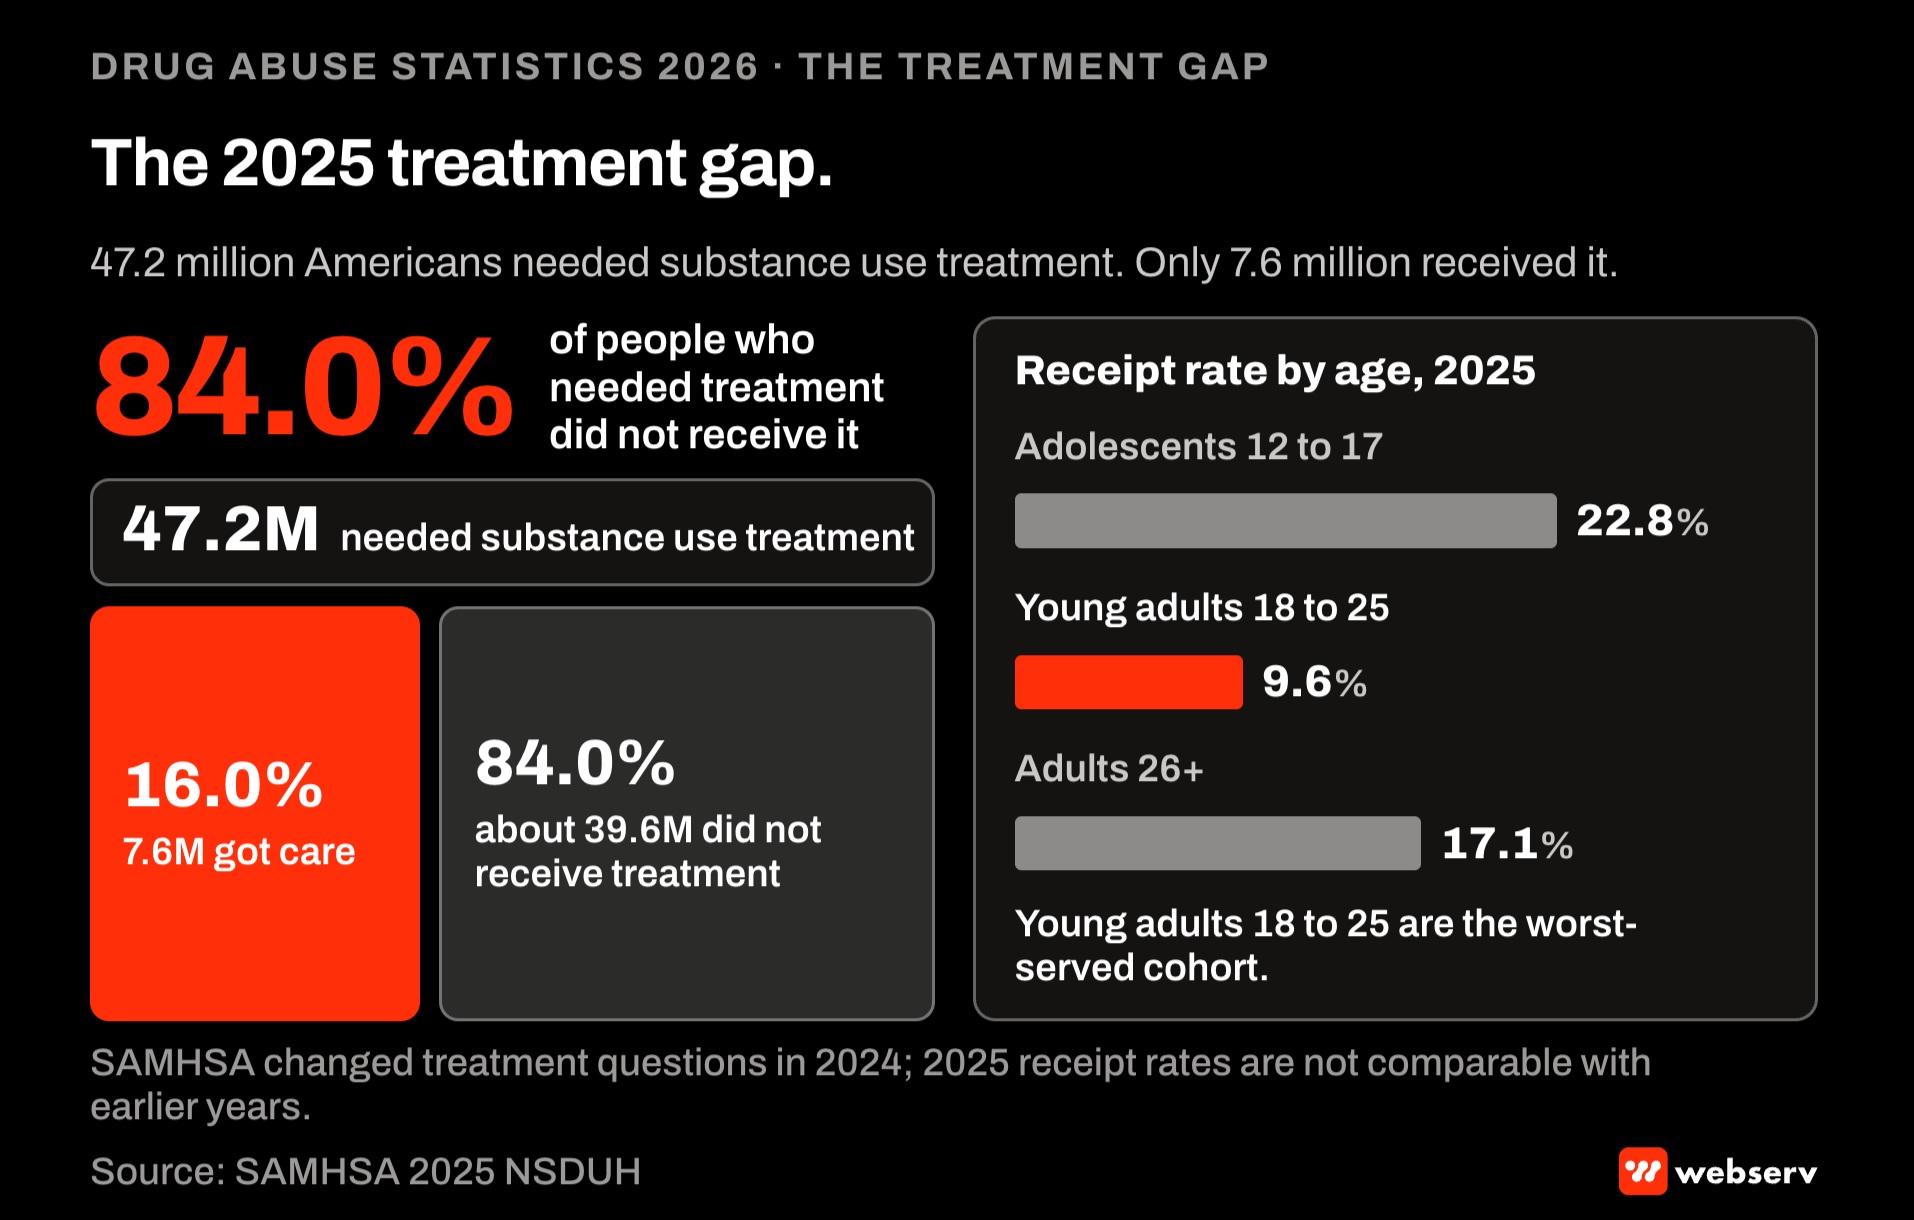 Infographic titled ‘The 2025 treatment gap.’
The treatment gap: the most-cited statistic on this list
This is the operational statistic that matters most to treatment center operators and the one that has barely shifted in a decade.
| Metric | 2025 estimate | Source |
|---|---|---|
| People aged 12+ needing substance use treatment | 47.2 million (16.3%) | SAMHSA 2025 NSDUH |
| Of those, people who had an SUD in past year | 44.6 million | SAMHSA 2025 NSDUH |
| Of those, received substance use treatment | 7.6 million (16.0%) | SAMHSA 2025 NSDUH |
| Adolescents 12–17 needing treatment who received it | 22.8% | SAMHSA 2025 NSDUH |
| Young adults 18–25 needing treatment who received it | 9.6% | SAMHSA 2025 NSDUH |
| Adults 26+ needing treatment who received it | 17.1% | SAMHSA 2025 NSDUH |
“The treatment gap isn’t a marketing problem first. It’s an access problem first. The operators who win in this category understand that intake speed, insurance verification fluency, and same-day admission capacity matter more than any single ad campaign.”
Preston Powell, CEO, Webserv
Treatment delivery breakdown (2025):
- Outpatient treatment: 4.4 million people (1.5%)
- Telehealth treatment: 3.6 million people (1.2%)
- Inpatient treatment: 2.2 million people (0.7%)
- Medication for opioid use disorder (MOUD): 2.1 million people (0.7%)
- Medication for alcohol use disorder (MAUD): 1.1 million people (0.4%)
- Treatment in prison, jail, or juvenile detention: 649,000 people (0.2%)
What this means for treatment centers: Of the 4.0 million Americans with opioid use disorder, only an estimated 623,000 received MOUD in 2025 (15.7%). That’s the single most actionable gap in the dataset. Operators that can credentialize for MOUD, build telehealth capacity for ongoing care, and lower admission barriers (waiting list, insurance, motivation requirements) have the strongest 2026 opportunity.
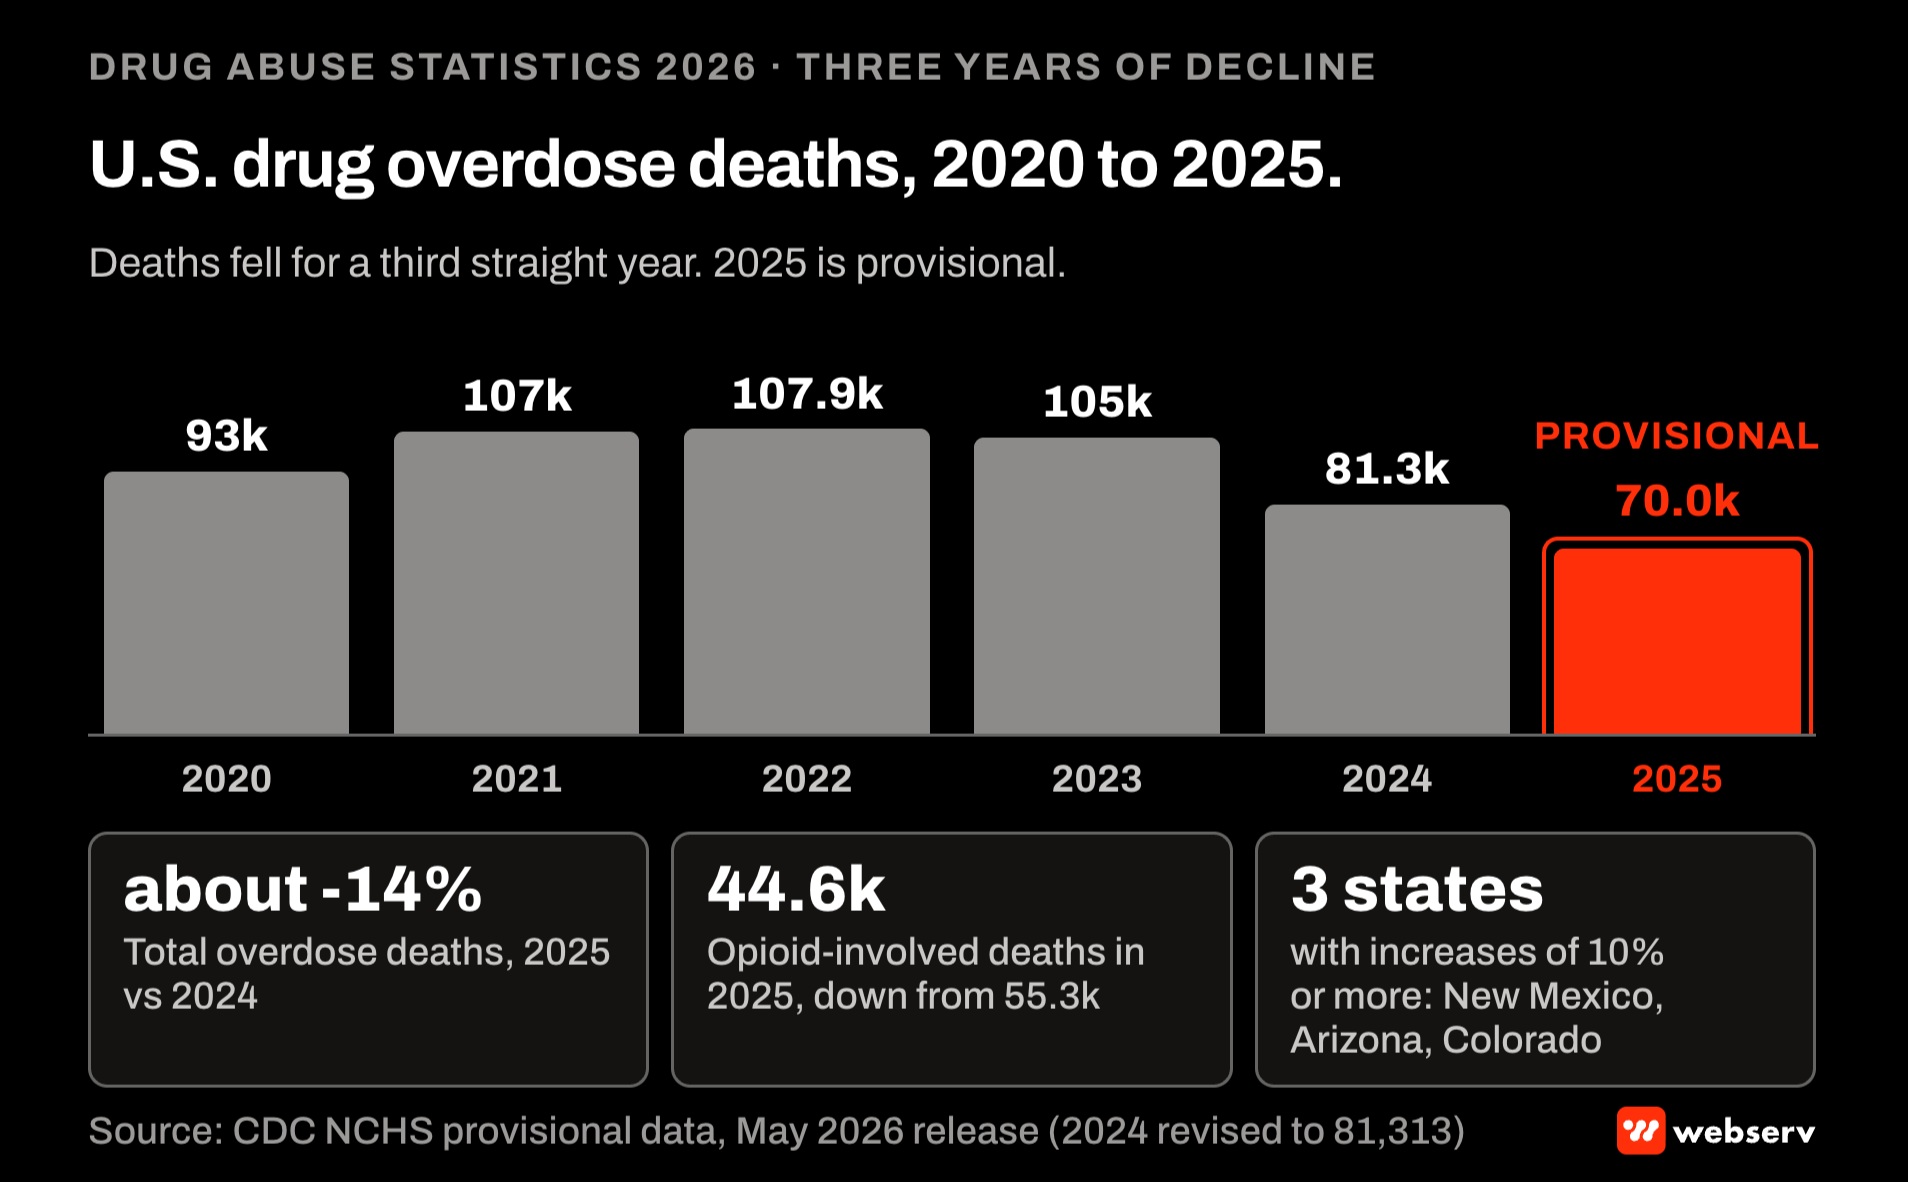 Bar chart titled ‘U.S. drug overdose deaths, 2020 to 2025.’
Overdose deaths: a third straight year of decline
CDC NCHS provisional data shows the largest single-year reduction in drug overdose deaths on record.
| Year | Total overdose deaths | Synthetic opioid deaths (primarily fentanyl) | Source |
|---|---|---|---|
| 2020 | ~93,000 | ~57,000 | CDC NCHS |
| 2021 | ~107,000 | ~71,000 | CDC NCHS |
| 2022 | 107,941 | ~75,000 | CDC NCHS |
| 2023 | 105,007 | 83,140 | CDC NCHS |
| 2024 | 81,313 (revised estimate) | 54,743 (-34.1%) | CDC NCHS (May 2025 and May 2026 releases) |
| 2025 (provisional) | 69,973 (about -14%) | Not yet broken out; all opioid-involved deaths: 44,564 | CDC NCHS (May 2026 release) |
Other 2023 / 2024 overdose data points:
- 76% of 2023 overdose deaths involved an opioid (prescription or illegal)
- 69% of 2023 overdose deaths involved synthetic opioids (primarily IMF)
- 47% of 2023 overdose deaths involved both opioids and stimulants (“fourth wave”)
- 29,449 deaths involved cocaine in 2023 (up 85% from 2019)
- 34,855 deaths involved psychostimulants (primarily methamphetamine) in 2023
- 10,870 deaths involved benzodiazepines in 2023, with nearly 70% co-involving fentanyl
- Almost all states saw overdose deaths decline in 2025; New Mexico, Arizona and Colorado had increases of 10% or more (CDC NCHS, May 2026)
- West Virginia: highest fentanyl overdose death rate at 69.2 per 100,000 in 2023
- Overdose remains the leading cause of death for Americans aged 18–44
What this means for treatment centers: The decline is now three years long and historic, but it’s not over. Naloxone access expansion, the elimination of the X-Waiver requirement (under the MAT Act of 2023), broader buprenorphine prescribing, and shifts in the illicit supply all contributed.
The states where overdose deaths rose in 2025 (New Mexico, Arizona and Colorado) are the markets where census pressure on existing programs is highest.
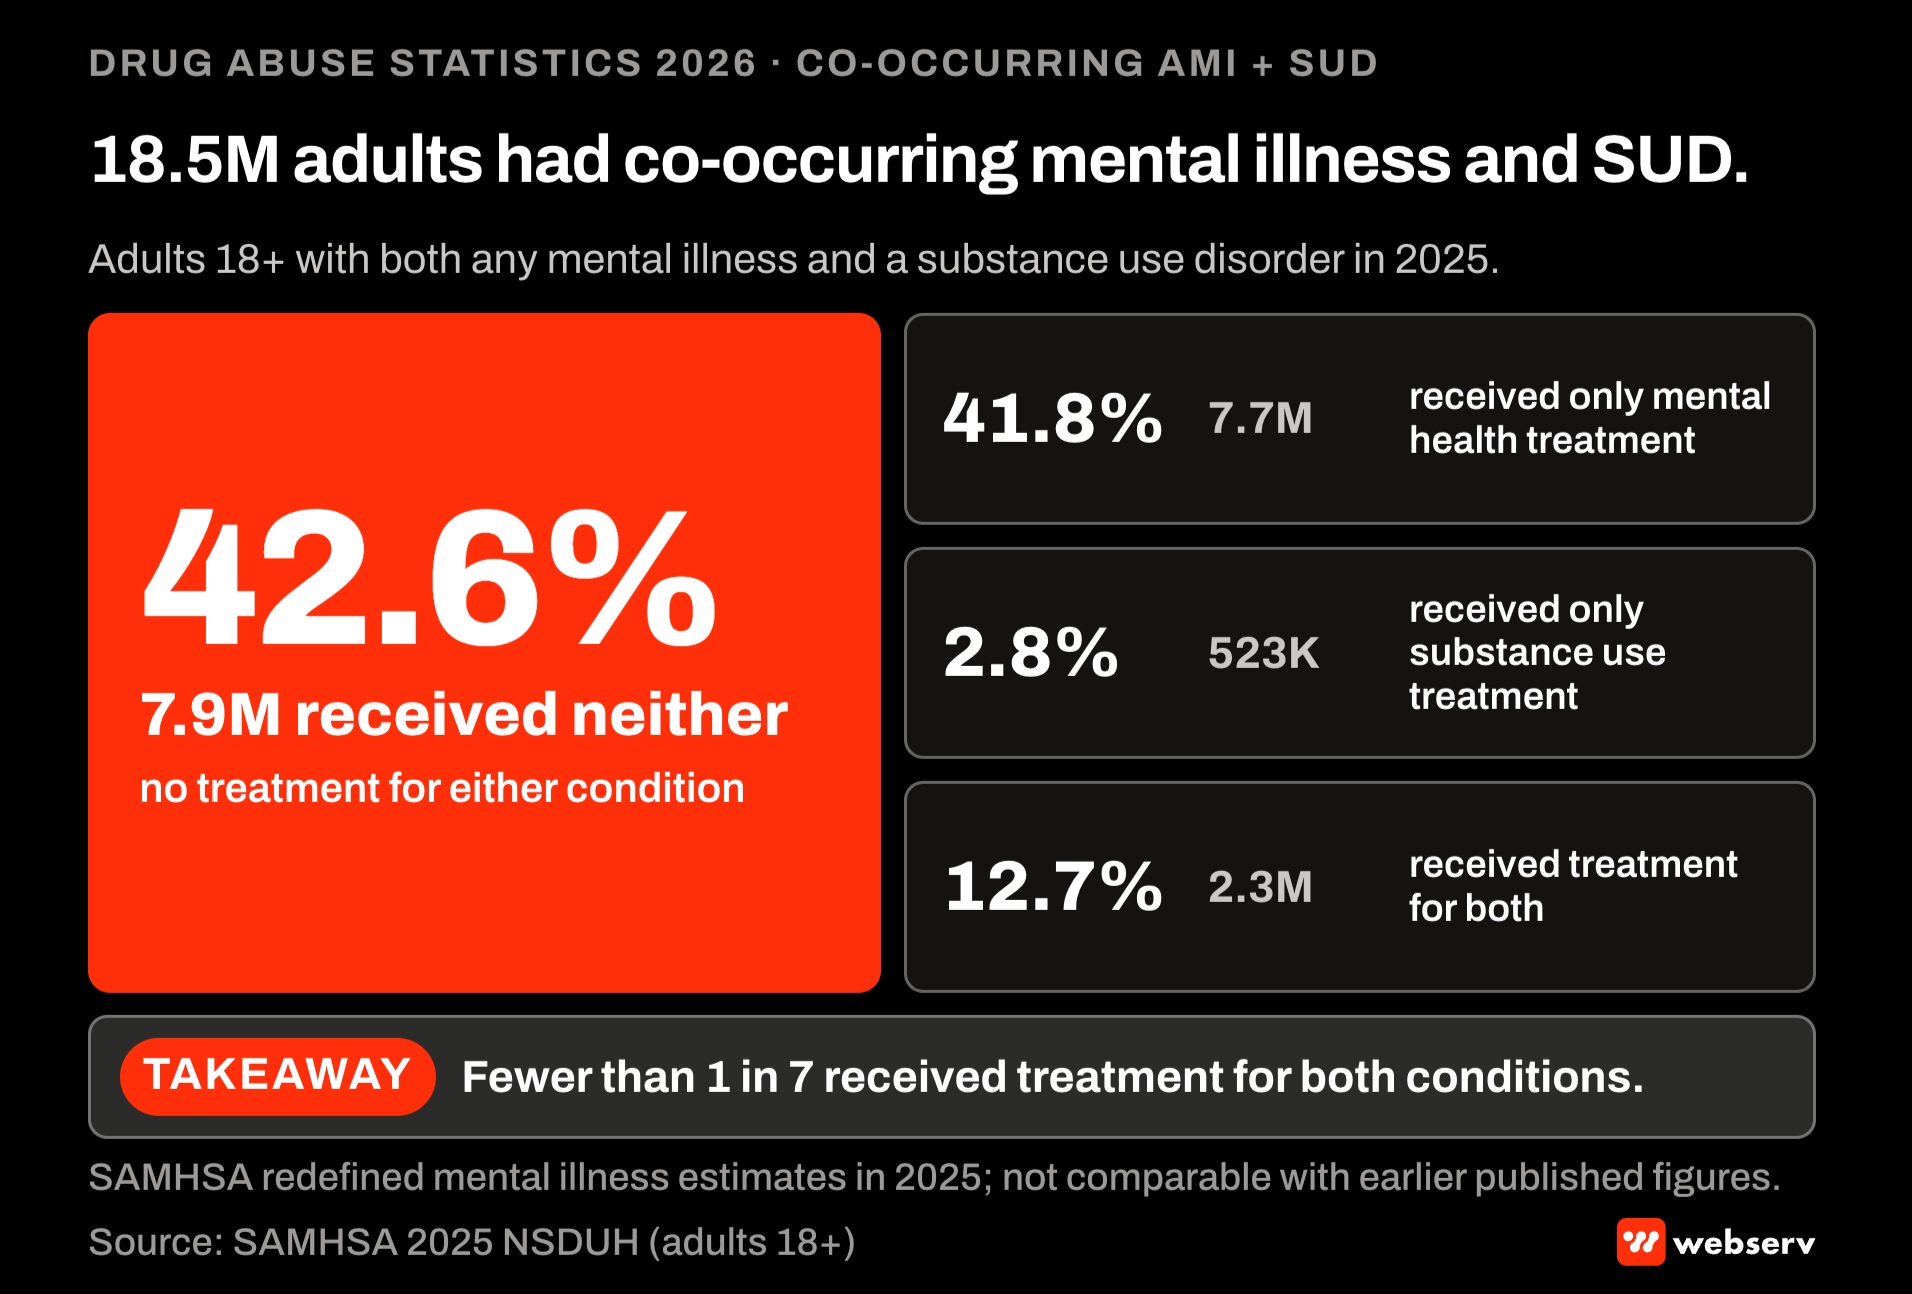 Infographic titled ‘18.5M adults had co-occurring mental illness and SUD.’
Mental health and co-occurring conditions
The mental health prevalence data for adults aged 18+ comes from the NSDUH AMI and SMI modules. In 2025 SAMHSA moved these estimates to a DSM-5-based model and re-estimated 2021 to 2024, so older published AMI and SMI figures are not directly comparable.
| Metric | 2025 estimate (adults 18+) | Source |
|---|---|---|
| Any mental illness (AMI) | 54.6 million (20.6%) | SAMHSA 2025 NSDUH |
| Serious mental illness (SMI) | 18.2 million (6.9%) | SAMHSA 2025 NSDUH |
| Major depressive episode | 19.7 million (7.4%) | SAMHSA 2025 NSDUH |
| Co-occurring AMI + SUD | 18.5 million (7.0%) | SAMHSA 2025 NSDUH |
| Co-occurring SMI + SUD | 7.8 million (2.9%) | SAMHSA 2025 NSDUH |
| Either AMI or SUD | 78.9 million (29.8%) | SAMHSA 2025 NSDUH |
| Adults with AMI who received mental health treatment | 27.8 million (50.9% of AMI) | SAMHSA 2025 NSDUH |
| Adults with SMI who received mental health treatment | 12.3 million (67.7% of SMI) | SAMHSA 2025 NSDUH |
Co-occurring AMI + SUD treatment receipt
This is the most-undertreated combination in the dataset.
| Treatment outcome | Percentage | Number |
|---|---|---|
| Received neither SUD nor mental health treatment | 42.6% | 7.9 million |
| Received only mental health treatment | 41.8% | 7.7 million |
| Received only substance use treatment | 2.8% | 523,000 |
| Received both | 12.7% | 2.3 million |
What this means for treatment centers: Of 18.5 million adults with both AMI and an SUD, 12.7% received treatment for both conditions in 2025. Dual-diagnosis-capable programs have a defensible market position because the demand is genuinely unmet.
Suicide indicators
| Indicator | 2025 estimate | Source |
|---|---|---|
| Adults 18+ with serious thoughts of suicide | 13.9 million (5.3%) | SAMHSA 2025 NSDUH |
| Adults who made a suicide plan | 4.9 million (1.8%) | SAMHSA 2025 NSDUH |
| Adults who attempted suicide | 2.3 million (0.9%) | SAMHSA 2025 NSDUH |
| Adolescents 12–17 with serious thoughts of suicide | 2.6 million (10.4%) | SAMHSA 2025 NSDUH |
| Adolescents who made a suicide plan | 1.3 million (5.1%) | SAMHSA 2025 NSDUH |
| Adolescents who attempted suicide | 738,000 (2.9%) | SAMHSA 2025 NSDUH |
Adolescent suicide attempt rate declined from 3.6% in 2021 to 2.9% in 2025. Young adult (18–25) suicide attempt rate also declined, from 2.8% in 2021 to 1.9% in 2025. Adults aged 50+ showed an increase, from 0.2% in 2021 to 0.5% in 2025.
What this means for treatment centers: Adolescent and young adult indicators are improving. Adult 50+ indicators are deteriorating. Programs serving older adults should expect to see this in intake.
Drug supply trends 2024–2026
These trends are not from NSDUH (which doesn’t track supply); they come from DEA seizures, CDC mortality, and recovery-research aggregations.
Fentanyl and synthetic opioids:
- Synthetic opioid deaths fell 34% from 83,140 (2023) to 54,743 (2024) per CDC
- Fentanyl pill seizures rose 2,300× from 2017 (49,657) to 2023 (115.5 million) per DEA
- Pills now represent 49% of fentanyl seizures vs. 10% in 2017
- Counterfeit pills containing lethal fentanyl doses rose from 40% (2020–2021) to 70% (2023–2024) per DEA lab analysis
Polysubstance and adulterants:
- 47% of 2023 overdose deaths involved opioids + stimulants (the “fourth wave”)
- Cocaine-involved deaths up 85% from 2019 to 2023
- Xylazine (“tranq”) involved in approximately 11% of U.S. overdose deaths in 2022, up from near zero in 2015
- Medetomidine, a stronger veterinary anesthetic than xylazine, detected in 37% of opioid samples in October 2025 vs. 4% in May 2024
- Nitazenes (synthetic opioids up to 100× stronger than fentanyl) emerged in the U.S. supply 2023–2025
Youth-specific exposure:
- Fentanyl is the leading cause of death among Americans aged 15–24
- An estimated 80% of teen and young adult fentanyl poisoning deaths can be traced to social media contact (DEA “Operation Last Mile” data)
What this means for treatment centers: Intake assessments built around the 2018–2020 supply environment will miss adulterant exposure, social media procurement patterns, and counterfeit pill identification. Toxicology screens beyond standard drug panels are increasingly necessary. Naloxone protocols sized for fentanyl may not reverse xylazine sedation effects.
What treatment center operators should do with these numbers
The point of a statistics article isn’t the statistics. It’s what an operator does next.
1. Calibrate market sizing to the treatment gap, not to SUD prevalence: your addressable market isn’t 44.6 million people with an SUD. It’s the 7.6 million people currently receiving treatment plus the prospective subset of the 39.7 million people with an SUD who didn’t receive treatment whose access barriers your program can credibly resolve.
2. Update intake assessments for polysubstance and adulterant reality: a patient who reports “just cocaine” or “just Xanax” in 2026 may be fentanyl- or xylazine-exposed, and standard naloxone protocols don’t reverse xylazine. Toxicology screens beyond standard 5-panel and 10-panel testing are clinically warranted.
3. Lower admission barriers where you can: same-day access, low-barrier entry, telehealth options, and meeting patients at their current stage of change all move the conversion rate from “needed treatment” to “received treatment.” Waiting lists, insurance complications, and requirements for prior abstinence keep people out of the 16.0% who actually receive care.
4. Build dual-diagnosis capacity: 18.5 million adults had co-occurring AMI and SUD in 2025, and only 12.7% received treatment for both. The gap is the largest single under-served population in the dataset.
5. Plan for MOUD-led care: only 15.7% of the 4.0 million people with opioid use disorder received MOUD in 2025. Programs that can credentialize for methadone, buprenorphine, and naltrexone have a defensible operating model in the 2026 supply environment.
Webserv works with treatment center operators to translate statistics like these into admit-attributable marketing programs, authority content, and admissions ops infrastructure that lower the access barriers operators can actually move. If you want a partner that operates on the operational implications of statistics like these, book an intro meeting.
A closing position on statistics articles in 2026
Most drug abuse statistics articles online cite 2018–2020 data because the publishers don’t update them. Google and AI search engines penalize that.
The opportunity for treatment center operators isn’t to publish the deepest statistics article. It’s to publish the most accurately-dated, government-source-cited, operationally-translated version of the statistics that already exist in primary releases. Operators who plan to old numbers underestimate both the polysubstance and the adulterant realities driving 2026 admissions.
We update this article when SAMHSA releases the next NSDUH (typically July or August), when CDC releases the next overdose mortality update (quarterly), and when supply trends change materially. This version reflects the 2025 NSDUH (July 2026) and CDC provisional overdose data through 2025 (May 2026). The next update is expected in late summer 2027 when the 2026 NSDUH publishes.
If you spot a statistic in this article that conflicts with a more recent government release, send us the source. We will update the number and credit the catch.
Sources
- Substance Abuse and Mental Health Services Administration. (2026). Key Substance Use and Mental Health Indicators in the United States: Results from the 2025 National Survey on Drug Use and Health (HHS Publication No. PEP26-07-010, NSDUH Series H-61). Center for Behavioral Health Statistics and Quality. SAMHSA 2025 NSDUH releases.
- Centers for Disease Control and Prevention. (2026, May 13). U.S. overdose deaths decrease for third consecutive year in 2025 [Press release]. CDC NCHS Press Room.
- Centers for Disease Control and Prevention. (2025, May 14). U.S. overdose deaths decrease almost 27% in 2024 [Press release]. CDC NCHS Press Room.
- Centers for Disease Control and Prevention. (n.d.). Vital Statistics Rapid Release: Provisional Drug Overdose Death Counts. CDC NCHS VSRR.
- Centers for Disease Control and Prevention. (n.d.). Understanding the Opioid Overdose Epidemic. CDC Overdose Prevention.
- National Institute on Drug Abuse. (2024, August 21). Drug Overdose Deaths: Facts and Figures. NIDA.
- Drug Enforcement Administration. DEA Lab Analysis and Operation Last Mile. Federal seizure data through 2024.
Olivia Birkbeck supports content production at Webserv, a behavioral-health-first SEO and digital marketing agency. Statistics in this article are sourced from primary U.S. government data releases; the operational commentary is Webserv’s own.