THE COMPLETE PLAYBOOK
A end-to-end breakdown of how treatment centers build a patient acquisition system that generates consistent, measurable admissions.
Most treatment centers define patient acquisition as marketing. Run ads, generate leads, fill beds. That's the model most operators inherited, and most agencies are happy to keep selling it.
It's also why the average out-of-network treatment center spends around $16,000 to admit a single patient — and has no clear picture of where that number is coming from or how to move it.
The problem isn't the budget. It's that most facilities are running three broken systems simultaneously — and optimizing for the wrong thing at every stage.
Rehab patient acquisition isn't a marketing problem. It's a systems problem. And the treatment centers that fill beds predictably aren't the ones spending the most — they're the ones who've built a system where every component works together toward a single north star: cost per admit.
That system is what this playbook is about.
The data behind this playbook is drawn from 50+ treatment centers and over $16.5M in managed ad spend — the majority of which are out-of-network facilities, where patient acquisition costs run significantly higher than in-network programs. Across that dataset, the average cost per admit coming in is around $16,000. Top performers running the full system get that number under $8,000. The gap between those two numbers is exactly what this playbook is designed to close.
Most treatment centers don't start with strategy. They start with spend. They hire an SEO agency, spin up Google Ads, add paid social, and hope the volume solves the problem. For a while it might look like it's working. Leads come in. The dashboard looks busy.
Then the admits don't follow. Costs creep up. The agency points to impressions and click-through rates. The operator starts asking harder questions. Nobody has good answers.
So they switch agencies.
Switching agencies while keeping the same fragmented approach doesn't fix anything. A new team running disconnected SEO, disconnected PPC is still a disconnected system. The problem was never the vendor. It was the absence of a strategy that connected all of it.
Most agencies don't think about marketing the way we do. A treatment center can be running SEO and PPC and still have no actual system. Just a collection of services running in parallel, each optimizing for its own metrics, none of them oriented toward the same outcome.
Strategy is what changes that. Not a one-time plan — a living framework that defines the north star metric, sets the payer mix targets, establishes the baseline, and connects every channel decision to the admit. And it has to be adaptive. If a facility's census goals shift, if payer mix changes, if a new program launches, the strategy has to move with it.
Every Webserv client goes through a formal QBR each quarter. Not as a reporting exercise — as a strategic realignment. We pressure-test the current strategy against what's actually happening in the facility. We catch drift before it becomes a problem. We pivot when the facility's goals change. The QBR is how strategy stays alive instead of becoming a document nobody reads.
See How Our Methodology Works →Strategy isn't the thing you do before the real work starts. It's the thing that makes the real work mean something. Every section that follows in this playbook — paid, organic, creative, admissions ops — only compounds when it's built on this foundation.
Most treatment center websites are built like brochures. They tell you what the facility offers. They show photos of the amenities. They have a phone number somewhere near the top. And then they wait.
The problem is that a person visiting your website at 11pm, trying to figure out if they can afford to get their son help, isn't browsing. They're deciding. They need to know if their insurance is accepted, what the first 24 hours look like, and whether this place is going to treat their family like a human being or a transaction. If your website doesn't answer those questions fast, in the right sequence, with zero friction, they're gone. And they probably called someone else.
That's why web development isn't a one-time project for us. We look at where people drop off, what questions they couldn't find answers to, where the form got too long or the page loaded too slow. Then we fix it. It's ongoing because the market changes, your programs change, and what works today may not work next quarter.
A treatment center website has one job: get a qualified family to make contact. That requires more than good design. It requires the right information in the right order, load times that don't punish someone on a mobile connection, and a path to contact that doesn't make a motivated family go hunting for it.
Once the foundation is right, conversion rate optimization layers on top. Testing, refining, compounding the gains over time. We cover that in the Creative & CRO section. But it all starts here: a site that was actually built to convert the traffic your paid and organic channels are working to send it.
Most treatment centers start paid media the same way. They set up a Google Ads account, target "drug rehab near me" and a handful of broad match keywords, set a daily budget, and wait for calls. The calls come. The admissions team works them. Some convert, most don't. The agency reports that clicks are up.
Then costs creep up and admits plateau. Most operators don't catch it right away because most agencies aren't reporting cost per admit. They're reporting CPL. Sometimes cost per VOB if you push. The metrics that make the agency look good, not the ones that tell you whether your marketing spend is generating real revenue.
That's not an accident. It's a specialization problem. An agency that works across twenty industries doesn't build reporting infrastructure around the admit. They build it around what they know how to move. Which means you're optimizing the wrong number, often for months, before anyone figures out why the census isn't following the leads.
These benchmarks are drawn from 50+ treatment centers and over $16.5M in managed ad spend — the majority out-of-network facilities, where patient acquisition costs run significantly higher than in-network programs. Across that dataset, the average cost per admit is around $16,000. Top performers running the full system get that number under $8,000. The gap between those two numbers is exactly what this playbook is designed to close.
| Funnel Stage | Avg. Cost | Conversion Rate |
|---|---|---|
| Cost Per Lead | $406 | — |
| Cost Per VOB | $2,552 | 15.9% of leads |
| Cost Per Viable VOB | $5,959 | 42.8% of VOBs |
| Cost Per Admit | $16,608 | 35.9% of viable VOBs |
Enter your admissions goal and quarterly budget — the calculator works backwards through your funnel and tells you whether your spend can realistically support your target, and where the gaps are.
The most important number in that table isn't the CPL. It's the 15.9% — meaning for every 100 leads your campaigns generate, 84 of them never complete a VOB. That gap isn't always a marketing problem. It's a combination of lead quality, speed to contact, and intake process. We cover all three in the Admission Operations section.
Read the full 2025 PPC Benchmark Report →Captures demand that already exists. Someone searching "PHP program accepts Blue Cross" is in the market right now. Paid search puts you in front of them at the moment of highest intent. The targeting lever here is keyword selection and match type — and the difference between a well-structured campaign and a broad match free-for-all is often $5,000 or more per admit.
Creates demand before someone is actively searching. Meta and TikTok let you reach family members of people struggling — by behavior, interest, and demographic — before they ever type a search query. It's higher funnel, longer conversion path, and requires different creative than search. But for facilities trying to reach a specific payer profile or build census in a new market, it's the lever that search alone can't pull.
Both channels get built around the same north star: cost per admit. Not CPL. Not ROAS. The admit.
Paid media is a faucet. Turn it on, leads flow. Turn it off, or watch performance dip, and the pipeline dries up almost immediately. Most facilities understand this intuitively, but fewer act on what it implies: if paid is your only channel, you're one bad month away from a census problem.
Organic is different. It builds slowly, requires real investment, and won't show meaningful results in the first 90 days. That's exactly why most facilities underprioritize it, and exactly why the ones that commit to it end up with such a durable advantage. An SEO engine that's been running for two or three years doesn't care if your Google Ads account has a bad quarter. It keeps generating leads regardless.
For smaller facilities with limited budgets, the organic argument is even more important. Every dollar invested in SEO compounds over time. The content you publish this month is still driving traffic 18 months from now. The rankings you build this year are an asset on your balance sheet in ways that paid spend never will be. We've seen facilities acquired by private equity where the website itself — the domain authority, the content library, the organic traffic — was a meaningful part of the valuation conversation. That's not a marketing outcome. That's a business outcome.
THE GOLD STANDARD
Owning the Page, Not Just Ranking On ItThe facilities winning the most organic admissions aren't just ranking. They're owning the page. A sponsored listing at the top, a position in the top three organic results, and an appearance in the AI overview for the same search query. That's not luck. That's what happens when paid and organic are built as a system, not run in parallel by separate teams optimizing for separate metrics. |
|
Technical foundation, keyword strategy built around treatment intent and payer mix, and rankings that attract patients who are ready to call, not just browsing.
Learn more →Content that answers the questions families ask in a crisis. Every piece mapped to search intent, insurance viability, and level of care, not just traffic volume.
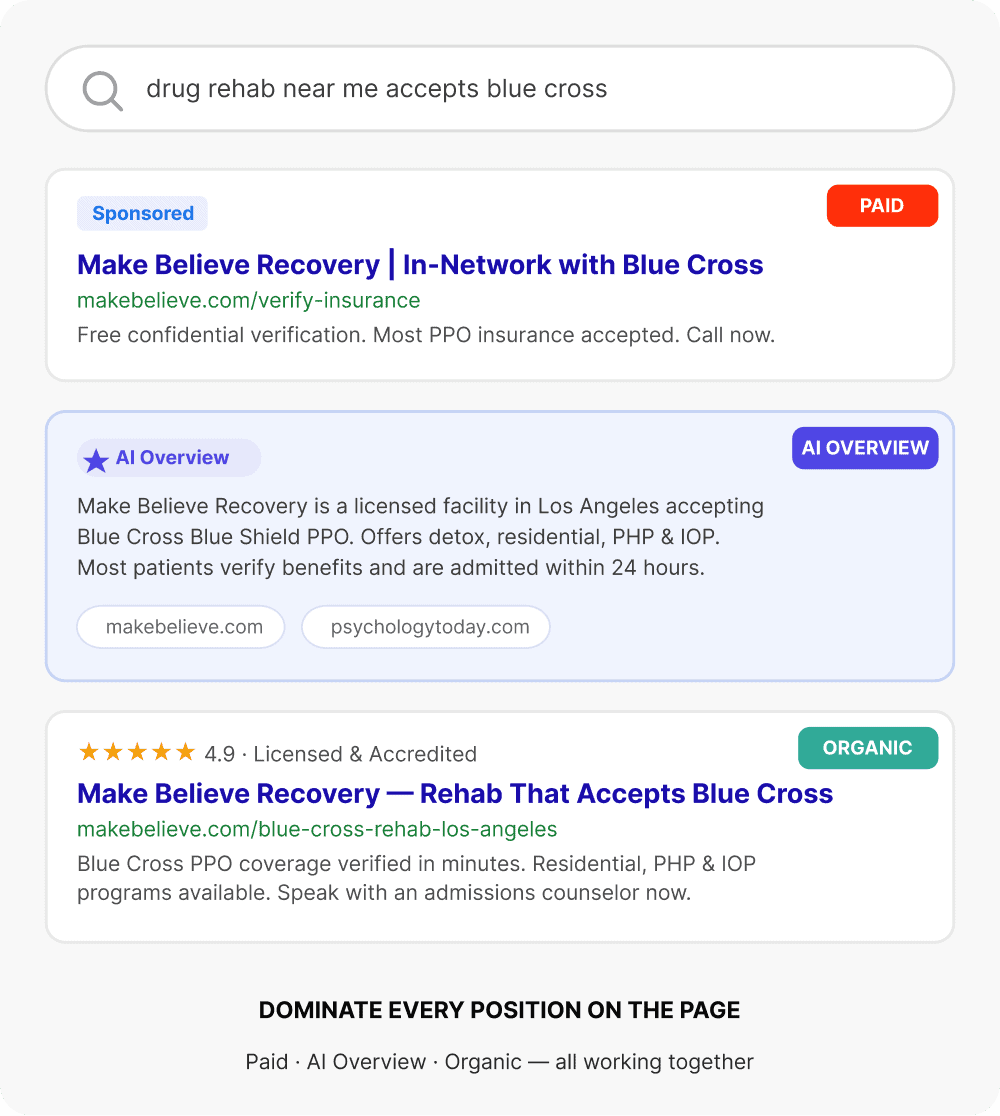
Learn more →Treatment center operators are starting to ask how to show up in AI-generated search results. The answer is authoritative, well-structured content, but the execution is different. We build for both.
Learn more →Backlinks from behavioral health directories, treatment resources, and industry publications that build domain authority and reinforce topical relevance in the eyes of search engines.
Learn more →SoCal Sunrise committed to organic as a primary channel. Eighteen months later: 85 admits attributed directly to organic search, 2,297% ROI, and a website that was generating leads on nights, weekends, and the three days their PPC campaign went dark during a billing issue. That's not a campaign result. That's what the asset looks like when it's mature.
Read the full case study →Organic isn't the fast play. It's the right play. For facilities that want to stop being entirely dependent on paid spend to fill beds, it's the most important long-term investment in the system.
Most facilities spend heavily on driving traffic and almost nothing on what happens when that traffic arrives. The creative is an afterthought. The landing page is the homepage. The form has eight fields. And when leads don't convert, the assumption is that the channel needs more budget.
It's rarely a budget problem. It's a conversion problem.
People needing help can't wait. Every point of friction between a family and your admissions team — a slow page, a confusing layout, a form that asks too much too soon — is a reason to leave. Most centers lose 50 to 80 percent of potential admits at the point of conversion. Not because the marketing failed. Because the experience after the click did.
CRO is the performance layer that makes everything else work harder. Better creative improves paid media efficiency. Better landing pages lift organic conversion rates. Better forms reduce drop-off at the most critical moment in the funnel. It touches every channel without requiring more spend on any of them.
Every 1% lift in conversion rate is a real lift in admissions, impact, and revenue. Same traffic. Same spend. The only variable is how well the experience converts.
| Rehab Center | A | B | C |
|---|---|---|---|
| Site Visitors | 10,000 | 10,000 | 10,000 |
| Conversion Rate | 1% | 2% | 3% |
| Leads Generated | 100 | 200 | 300 |
| New Admits | 10 | 20 | 30 |
| Average Admit Value | $20K | $20K | $20K |
| Revenue Impact | $200,000 | $400,000 | $600,000 |
Most agencies treat CRO as an add-on. We build it into every engagement from day one because a system that drives traffic to an experience that can't convert isn't a system. It's a leak. Our CRO practice covers landing page strategy, ad creative, form optimization, and conversion tracking across every channel we manage.
See Our CRO CapabilitiesAdmission Operations
Every agency in behavioral health marketing will tell you they drive leads. Most of them do. The problem is that a lead is not an admit. And the gap between those two things is where most facilities are quietly hemorrhaging revenue without anyone holding up their hand to take responsibility for it.
We saw it firsthand. We were generating qualified leads for facilities — leads with the right insurance, the right intent, the right level of care fit — and watching them disappear. Calls not returned fast enough. VOBs that sat in a queue. Admissions reps without a structured follow-up sequence. CRMs that weren't tracking where leads dropped. When admits didn't follow, the heat came toward marketing. But the problem wasn't marketing. It was everything that happened after the lead arrived.
No other agency in behavioral health has built a service to fix this. We did because we had nine years of data telling us exactly where the gaps were and the industry expertise to close them.
The Broken Funnel vs. The Optimized Engine
Same 2,500 impressions. Here's what the funnel looks like with and without an optimized admissions operation.
| Stage | Without Ops | With Ops |
|---|---|---|
| Impressions / TAM | 2,500 | 2,500 |
| Leads | 250 | 250 |
| VOBs | 50 (10% CR) | 63 (25% CR) |
| Approved VOBs | 15 (20% CR) | 32 (50% CR) |
| Admits | 3 (3–5% close) | 8 (25% close) |
The marketing didn't change. The admissions engine did.
Lead Intake & Tracking
CRM & Workflow Optimization
VOB & Insurance Ops
Team Enablement & Training
Always-On Admissions
Client Result
This facility was already running Dazos when they came to us. The platform was in place — it just wasn't configured to match how their admissions team actually worked. A 15% missed call rate was leaking inbound leads every month. Close rates on paid media were sitting at 17%. Two months later: close rate at 64%, missed calls down to 1%, and 44 live automations running across intake, VOB, and referral workflows. The marketing didn't change. The admissions operation did.
Read the full case studyA single lost admit can cost a facility $20K–$40K or more in lifetime value. Even one saved conversion per month makes Admission Ops ROI-positive.
The Full Funnel View
Most treatment centers treat marketing as a collection of isolated tactics. An agency runs paid search. A contractor handles SEO. The admissions team works the leads. Nobody owns the full picture — and nobody is accountable when admits don't follow.
The Predictable Patients methodology connects every component of the patient acquisition funnel into a single, measurable system. Strategy informs every channel. Every channel feeds the funnel. The funnel connects to admissions. And every step generates data that makes the next step smarter.
This is how Webserv operates. Not as a vendor running a channel. As a growth partner who owns the outcome from the first impression to the admitted patient.
Free Tool
Enter your ad spend, lead volume, VOB numbers, and monthly admits. Get your cost per lead, cost per VOB, cost per admit, and LTV:CAC ratio — benchmarked against 50+ treatment centers and $16.5M in managed behavioral health ad spend.
Tools & Resources
Every tool, benchmark, playbook, and case study we've built for behavioral health operators. Start with what's relevant to where you are in your patient acquisition system right now.
Benchmarks
Industry data on CPL, cost per VOB, cost per admit, and LTV:CAC across 50+ behavioral health facilities.
Tools
Free calculators and diagnostic tools built specifically for treatment center operators and behavioral health marketers.
Playbooks
Deep-dive guides on every component of the patient acquisition system — written for operators who want to understand the strategy.
Blog
Tactical articles on SEO, paid media, CRO, and admissions operations from nine years in behavioral health marketing.
Glossary
Plain-language definitions for every metric and concept in behavioral health patient acquisition — CPL, LTV:CAC, payer mix, and more.
Preston Powell founded Webserv with a single focus: helping behavioral health facilities grow ethically and sustainably. With 200+ treatment centers served nationwide, he brings a patient-first philosophy to every system Webserv builds.
Paid Admissions Playbook
Paid search, paid social, and CRO strategy built for behavioral health.
Organic Admissions Playbook
SEO, content, digital PR, and AEO as a connected system.
Admission Operations Playbook
CRM, VOB workflow, speed to contact, and team enablement.
LET’S BUILD YOUR SYSTEM
Trusted by 200+ Treatment centers nationwide


